News Posts matching #Benchmark

Return to Keyword Browsing

AMD Ryzen 7 5800X, Ryzen 9 5950X CPU-Z Scores Surface

Scores for AMD's upcoming Zen 3 Ryzen 7 5800X (8 core, 16 thread) and Ryzen 9 5950X (16 core, 32 thread) have surfaced on the CPU-Z benchmark. The results, which should - as always - be taken with appropriate salt, point towards the Ryzen 7 5800X scoring 650 single-core and 6593 points in the multi-threaded benchmark. The Ryzen 9 5950X is rated as scoring 690.2 points in the same single-threaded benchmark and 13306.5 points in the multi-threaded one. CPU-Z scores for the Intel Core i9-10900K (10 cores, 20 threads) are set at 584 and 7389 points respectively. This is further fuel to the fire on AMD's current technology and performance leadership.

AMD Radeon "Big Navi" GPU Benchmarked in Firestrike Ultra

AMD's "Big Navi" GPU is nearing the launch on October 28th, just a few days from now. This means that benchmarks of the card are already appearing across the internet, and we get to see how the card performs. Being divided into two different versions, Big Navi comes in Navi 21 XT and Navi 21 XTX silicon. While the former is available to AMD's AIBs, the latter is rumored to be exclusive to AMD and its reference design, meaning that at least in the beginning, you can only get Navi 21 XTX GPU if you purchase one from AMD directly.

Today, thanks to the Twitter account of CapFrameX, a frame time capturing tool, we have benchmark results of the Big Navi GPU in Firestrike Ultra. According to the people behind this account, the card scores about 11500 points in the benchmark. Compared to NVIDIA's offerings like GeForce RTX 3080, which scores about 10600, the AMD card is 8.5% faster. It is not known whatever this is Navi 21 XT or Navi 21 XTX silicon, however, we can assume that it is the former, and AMD is keeping the XTX revision to themselves for now. This result could be a leak from some of the AIBs, so it could not be the final Big Navi performance. All of this information should be taken with a grain of salt.

AMD Ryzen 5 5600X Benchmarked, Conquers Intel Core i5-10600K

Since AMD announced its next-generation Ryzen 5000 series desktop processors based on Zen 3 core, everyone has been wondering how the new processors perform. For a detailed review and performance numbers, you should wait for official reviews. However, today we have the scores of Ryzen 5 5600X CPU. Thanks to the popular hardware leaker @TUM_APISAK, the Ryzen 5 5600X performance numbers in the SiSoftware Sandra benchmark suite have been leaked. When digging under the hood, the new Ryzen CPU contains six of Zen 3 cores with 12 threads, paired with as much as 32 MB of level three (L3) cache. These cores are running at 3.7 GHz base frequency, while the boost speeds are reaching 4.6 GHz.

In the test results, the AMD Ryzen 5 5600X CPU has scored Processor Arithmetic and Processor Multi-Media scores of 255.22 GOPS and 904.38 Mpix/s. These scores are not much on their own until we compare them to some of the Intel offerings. When compared to the Intel Core i5-10600K CPU, which is likely its targeted competing category, it scores 224.07 GOPS and 662.33 Mpix/s for Processor Arithmetic and Processor Multi-Media tests respectively. This puts the AMD CPU ahead 13.9% and 36.5% in these tests, indicating the possibility of Zen 3. Another important note here is the thermal headroom both of these CPUs run. While the Intel model is constrained withing 125 W TDP, the AMD model runs at just 65 W TDP. This could be an indication of the efficiency that these new processors harness.

Basemark Launches GPUScore Relic of Life RayTracing Benchmark

Basemark is pioneer in GPU benchmarking. Our current product Basemark GPU has been improving the 3D graphics industry since 2016. After releasing GPU 1.2 in March Basemark development team has been really busy developing brand new benchmark - GPUScore. GPUScore benchmark will introduce hyper realistic, true gaming type of content in three different workloads: Relic of Life, Sacret Path and Expedition.

GPUScore Relic of Life is targeted to benchmark high end graphics cards. It is completely new benchmark with many new features. The key new feature is real-time ray traced reflections and reflections of reflections. The benchmark will not only support Windows & DirectX 12, but also Linux & Vulkan raytracing.

AMD Big Navi Performance Claims Compared to TPU's Own Benchmark Numbers of Comparable GPUs

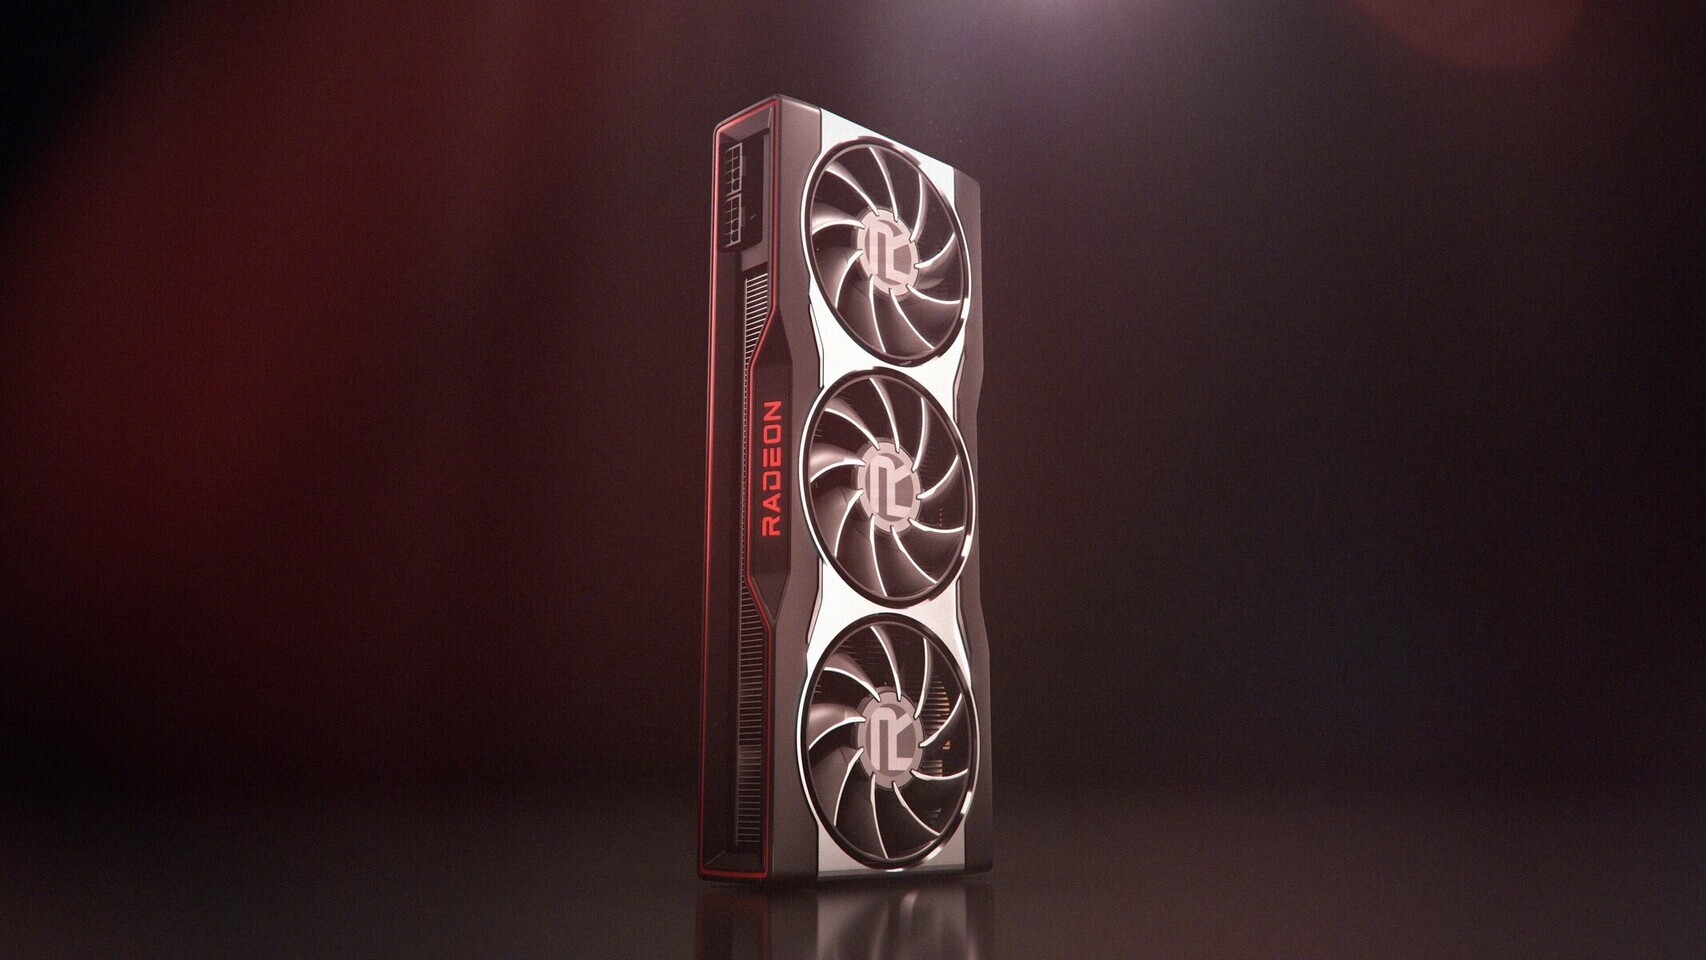
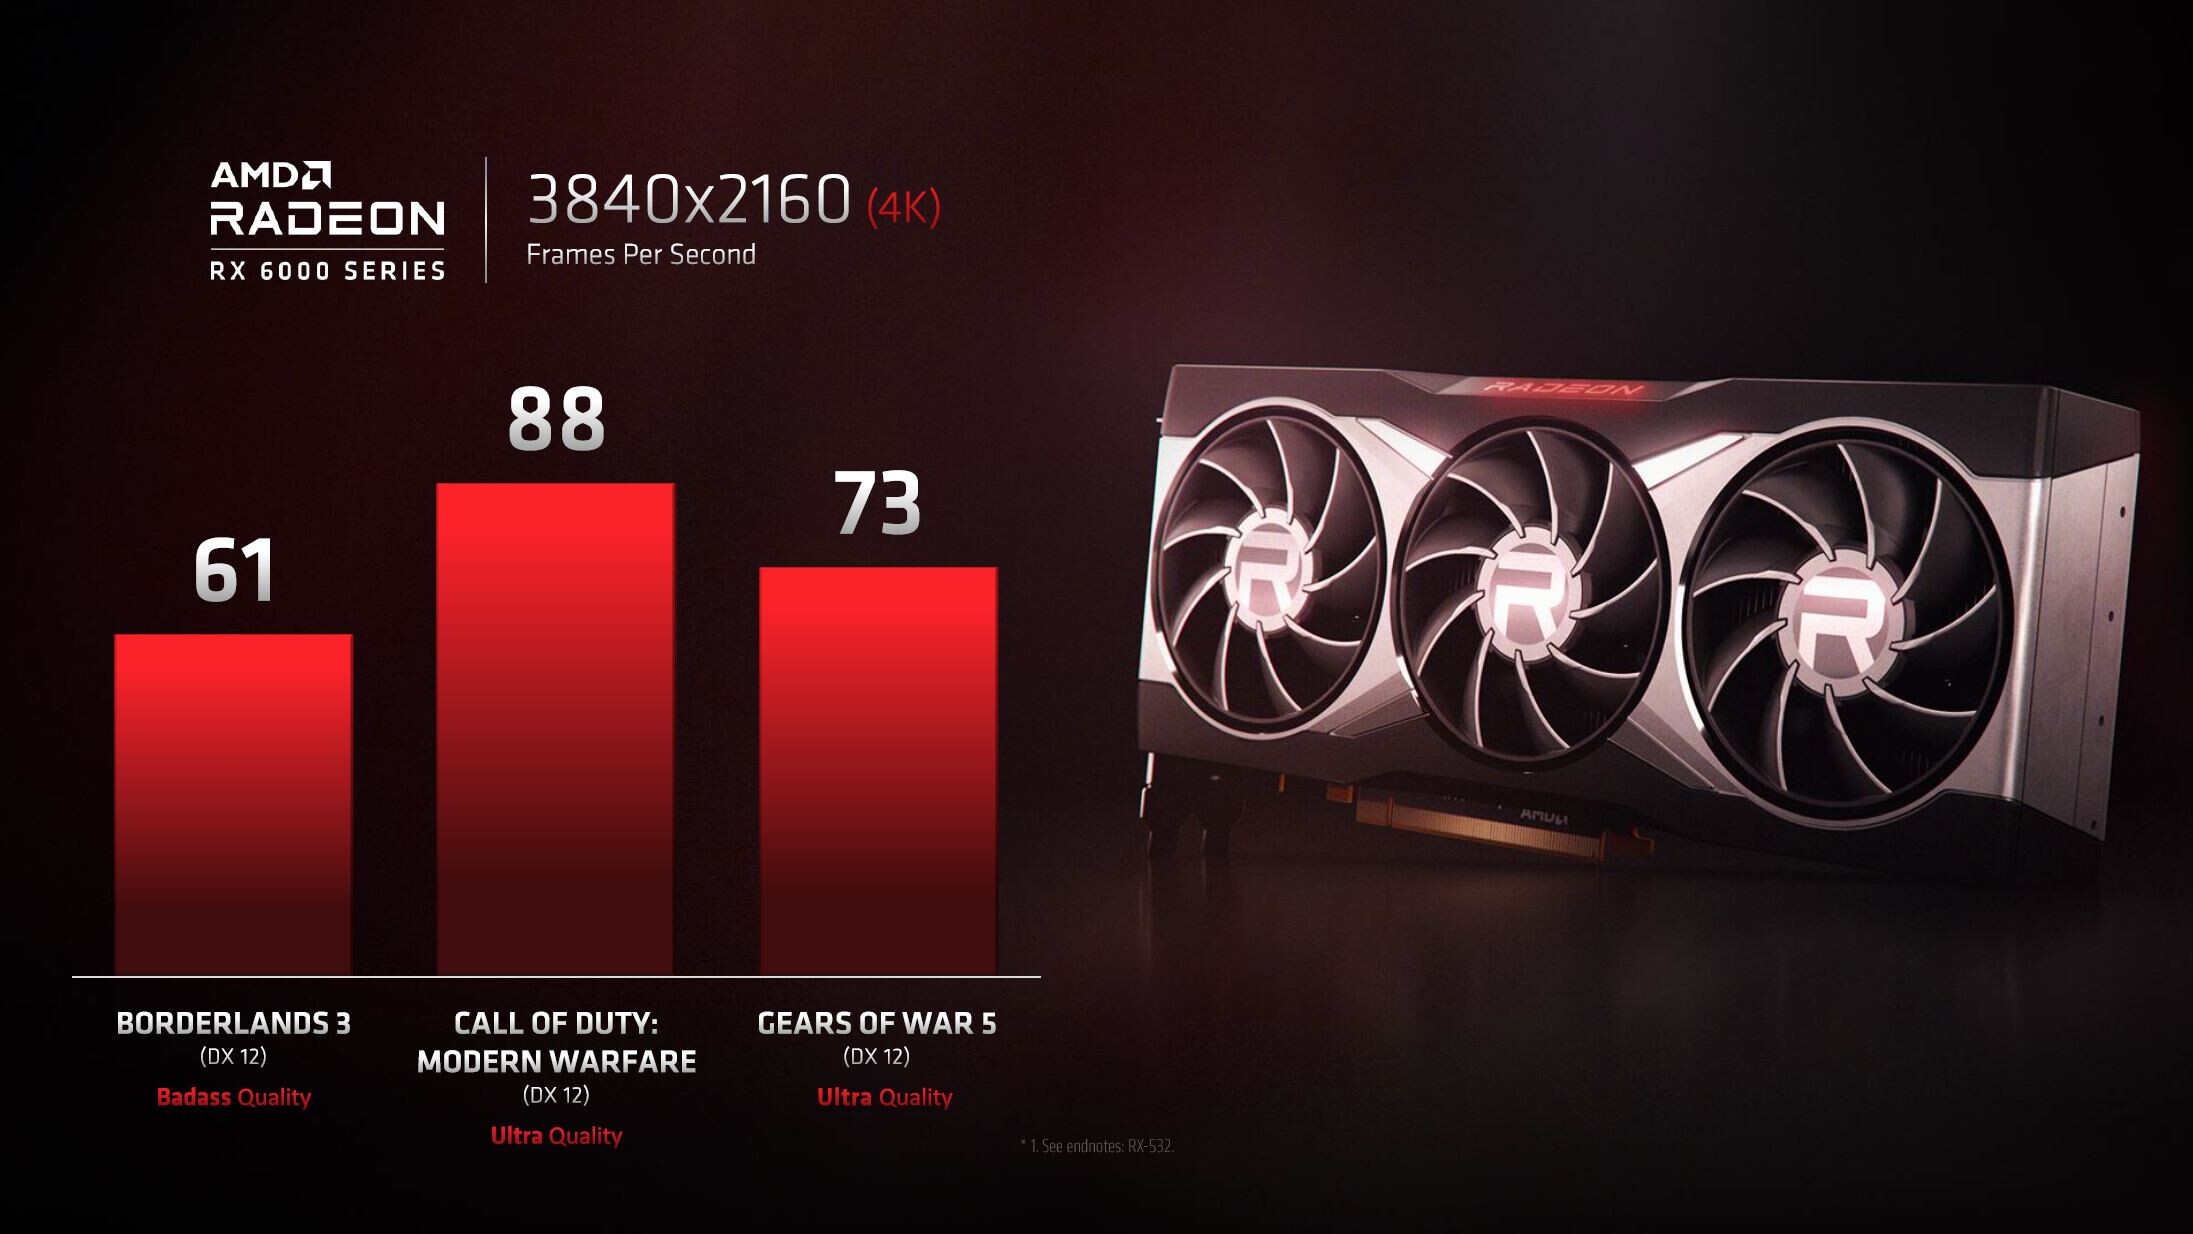
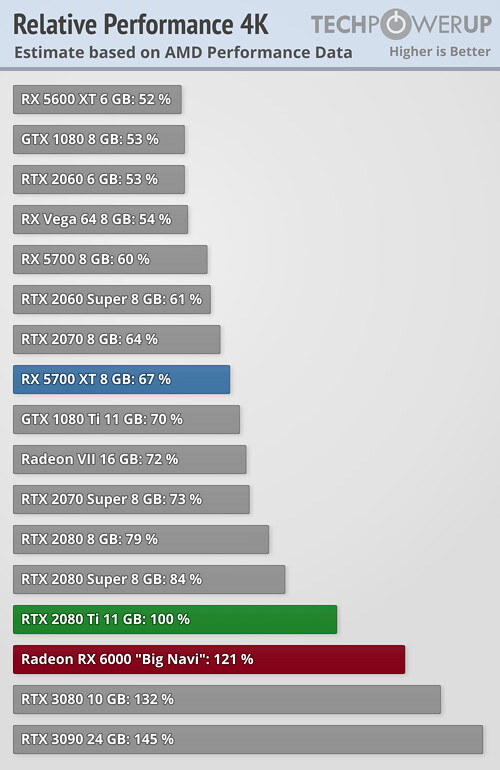
AMD in its October 8 online launch event for the Ryzen 5000 "Zen 3" processors, provided a teaser of the company's next flagship graphics card slotted in the Radeon RX 6000 series. This particular SKU has been referred to by company CEO Lisa Su as "Big Navi," meaning it could be the top part from AMD's upcoming client GPU lineup. As part of the teaser, Su held up the reference design card, and provided three performance numbers of the card as tested on a machine powered by a Ryzen 9 5900X "Zen 3" processor. We compared these performance numbers, obtained at 4K UHD, with our own testing data for the games, to see how the card compares to other current-gen cards in its class. Our testing data for one of the games is from the latest RTX 30-series reviews, find details of our test bed here. We obviously have a different CPU since the 5900X is unreleased, but use the highest presets in our testing.

With "Borderlands 3" at 4K, with "badass" performance preset and DirectX 12 renderer, AMD claims a frame-rate of 61 FPS. We tested the game with its DirectX 12 renderer in our dedicated performance review (test bed details here). AMD's claimed performance ends up 45.9 percent higher than that of the GeForce RTX 2080 Ti as tested by us, which yields 41.8 FPS on our test bed. The RTX 3080 ends up 15.24 percent faster than Big Navi, with 70.3 FPS. It's important to note here that AMD may be using a different/lighter test scene than us, since we don't use internal benchmark tools of games, and design our own test scenes. It's also important to note that we tested Borderlands 3 with DirectX 12 only in the game's launch-day review, and use the DirectX 11 renderer in our regular VGA reviews.

NVIDIA A100 Ampere GPU Benchmarked on MLPerf

When NVIDIA announced its Ampere lineup of the graphics cards, the A100 GPU was there to represent the higher performance of the lineup. The GPU is optimized for heavy computing workloads as well as machine learning and AI tasks. Today, NVIDIA has submitted the MLPerf results on the A100 GPU to the MLPerf database. What is MLPerf and why it matters you might think? Well, MLPerf is a system benchmark designed to test the capability of a system for machine learning tasks and enable comparability between systems. The A100 GPU got benchmarked in the latest 0.7 version of the benchmark.

The baseline for the results was the previous generation king, V100 Volta GPU. The new A100 GPU is average 1.5 to 2.5 times faster compared to V100. So far A100 GPU system beats all offers available. It is worth pointing out that not all competing systems have been submitted, however, so far the A100 GPU is the fastest.
The performance results follow:

Intel Ice Lake-SP Processors Get Benchmarked Against AMD EPYC Rome

Intel is preparing to launch its next-generation for server processors and the next in line is the Ice Lake-SP 10 nm CPU. Featuring a Golden Cove CPU and up to 28 cores, the CPU is set to bring big improvements over the past generation of server products called Cascade Lake. Today, thanks to the sharp eye of TUM_APISAK, we have a new benchmark of the Ice Lake-SP platform, which is compared to AMD's EPYC Rome offerings. In the latest GeekBench 4 score, appeared an engineering sample of unknown Ice Lake-SP model with 28 cores, 56 threads, a base frequency of 1.5 GHz, and a boost of 3.19 GHz.

This model was put in a dual-socket configuration that ends up at a total of 56 core and 112 threads, against a single 64 core AMD EPYC 7442 Rome CPU. The dual-socket Intel configuration scored 3424 points in the single-threaded test, where AMD configuration scored notably higher 4398 points. The lower score on Intel's part is possibly due to lower clocks, which should improve in the final product, as this is only an engineering sample. When it comes to the multi-threaded test, Intel configuration scored 38079 points, where the AMD EPYC system did worse and scored 35492 points. The reason for this higher result is unknown, however, it shows that Ice Lake-SP has some potential.

NVIDIA Ampere A100 GPU Gets Benchmark and Takes the Crown of the Fastest GPU in the World

When NVIDIA introduced its Ampere A100 GPU, it was said to be the company's fastest creation yet. However, we didn't know how fast the GPU exactly is. With the whopping 6912 CUDA cores, the GPU can pack all that on a 7 nm die with 54 billion transistors. Paired with 40 GB of super-fast HBM2E memory with a bandwidth of 1555 GB/s, the GPU is set to be a good performer. And how fast it exactly is you might wonder? Well, thanks to the Jules Urbach, the CEO of OTOY, a software developer and maker of OctaneRender software, we have the first benchmark of the Ampere A100 GPU.

Scoring 446 points in OctaneBench, a benchmark for OctaneRender, the Ampere GPU takes the crown of the world's fastest GPU. The GeForce RTX 2080 Ti GPU scores 302 points, which makes the A100 GPU up to 47.7% faster than Turing. However, the fastest Turing card found in the benchmark database is the Quadro RTX 8000, which scored 328 points, showing that Turing is still holding well. The result of Ampere A100 was running with RTX turned off, which could yield additional performance if RTX was turned on and that part of the silicon started working.

AMD Preparing Additional Ryzen 4000G Renoir series SKUs, Ryzen 7 Pro 4750G Benchmarked

AMD Ryzen 4000 series of desktop APUs are set to be released next month as a quiet launch. What we expected to see is a launch covering only a few models ranging from Ryzen 3 to Ryzen 7 level, meaning that there would be configurations equipped with anything from 4C/8T to 8C/16T. In the beginning thanks to all the leaks we expected to see six models (listed in the table below), however thanks to discovery, we could be looking at even more SKUs of the Renoir family of APUs. Mentioned in the table are some new entries to both consumer and pro-grade users which means AMD will probably do a launch of both editions, possibly on the same day. We are not sure if that is the case, however, it is just a speculation.
AMD Ryzen 4000G Renoir SKUs

AMD Ryzen 7 3800XT Put Through AotS Benchmark

AMD's upcoming Ryzen 7 3800XT 8-core/16-thread processor was put through "Ashes of the Singularity" (AotS) benchmark, as uncovered by HardwareLeaks (_rogame). Paired with an NVIDIA GeForce RTX 2080 graphics card, the processor is able to put out CPU frame-rates of 113.2 FPS (averaging all batches); 135.9 FPS in the normal batch, 115.31 FPS in the medium batch, and 95.49 FPS in the heavy batch, with preset level set to "Crazy_1080p." An older article points to the 3800XT ticking at 4.20 GHz base with 4.70 GHz maximum boost (compared to 3.90 GHz base and 4.50 GHz boost of the 3800X), which means AMD aims to shore up gaming performance of its 3rd gen Ryzen processors with the XT series.

Benchmarks Surface for AMD Ryzen 4700G, 4400G and 4200G Renoir APUs

Renowned leaker APISAK has digged up benchmarks for AMD's upcoming Ryzen 4700G, 4400G and 4200G Renoir APUs in 3D Mark. These are actually for the PRO versions of the APUs, but these tend to be directly comparable with AMD's non-PRO offerings, so we can look at them to get an idea of where AMD's 4000G series' performance lies. AMD's 4000G will be increasing core-counts almost across the board - the midrange 4400G now sports 6 cores and 12 threads, which is more than the previous generation Ryzen 5 3400G offered (4 cores / 8 threads), while the top-of-the-line 4700G doubles the 3400G's core-cpount to 8 physical and 16 logical threads.

This increase in CPU cores, of course, has implied a reduction in the area of the chip that's dedicated to the integrated Vega graphics GPU - compute units have been reduced from the 3400G's 11 down to 8 compute units on the Ryzen 7 4700G and 7 compute units on the 4400G - while the 4200G now makes do with just 6 Vega compute units. Clocks have been severely increased across the board to compensate the CU reduction, though - the aim is to achieve similar GPU performance using a smaller amount of semiconductor real-estate.

Crytek Releases Hardware-Agnostic Raytracing Benchmark "Neon Noir"

Crytek today released the final build for their hardware-agnostic raytracing benchmark. Dubbed Neon Noir, the benchmark had already been showcased in video form back in March 2019, but now it's finally available for download for all interested parties from the Crytek Marketplace. The benchmark currently doesn't support any low-level API such as Vulkan or DX 12, but support for those - and the expected performance improvements - will be implemented in the future.

Neon Noir has its raytracing chops added via an extension of CRYENGINE's SVOGI rendering tool that currently Crytek's games use, including Hunt: Showdown, which will make it easier for developers to explore raytracing implementations that don't require a particular hardware implementation (such as RTX). However, the developer has added that they will add hardware acceleration support in the future, which should only improve performance, and will not add any additional rendering features compared to those that can be achieved already. What are you waiting for? Just follow the link below.

Intel Core i9-10980XE "Cascade Lake-X" Benchmarked

One of the first reviews of Intel's new flagship HEDT processor, the Core i9-10980XE, just hit the web. Lab501.ro got their hands on a freshly minted i9-10980XE and put it through their test bench. Based on the "Cascade Lake-X" silicon, the i9-10980XE offers almost identical IPC to "Skylake-X," but succeeds the older generation with AI-accelerating DLBoost instruction-set, an improved multi-core boosting algorithm, higher clock speeds, and most importantly, a doubling in price-performance achieved by cutting the cores-per-Dollar metric by half, across the board.

Armed with 18 cores, the i9-10980XE is ahead of the 12-core Ryzen 9 3900X in rendering and simulation tests, although not by much (for a chip that has 50% more cores). This is probably attributed to the competing AMD chip being able to sustain higher all-core boost clock speeds. In tests that not only scale with cores, but are also hungry for memory bandwidth, such as 7-zip and Media, Intel extends its lead thanks to its quad-channel memory interface that's able to feed its cores with datasets faster.

Intel Iris Plus Graphics G7 iGPU Beats AMD RX Vega 10: Benchmarks

Intel is taking big strides forward with its Gen11 integrated graphics architecture. Its performance-configured variant, the Intel Iris Plus Graphics G7, featured in the Core i7-1065G7 "Ice Lake" processor, is found to beat AMD Radeon RX Vega 10 iGPU, found in the Ryzen 7 2700U processor ("Raven Ridge"), by as much as 16 percent in 3DMark 11, a staggering 23 percent in 3DMark FireStrike 1080p. Notebook Check put the two iGPUs through these, and a few game tests to derive an initial verdict that Intel's iGPU has caught up with AMD's RX Vega 10. AMD has since updated its iGPU incrementally with the "Picasso" silicon, providing it with higher clock speeds and updated display and multimedia engines.

The machines tested here are the Lenovo Ideapad S540-14API for the AMD chip, and Lenovo Yoga C940-14IIL with the i7-1065G7. The Iris Plus G7 packs 64 Gen11 execution units, while the Radeon RX Vega 10 has 640 stream processors based on the "Vega" architecture. Over in the gaming performance, and we see the Intel iGPU 2 percent faster than the RX Vega 10 at Bioshock Infinite at 1080p, 12 percent slower at Dota 2 Reborn 1080p, and 8 percent faster at XPlane 11.11.

AMD Radeon RX 5500 Gets Benchmarked

AMD is preparing lower-end variants of its NAVI GPUs based on new RDNA graphics card architecture, which will replace all the existing cards based on aging GCN architecture. Today, AMD's upcoming Radeon RX 5500, as it is called, got benchmarked in GFXBench - a cross-platform benchmark which features various kinds of test for Windows, MacOS, iOS and Android.

The benchmark was run on Windows OS using OpenGL API. It only ran the "Manhattan" high-level test, which yielded a result of 5430 frames in total or about 87.6 frames per second. When compared to something like RX 5700 XT, which scored 8905 frames in total and 143.6 FPS, RX 5500 clearly seems positioned at the lower end of NAVI GPU stack. Despite the lack of details, we can expect this card to compete against NVIDIA's GeForce GTX 1660/1660 Ti GPUs where AMD has no competing offer so far.

3DMark Introduces Variable Rate Shading Benchmark

3DMark today announced they've introduced a new benchmarking feature. Specifically developed to test Variable Rate Shading (VRS) performance and image quality differences, the new feature allows users to actually visualize the performance and image quality differences associated with more aggressive (or less aggressive) VRS settings. The algorithm is a smart one - it aims to reduce the number of pixel shader operations on surfaces where detail isn't as important (such as frame edges, fast-moving objects, darkened areas, etc) so as to improve performance and shave some precious milliseconds in the deployment of each frame.

To run this test, you will need Windows 10 version 1903 or later and a DirectX 12 GPU that supports Tier 1 VRS and the "AdditionalShadingRatesSupported" capability, such as an NVIDIA Turing-based GPU or an Intel Ice Lake CPU. The VRS feature test is available now as a free update for 3DMark Advanced Edition, or from now until September 2, 3DMark is 75% off when you buy it from Steam or the UL benchmarks website.

NVIDIA GeForce RTX 2080 Super Appears in FFXV Benchmark Database

Results of NVIDIA's upcoming GeForce RTX 2080 Super graphics cards have been revealed in Final Fantasy XV benchmark database, where the card is compared against other offerings at 2560 x 1440 resolution using high quality settings. The card scored 8736 points, while its predecessor, RTX 2080, scored 8071 points at same resolution and settings. This shows around 8 % improvement in favor of newer model, which is to be expected given the increase in memory speed going from 14 Gbps to 15.5 Gbps and CUDA core count which increased from 2944 cores to 3072. With this improvement, RTX 2080 Super is now only 105 points (about one percent) behind TITAN V graphics card in FFXV benchmark. If you wish to compare results for yourself, you can do so here.

GeForce RTX 2070 Super Beats Radeon 5700 XT in FFXV Benchmark

In a recent submission to the Final Fantasy XV Benchmark database, upcoming new NVIDIA GeForce RTX 2070 Super GPU has been benchmarked. The new submission is coming just a few days before the Super series officially launches. On benchmark's tests, RTX 2070 Super has scored 7479 points at 1440p resolution on high quality settings, which is almost 12% increase from previous generation 2070, which scored 6679. The performance seem to be attributed to increased CUDA core count, which is rumored to increase about 11%, making the result seem pretty realistic.

When compared to AMD's upcoming Radeon 5700 XT, which also got submitted to FFXV Benchmark database and has scored 5575 at same settings, the RTX 2070 Super is about 34% faster.

UL Releases PCI Express Feature Test For 3DMark Ahead of PCIe 4.0 Hardware

With PCI-Express 4.0 graphics cards and motherboards soon to arrive, UL has released their PCI Express feature test for 3DMark. This latest addition has been designed to verify the bandwidth available to the GPU over a computer's PCI Express interface. To accomplish this, the test will make bandwidth the limiting factor for performance and does so by uploading a large amount of vertex and texture data to the GPU for each frame. The end goal is to transfer enough data over the PCIe 4.0 interface to thoroughly saturate it. Once the test is complete, the end result will be a look at the average bandwidth achieved during the test.

Intel Puts Out Benchmarks Showing Minimal Performance Impact of MDS Mitigation

Intel Tuesday once again shook the IT world by disclosing severe microarchitecture-level security vulnerabilities affecting its processors. The Microarchitectural Data Sampling (MDS) class of vulnerabilities affect Intel CPU architectures older than "Coffee Lake" to a greater extent. Among other forms of mitigation software patches, Intel is recommending that users disable HyperThreading technology (HTT), Intel's simultaneous multithreading (SMT) implementation. This would significantly deplete multi-threaded performance on older processors with lower core-counts, particularly Core i3 2-core/4-thread chips.

On "safer" microarchitectures such as "Coffee Lake," though, Intel is expecting a minimal impact of software patches, and doesn't see any negative impact of disabling HTT. This may have something to do with the 50-100 percent increased core-counts with the 8th and 9th generations. The company put out a selection of benchmarks relevant to client and enterprise (data-center) use-cases. On the client use-case that's we're more interested in, a Core i9-9900K machine with software mitigation and HTT disabled is negligibly slower (within 2 percent) of a machine without mitigation and HTT enabled. Intel's selection of benchmarks include SYSMark 2014 SE, WebXprt 3, SPECInt rate base (1 copy and n copies), and 3DMark "Skydiver" with the chip's integrated UHD 630 graphics. Comparing machines with mitigations applied but toggling HTT presents a slightly different story.

Announcing DRAM Calculator for Ryzen v1.5.0 with an Integrated Benchmark

Yuri "1usmus" Bubliy, who practically wrote the book on AMD Ryzen memory overclocking, presents DRAM Calculator for Ryzen v1.5.0, the latest version of the most powerful tool available to help you overclock memory on PCs powered by AMD Ryzen processors. The biggest feature-addition is MEMBench, a new internal memory benchmark that tests performance of your machine's memory sub-system, and can be used to test the stability of your memory overclock. Among the other feature-additions include the "Compare Timings" button, which gives you a side-by-side comparison of your machine's existing settings, with what's possible or the settings you've arrived at using the app.

Motherboards vary by memory slot topology, and DRAM Calculator for Ryzen can now be told what topology your board has, so it can better tune settings such as procODT and RTT. The author also de-cluttered the main screen to improve ease of use. Among the under-the-hood changes are improved SoC voltage prediction for each generation of Ryzen. The main timing calculation and prediction algorithms are improved with the addition of the likes of GDM prediction. Also added is support for 4-DIMM system configurations. A bug in which the imported HTML profiles were automatically assumed to be specific to Samsung b-die mode. A number of minor changes were made, detailed in the change-log below.

DOWNLOAD: DRAM Calculator for Ryzen by 1usmus

Maxon Releases Cinebench R20 Benchmark

Maxon Tuesday unveiled its Cinebench R20 benchmark designed to test CPU performance at photorealistic rendering using the company's Cinema 4D R20 technology. The benchmark runs on any PC with at least 4 GB of memory and SSE3 instruction-set support, although it can scale across any number of cores, memory, and supports exotic new instruction-sets such as AVX2. Maxon describes Cinebench R20 as using four times the memory, and eight times the CPU computational power as Cinebench R15. The benchmark implements Intel Embree ray-tracing engine. Maxon is distributing Cinebench R20 exclusively through the Microsoft Store on the Windows platform.

Unlike its predecessor, Cinebench R20 lacks a GPU test. The CPU test scales by the number of CPU cores and SMT units available. It consists of a tiled rendering of a studio apartment living room scene by Render Baron, which includes ray-traced elements, high resolution textures, illumination, and reflections. The number of logical processors available determines the number of rendering instances. The benchmark does indeed have a large memory footprint, and rewards HTT or SMT and high clock-speeds, as our own quick test shows. A 4-core/8-thread Core i7-7700K beats our Core i5-9400F 6-core/6-thread processor.

Update (11th March): We have removed the portable version download at Maxon's request.
DOWNLOAD: Maxon Cinebench R20 (Microsoft Store)

UL Corporation Announces Two New Benchmarks Coming to PCMark 10

UL Corporation today announces that two new benchmark tests that will soon be coming to PCMark 10. The first is our eagerly awaited PCMark 10 battery life benchmark. The second is a new benchmark test based on Microsoft Office applications.

PCMark 10 Battery Life benchmark
Battery life is one of the most important criteria for choosing a laptop, but consumers and businesses alike find it hard to compare systems fairly. The challenge, of course, is that battery life depends on how the device is used. Unfortunately, manufacturers' claims are often based on unrealistic scenarios that don't reflect typical use. Figures for practical, day-to-day battery life, which are usually much lower, are rarely available.

NVIDIA GTX 1660 Ti to Perform Roughly On-par with GTX 1070: Leaked Benchmarks

NVIDIA's upcoming "Turing" based GeForce GTX 1660 Ti graphics card could carve itself a value proposition between the $250-300 mark that lets it coexist with both the GTX 1060 6 GB and the $350 RTX 2060, according to leaked "Final Fantasy XV" benchmarks scored by VideoCardz. In these benchmarks, the GTX 1660 Ti was found to perform roughly on par with the previous-generation GTX 1070 (non-Ti), which is plausible given that the 1,536 CUDA cores based on "Turing," architecture, with their higher IPC and higher GPU clocks, are likely to catch up with the 1,920 "Pascal" CUDA cores of the GTX 1070, while 12 Gbps 192-bit GDDR6 serves up more memory bandwidth than 8 Gbps 256-bit GDDR5 (288 GB/s vs. 256 GB/s). The GTX 1070 scores in memory size, with 8 GB of it. NVIDIA is expected to launch the GTX 1660 Ti later this month at USD $279. Unlike the RTX 20-series, these chips lack NVIDIA RTX real-time raytracing technology, and DLSS (deep-learning supersampling).

Anthem VIP Demo Benchmarked on all GeForce RTX & Vega Cards

Yesterday, EA launched the VIP demo for their highly anticipated title "Anthem". The VIP demo is only accessible to Origin Access subscribers or people who preordered. For the first hours after the demo launch, many players were plagued by servers crashes or "servers are full" messages. Looks like EA didn't anticipate the server load correctly, or the inrush of login attempts revealed a software bug that wasn't apparent with light load.

Things are running much better now, and we had time to run some Anthem benchmarks on a selection of graphics cards, from AMD and NVIDIA. We realized too late that even the Anthem Demo comes with a five activation limit, which gets triggered on every graphics card change. That's why we could only test eight cards so far.. we'll add more when the activations reset.
Return to Keyword Browsing
May 15th, 2024 16:58 EDT change timezone

New Forum Posts

Popular Reviews

Controversial News Posts