

Hardware Labs Black Ice 480GTX Radiator Full Review
Introduction
Welcome to my pressure drop testing of the HWlabs Black Ice GTX 480. That's right it's a 480 (4each X 120mm fans), and this is the only radiator on the market to hold not three but four full 120mm fans. I would like to give special thanks to Jeremy from Danger Den for sending me this radiator sample for testing. These 480GTX radiators have been very popular amongst the extreme forum members and it was nice to get my hands on two of these beauties to step up another notch in my own system.

With this review I will initially focus on pressure drop testing as well as thermal performance. First off, let's take a look at the size comparison of the 480GTX next to the PA 120.3. They are both extremely thick radiators, and the 480GTX is simply one more fan long. I'm a strong believer in recommending as much radiator as you can possibly fit. When it comes to water cooling, the biggest advantage comes with the ability to dissipate heat over a much larger surface area than you can with conventional tower air cooler, so you might as well go BIG and the 480GTX does just that!...It's HUGE!!

Radiator Characteristics
The radiator is a very thick and dense finned designed for medium to high speed fans. Here are some characteristics I noted:- Dual Row Tubes, Dual pass flow
- Top Chamber splits flow to front and rear of radiator instead of the typical side to side configuration.
- Brass 19.0 x 1.2mm Ultra Thin Tubes for Increase Heat Transfer
- Copper Non-Louvered Fins arranged with a splitter fin (two rows between tubes)
- Brass Water Chambers
- G1/4" Threads
- 517mm x 133mm x 54mm
(L x W x H) - I measure approximately 20 folds per inch, see fin detail photos below.
- Electrostatic polyurethane painting finish for uniform coating with high temperature curing for increased finish durability.
Ultra Thin 19.0mm x 1.2mm Tubes
HWlabs incorporates a much thinner tube that is intended to improve heat transfer and improve air flow through the radiator. The idea being with a very thin and flat tube, that you have less hot water passing by and not making contact with the tubing to transfer heat. In addition the thinner tubing will improve velocities similar to the effect of a nozzle in a CPU block. Increased velocities because of this tighter passage results in improved turbulence which further improves heat transfer. Unfortunately just like nozzles in a water block, there is a tradeoff in restriction to obtain these thinner tube thermal efficiency advantages.
Front to Rear Two Pass Flow
Most radiators develop the 2 pass flow orientation by either separated top chambers or a dividing plate in the top chamber, then water flows down one side, passes across in the bottom chamber and back up the other side of the radiator. HWlabs has incorporated a front to rear 2 pass design as shown below to develop a hot and cold side of the radiator. This does however require a more complex barb tube to transfer fluids from the back of the top chamber to the barb location.
Compact Core High Density Fin Structure
HWlabs also has a higher density fin structure optimized for medium to high speed fans (although you'll see "Slow Speed" fans do well also). It has a couple of unique features. Fist the "Folds Per Inch" is on the order of 20 folds as opposed to the 11 of the PA120.3 and Fesser fin densities. Also it has a compact core in which is uses another layer of copper sheet between the folds to allow double rows of fin folds in between each set of tubes. In addition the GTX fins themselves are not louvered, instead it is relying on the density of the structure for turbulence and heat transfer (Less dust getting trapped in louvers). All of this is purposely part of the design to maximize the total surface area and the contact area between the tubes and fin structure. This added heat transfer area means it should be able to exchange more heat with less air. Below is a fin comparison of pictures at the same scale for the 480GTX, PA120.3, and a prototype of the new Feser X-Changer.
Hydraulics and Pressure Drop Testing
The most scientific way to determine a blocks hydraulic resistance is to test pressure drop. Pressure drop is a measurement of pressure loss across a radiator that varies with flow rate. This is basically a measurement of energy loss, and directly influences how much flow rate you will have.
- Dwyer Digital Manometer 477 Mark V - Accuracy .5% of Full Scale. Range 0-20.00 PSI range, Resolution .01 PSI
- King Instruments 7520 Series 0-5GPM, 250mm scale - Accuracy 2% of Full Scale. Range 0-5GPM, Resolution .1 GPM (can be interpolated to .02GPM)
- Water Source - Household water pressure - 50PSI at >5GPM - Because flow
rate readings are instantaneous, household tap water and water pressure are a
good and powerful source for pressure drop testing.

Thermal Testing Specifications
Welcome to my thermal testing of this radiator, but first I would like to give special thanks to Linus from NCIX.com for providing me with two sets of fans for testing. They provided me with both the Yate Loon D12SL12 slow speed 47cfm 120x25mm fans, as well as this Scythe Ultra Kaze DFS123812-3000 high speed 136cfm 120x38mm fans. Both fans present great value and a strong variety of cfm coverage for different setups.
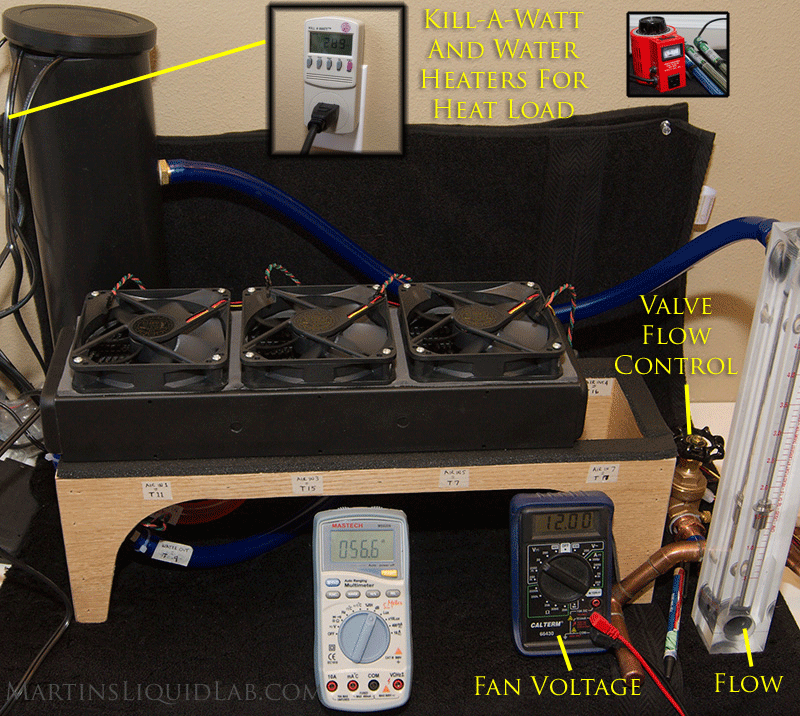
I'm taking the "Scientific" approach to testing the radiator, and doing so by using and measuring an external heat source and apply two heat loads across 5 different fan scenarios. Using the two heat loads allows me to check my work, average out error, use higher heat loads than needed for measure larger differences, and finally allows me to use more accurate thermal sensors than those available in a processor. In the end I am then able to calculate a linear which produces a c/w ratio for each fan type. This is a very handy ratio for estimating, (c/w stands for degrees Celcius above ambient per watt of heat). Having the c/w ratio allows you to estimate the water temperature for any heat load....ahhh we have science and a TOOL!. Furthermore, because I'm testing over a large range of fan scenarios, I can then plot the fan RPM relative to the c/w values generated. While RPM from two fan types is not a direct performance relation(Pressure is equally as important), it suprisingly still creates a decent power trendline curve. Regardless, the real advantage to do this RPM vs C/W chart is gaining perspective on how the radiator's performance changes over the use of different fan types. In general you will see as radiators are more dense and thicker, they will have a larger varience in performanc from the lower speed/pressure fan types to higher speed fan types.
In addition to the "Scientific" approach, I'm also going a bit extreme on the sensors I'm deploying to measure all of this. Because this c/w ratio is a measurement of "Air" into the radiator, you have to seriously consider how much variability there is in air temperatures throughout a room and even across the radiator. Air is actually considered an insulator, so if you don't measure air at several locations and average them, the amount of error is higher than you would expect. Some of the measurements may only be a few degrees at lower heat loads, so is almost a must to measure with higher accuracy thermometers, use several to measure several point, and log temperatures over a long period of time. With that, I've decided I would employ at least two digital sensors per 120mm section of radiator with a .2C mean error, and of course logging temperatures over at least 30minutes after an appropriate 30minute warm up period. All of this helps make up for the fact that I do not have an environmental chamber with controlled and consistent air temperatures.
With all of this, I'm able to get a pretty good and accurate understanding of how you can estimate performance depending on the fan used and generate some decent information. Below are some more details and links of the radiator testing equipment used:
Radiator Testing Specifications:
- Thermal Temperature and Fan RPM Monitoring - CrystalFontz CFA-633 32 Channels of temperature, 4 channels of fan RPM, Logging Capability in CSV format exportable to excel, .5C absolute accuracy. Used to log 14 individual temperature sensors and one fan RPM sensor to log results at 1 second intervals. Here is a small data example of what just one run looks like which is logged in the below chart, thankfully the CrystalFontz does most of the work for me.
- Thermal Sensors - Dallas DS18B20 Digital one-wire sensors. .5C absolute accuracy overall with a .2C mean error between 20-30C.
- Test Bench Sensors Deployed -
- 8 each air inlet sensors, two for each 120mm fan section
- 4 each air outlet sensors, 1 for each 120mm fan section
- 1 water inlet sensor
- 1 water outlet sensor

- Custom Test Bench - Custom built 120mm x 4 radiator test bench with permanently mounted sensors to improve consistency and minimize setup time.
- Flow rate - King Instruments 7520 Series 0-5GPM, 250mm scale - Accuracy 2% of Full Scale. Flow rate is controlled via 3/4" brass gate valve to precisely 1.5GPM. Flow rate effects are generally minimal in radiators so I have selected 1.5GPM as a good average flow rate point.
- Water - I used regular filtered tap water for testing purposes.
- Warm-up - Each fan configuration is allowed to reach temperature for 30 minutes prior to recording and logging of temperatures.
- Fans:
- Logging of Temperatures - Each temperature sensor and fan rpm channel is logged for 30 minutes to both average out any temperature fluctuations and also to ensure the system has stabilized and heat loads/fan RPMs remained constant during the testing period. If temperatures did not fluctuate or an error occurred, the test was thrown out. Over a 30 minute period data for all 14 temperature sensors and fan header are recorded every second producing a data matrix of 1,800 entries over each channel.
- Air Inlet Temperature Data - Each test averages the 8 inlet channels (6 in the case of a triple radiator), and then average over the testing period of 1,800 results. So Air In can be the average of up to 8 x 1800 = 14,400 data points collected.
- Water Outlet Temperature Data - Water outlet data is also captured by the same Dallas sensor with an average of 1,800 data points collected.

- Fan RPM - Also recorded and monitored with the Crystalfontz. Fan RPM is
carefully adjusted using a Sunbean fan speed controller to be the following:
- 12V Full Speed - Each fan is first adjusted to 12.00V +- .05V for the full speed test runs
- RPM - Subsequent fan scenarios are voltage adjusted to match RPMs as specified with 10RPM.
Thermal Testing
So, after 10 individual 30minute warm ups and 30minutes sessions of logging temperatures across those sensors, I've been able to extract and plot the following results for each set of fans and heat load.
As expected the large size has this radiator producing leading results particularly in the slow, medium, high, and ultra high fan scenarios.
- Extreme Outer Visions PSU calculator - Just note heat load minus the 38 watts included in the start.
- Swiftech's Conroe/Kentsfield CPU calculator - This is actual an estimator for the kit, but it also gives what I think is a more accurate heat load for the processor. Just plug in the field and it will output a heat load in watts.
Now you can take your heat load in watts and follow it up vertically to the fan scenario. When you cross that line, turn left and follow it horizontally until it impacts the vertical axis on the left. This temperature delta will be your number that you need. To estimate your water temperature simply add this number to the ambient.
So what does this mean? You are cooling with the water that leaves your radiator and enters your CPU block. So any improvement in this number will directly translate into an improvement in your CPU temperature. For example if your water temperature delta is 10C and your loaded core temperature was 50C. If you improved your water delta by 5C either by adding another radiator or increase your fan performance, your new core temperature will be 45C assuming your ambient temperature remained the same.
I would recommend if starting out that you shoot for a 5C delta for extreme performance, even though it's common practice for radiator manufacturers to list 10C delta curves...I believe 5C is a better target for extreme performance. A few years ago a 10C delta was still a very good gain over air cooling, now I think it's better to shoot for 5C to really make the most out of water cooling's advantage. After all, the real benefit is having the ability to dissipate heat from an unconfined space. Air coolers will always be limited to the space around and above the CPU socket. The size of the radiator or series of radiators is only limited by the user's personal preference...go big if you want big performance and include several radiators in the same loop, nothing wrong with more heat dissipation especially if you have a heat load that needs it. My suggestion is to target a 5C delta for extreme performance or a 10C delta for average performance.
Water Temperature Estimator File
If you want an actual water temperature but the charts above hurt your eyes, I've plugged the generated c/w values into this small and quick excel file you can download for educational purposes only. You enter your ambient temperature and estimated heat load, and it will output an estimated water temperature.480GTXEstimator.xls
Excel 97 or newer needed to use.
How does it compare to the PA120.3
Some people might say it's not fair comparing a triple radiator to a quad radiator, and that's fine and has some merit. If you can only fit a triple radiator then that's what you have. However you might also have a set amount of $$ budgeted for either one and just want to know which one will net better temperatures. Bottom line, I only have these two tested at this point so it's all I have to compare with. Unfortunately the PA series ends at the 120.3 size, so I think it's ok as long as you understand the triple vs quad size differences.First there are the hydraulic restriction considerations I've noted above. The HWlabs 480GTX does happen to be quite a bit more restrictive than a PA120.3. It's not so much that the 480GTX is extremely restrictive compared to water blocks, it's not, it's about medium in restriction. However the PA120.3 is extremely LOW in restriction and has very minimal impact on flow rates even with multiple radiators connected in series. Overall however with a strong pump such as the D5 or DDC series, you'll likely have well over 1GPM in most situations and the resulting difference in flow rates will likely have very little impact on block performances. I would simply recommend checking your flow rate to ensure you have 1GPM or better with the flow rate estimator.
Now for fan comparison... Using the linear trend-lines I created in the above testing, I've been able to extract a linear c/w value for each fan scenario. What I found particularly useful in comparing fan performance is plotting the RPM of the fans relative to the c/w values generated. Even though we have two different fans used in the testing, it still provide a good general c/w vs fan performance look at how they compare. Most folks have a good idea of the fan RPM so I thought it was a good way to look at it.

At 1120RPM (Between the Ultra Low and Low Speed) both radiators perform roughly the same. Above that the 480GTX dissipates more heat, below that the PA120.3 dissipates more heat.
Obviously the 480GTX has a size advantage here(4 fans vs 3 fans), and it is producing better thermal results for most of the fan scenarios. The PA120. 3 does however flex it's muscles in the ultra slow speed category where it actually outperforms the bigger quad even with one fan less. With that said, it's still far from saying the 480GTX is only good with high speed noisy fans. Yate Loon rates it's D12SL12 as a "slow speed" as designated by the "SL". This slow speed fan runs at 1350 RPM +- 10%. If you compare the two radiators and select one lower fan selection for the 480, you can almost get an equal performance. For example the 480GTX running slow speed yate loons at 1350RPM can dissipate about as much as the PA120.3 with medium speed fans. While you do have one more fan making more noise, that's a notable benefit especially if you compare 3000RPM compared to 2000 RPM Ultra Kazes. The 480GTX is obviously optimized with it's higher fin density to make the most out of stronger fans, however the larger size (quad vs. triple) allows it to continue it's lead clear down to the 1120 RPM mark where they are equal.
The last point I wanted to make with this is a normal review could have only tested one fan type. Had they tested at 1000RPM only, they would have said the PA is better and could have misled you into thinking that's consistent with all fans or for everything but high speed fans. This is where the "Scientific" method helps sort out the trend and give you the full picture. We really have two winners here, each in their own respective areas. More so I hope I can provide you with something you can use to design your system and help you see the substantial influence fan selection has. Obviously this again compares a quad sized rad to a triple which many feel is not right, but I think that depends on your space circumstances. If you can fit a quad sized radiator and have enough budget to afford either of the above two radiators, I belive the comparison is very useful and presents the bottom line well. If however you have only enough space for a triple sized radiator, you can't expect the same performance as the top of the line 480GTX. It should be approximately 25% lower although testing would be needed to really sort out that difference.
More importantly, I can't stress enough how important fan selection plays a role here. For the 480GTX you get nearly 5X the performance using the high speed Ultra Kaze 38mm fans at 3000RPM than you do with the yate loons at 1000RPM. Fan selection is EXTREMELY INFLUENTIAL on performance.
How does it compare to the PA120.3 with some estimated heat loads
Ok, so c/w ratios are fine, but what does that mean in terms of degrees difference you might ask. To estimate that, I've selected several random heat load scenarios that might paint that picture a little better. Here they are:
CPU and GPU loops - This is where fan selection becomes more critical and also where the larger size of the 480GTX really starts to show it's strength. In a quad core and SLI setup, I would probably recommend the 480GTX with a 2000RPM 38mm fan similar to the Ultra Kazes, that would afford you about a 6 degree delta which is very good. That's simply too much heat to use a slow speed fan on either radiator.
Ok enough with that, what I wanted to really point out is not so much the differences between the PA120.3 and 480GTX, but that heat load and fan selection again are very very important. With really small heatloads like a CPU only type of setup, you're really not going to see much of any difference between the rads or between the fans selected. This is where "Silence is bliss" you can have extreme performance water temperatures without extreme noise levels, for those that want both...you need ALOT of radiator and either one will do just fine with slow speed fans even on a really hot quad core keeping water in the 5C extreme performance mark or close to it. Second I wanted to show how fan selection becomes extremely important as the heat loads rise. Even though the PA120.3 is optimized for ultra slow speed fans, putting a 570watt heat load on it with only 1000RPM fans isn't going to perform acceptably well, you will need to consider stringing several PA120.3's together with that amount of heat, OR use stronger fans...the option is yours.
If you are trying to understand how the 360GTX compares to the PA120.3, please don't use the above comparison as a reference. You will still see each radiator more optimized each area, but the crossover point will be different and obviously higher with the smaller radiator size.
So the amount of heat and the fans used are BOTH critical to your decision around the radiator component. Small heat loads are easy, high heat loads need strong fans or multiple radiators. I would suggest for extreme performances that you shoot for a 5C delta, the lower the better.
Price Considerations
If you're in the market for the best single radiator, chances are you're looking into the >$100 market. Currently I can compare prices at Danger Den as they carry both the PA120.3 and the 480GTX and both are currently nearly the same price. This is why I don't feel too bad about comparing the triple PA to the quad GTX, they are very close in price (Don't forget to factor in your fans though).Prices as of 4-6-2008 (subject to change)
- Danger Den HW Labs 480 GTX Link - $136.95
- Danger Den HW Labs 360 GTX Link -$112.95
- Danger Den Thermochill PA 120.3 Link - $134.99
Pros
- KING OF HEAT DISSIPATION!, capable of dissipating over 800 watts with 3000RPM fans at a high performance 5C water/air delta, that is some heat!!
- The most thermally efficient single radiator tested to date on Slow, Medium, High, & Ultra High speed fans.
- High Quality Paint gloss finish
- Quality construction - Extremely high attention to detail and the highest quality present in finishing.
- Standard G1/4 threading - I would recommend Danger Den's FatBoy Barbs (My favorites and used for all testing)
- Non-Louvered fin design will not trap dust internally as much
- Low cost compared to the competition
Cons
- Size may be challenging to fit internally on many cases without significant effort. (Time to break out the dremel!)
- Thickness, double radiator thickness may also cause installation difficulties.
- High hydraulic restriction (pressure drop) reduces system flow rate slightly. (Check to ensure 1GPM is maintained)
- High fin density may require more dust cleaning maintenance (although fins are not louvered, so better internally)
- Not the most thermally efficient single radiator for Ultra Low Speed fans less than 1120RPM
Bottom Line
This is an amazing radiator, the beauty of the construction and massive size is really breathtaking when you first open the box. While it is a bit more restrictive hydraulically, I think most people will still maintain well over 1GPM considering it's similar in restriction to an average CPU block. The thermal performance is amazing, it moves and dissipates heat like no other radiator tested to date, and even though it's really prime with higher speed/pressure fans it still does extremely well down to slow speed fans as well with it's large 120mm X 4 SIZE. The 480GTX is an amazing and massive radiator!!Where to buy
Danger Den's HWLabs 480GTX link