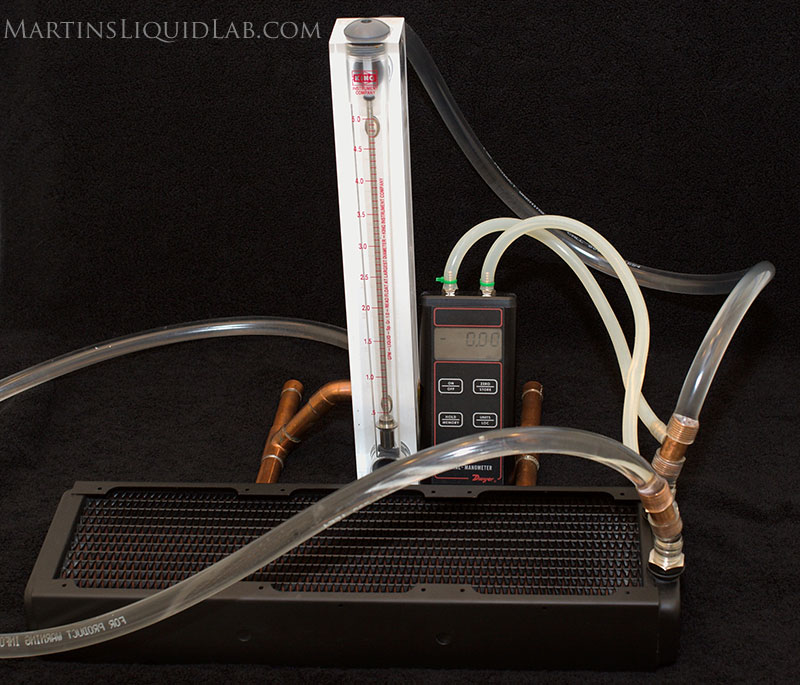

Thermochill PA 120.3 Radiator Pressure Drop Flow Testing
Introduction
Welcome to my pressure drop testing of the Thermochill PA 120.3 radiator. I would like to give special thanks to Jeremy, Dennis, and Debbie from Danger Den for loaning me this radiator for a quick flow rate pressure drop test. These thermochill radiators have been very popular amongst the extreme forum members and it was nice to finally check one out for myself.
With this review I will focus on the pressure drop and flow characteristics for this radiator first.
Radiator Characteristics
The radiator is a very thick and open finned in designed to be optimized for low speed fans. Here are some characteristics I noted:- Dual Row Tubes, Dual pass flow
- Water Channels and Fins made out of Brass
- Copper Louvered Fins
- Brass Water Chambers
- G3/8" Threads
- Bleed Valve Screw
- 16-7/8" x 5" x 2-3/8" or 429mm x 127mm x 60mm
(L x W x H) - I measure approximately 10-11 folds per inch.
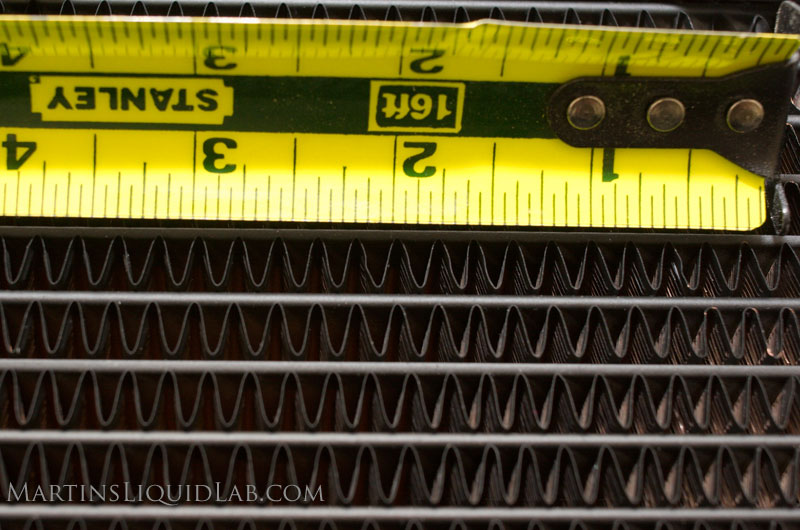
Some interesting pictures of thermochill's producition line is available on their site here. As you can see there is quite a bit of hand fabrication involved in radiator construction.
Hydraulics and Pressure Drop Testing
The most scientific way to determine a blocks hydraulic resistance is to test pressure drop. Pressure drop is a measurement of pressure loss across a radiator that varies with flow rate. This is basically a measurement of energy loss, and directly influences how much flow rate you will have.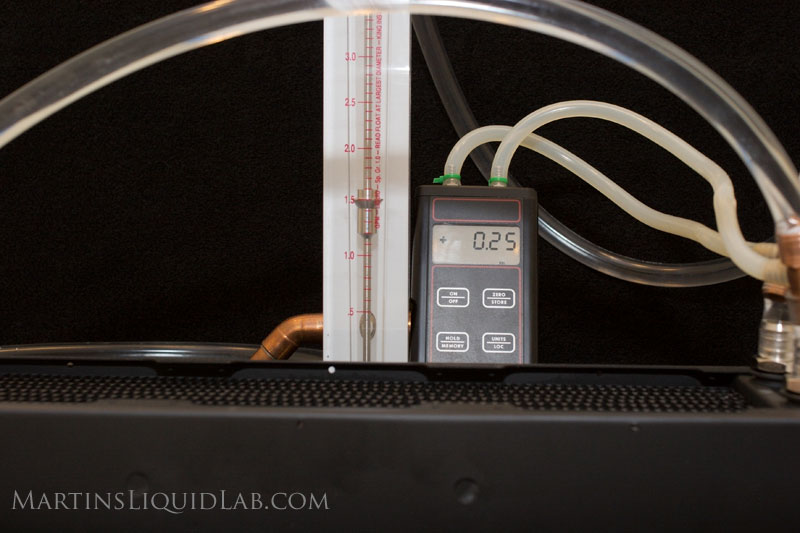
Equipment:
- Dwyer Digital Manometer 477 Mark V - Accuracy .5% of Full Scale. Range 0-20.00 PSI range, Resolution .01 PSI
- King Instruments 7520 Series 0-5GPM, 250mm scale - Accuracy 2% of Full Scale. Range 0-5GPM, Resolution .1 GPM (can be interpolated to .02GPM)
- Water Source - Household water pressure - 50PSI at >5GPM - Because flow
rate readings are instantaneous, household tap water and water pressure are a
good and powerful source for pressure drop testing.
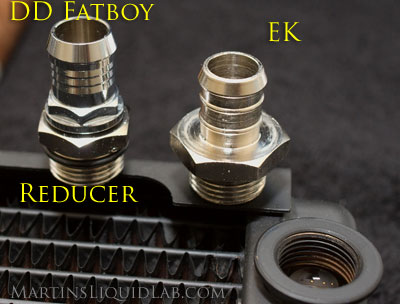
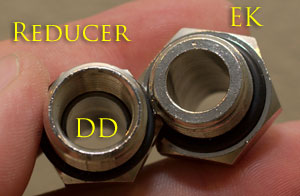 I tested with two different barb styles because of the G3/8" fitting.
 First was using some EK G3/8" barbs that watercoolingshop.com provided me. The EK barbs are very nicely constructed with a straight through 10.1mm ID. They also offer a very nicely seated o-ring that will prevent the o-ring from displacing when tightening.
The second barb tested setup included these G3/8 to G1/4 reducers and standard G1/4 Danger Den Fat Boy barbs. The reducers have about an 11.8mm ID with chamfered ends, but they don't offer the same o-ring retained groove that the EK barbs or the Danger Den barbs do. The Danger Den FatBoy barbs are my favorite amongst all the options available for G1/4 threading. They have an oversized 11.0mm ID at the barb end, tapering down to 10.0mm at the threaded end, nice sharp barbs for holding onto tubing, chrome finish, and that nicely retained o-ring groove.
The plastic barbs I did not test,
but I suspect they were used in Thermochill's published results.
I would recommend using whatever barbs suit your needs best.
You could also likely reduce some restriction by chamferring the
barbs yourselves.
First up is the EK barb test:
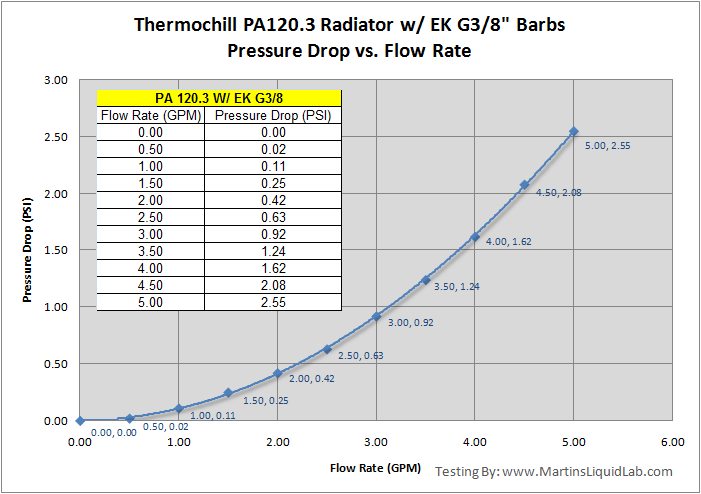
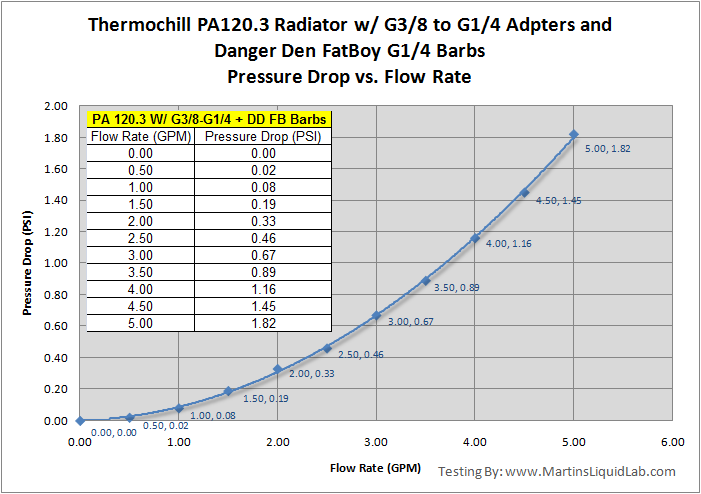
So the adapters and Danger Den Fatboy barbs actually perform a little better.
This is the lowest pressure drop I
have recorded on any radiator. A big part of the advantage is the
fact that these radiators are actually about double the width of a
normal radiator, so rather than having 6 tubes to flow water down and 6
back up, you have double that amount. In the
end, that means maximum flow rates for your water blocks and alot of
flexibility in additional radiators or smaller more efficient pumping
systems because this radiator will have very little impact on your flow
rate.
The Thermochill radiators have extremely low pressure drop, fantastic!
Most of the radiator thermal reviews I have read have typically been a simple comparison of two radiators on a system with one heat load and one set of fans. While a good comparison, this doesn't provide you with any data you can use other than a relative comparison. In addition that comparison usually can't tell you the quantity of heat load so understand the scale of difference is hard to know. Also that particular system test compares the radiators on one set of fans at one speed setting, this doesn't tell you how the radiator performs with different types of fans. One thing I've noticed looking over the array of radiators available, many are specifically designed for one type of fan or another. More open finned types generally don't require high pressure and high speed to allow air to pass by, and more dense finned types are more restrictive requiring greater pressure to move the same amount of air through them. Also any sort of testing that is also capturing air temperature is very challenging to avoid error because of the huge swings in air temperature within a room and location. It's not uncommon to see several degree of temperature difference within a foot apart or easily one degree change in ambient over a half an hour. So it's also very important to capture a lot of data from multiple sensors including water and air to minimize those errors. I also really wanted to capture something scientific that will allow me to create some tools to estimate things. For me, comparisons come second to good scientific data you can use to help you design your system, so I focused in on capturing c/w relationships. With that I decided on a rather extensive approach to constructing a radiator testing bench to accurately measure 14 different points on the radiator. In addition I needed to have the ability to both vary and measure the actual heat load applied. I quickly realized a processor or computer product was not going to provide that heat source that's both measurable and easy to adjust, so I landed on an external heater. More specifically I decided I would try using several aquarium water heaters because I could fit several in my large testing reservoir and they are also simple devices I could measure power consumption with. The heaters themselves are very simple on/off type devices with thermostats and I quickly learned I had to take apart and remove those thermostats, but after that they were great. Initially I thought there would be a real need to adjust the heat load variable, so I aquired an A/C variable power supply which does a fine job at that. And finally to make easy measurement of the applied heat load I used a "Kill-a-watt" which reads voltage/amperage/ or "Watts" direct. After figuring out the relationship to heat was linear, I really didn't need the variac. I also attempted to measure c/w differences relative to flow rate, but quickly realized the pump heat added from high flow rates was offsetting the gains in thermal efficiency. Effects of flow rate are very very small and so I decided to stay with an average 1.5GPM I held flow rate at 1.5GPM by using a gate valve and monitoring my King Instruments flow meter and from my previous testing, pump heat dump would be approximatly 15 watts so I added that heat to the heater heat for each test.
With all of this I was able to put one set of fans on at a set speed, then apply a know heat value, and let it rip! The CrystalFontz was then furiously gathering data from my array of sensors, and after processing that data I aquired a good (water out - air in) delta for the known heat load and fans. I then did this again for different heat values, typically around 300 watts and then 600 watts for each fan setup. Then I'm able to plot a linear trendline between 0 through those data point to further average results and tighten things up as well as check. That trend-line represents C/W (Degrees Celcius per Watt) for that particular fan, which is very useful in estimating the water temperature. I did this same thing over several different fan types/setups and voltages to try and capture the spectrum of possible fans that could be used on the radiator. This will later come in handy in comparing how one radiator performs relative to others with different fans.
Radiator Testing Specifications:

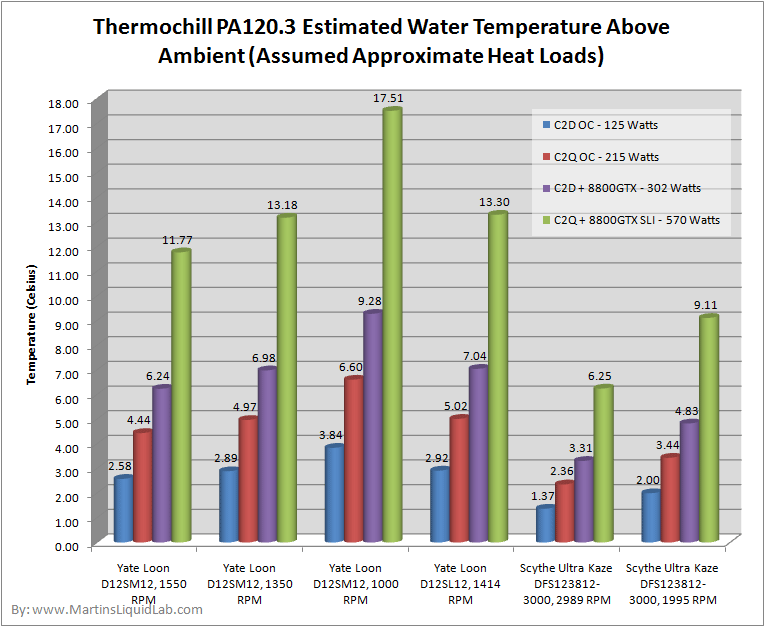
I've also created this quick simulation to give you an example of those
values created above in more of a bar type chart. I chose a
couple of assumed heat load systems so you can see how the radiator
will perform with water delta numbers depending on the fan selected.
As expected the higher speed fans do have a significant up to 3X
the performance difference between fans used in this test.
Generally the higher the RPM and higher the pressure (38mm vs
25mm), the better the performance. The decision comes down to
noise preferences more than anything. While the Scythe Ultra Kaze
at 3000RPMs performs the best, that's more noise than I would want to
put up with daily, and tolerance to noise is different for every person.
For educational purposes only, download excel 97 file in compressed .zip format here.
Thermal Testing Specifications
Welcome to my thermal testing of this radiator, but first I would like to give special thanks to Linus from NCIX.com for providing me with two sets of fans for testing. I selected to include both the Yate Loon D12SL12 slow speed 47cfm 120x25mm fans, as well as this Scythe Ultra Kaze DFS123812-3000 high speed 136cfm 120x38mm fans. Both present great value and a strong variety of cfm coverage for different setups.Most of the radiator thermal reviews I have read have typically been a simple comparison of two radiators on a system with one heat load and one set of fans. While a good comparison, this doesn't provide you with any data you can use other than a relative comparison. In addition that comparison usually can't tell you the quantity of heat load so understand the scale of difference is hard to know. Also that particular system test compares the radiators on one set of fans at one speed setting, this doesn't tell you how the radiator performs with different types of fans. One thing I've noticed looking over the array of radiators available, many are specifically designed for one type of fan or another. More open finned types generally don't require high pressure and high speed to allow air to pass by, and more dense finned types are more restrictive requiring greater pressure to move the same amount of air through them. Also any sort of testing that is also capturing air temperature is very challenging to avoid error because of the huge swings in air temperature within a room and location. It's not uncommon to see several degree of temperature difference within a foot apart or easily one degree change in ambient over a half an hour. So it's also very important to capture a lot of data from multiple sensors including water and air to minimize those errors. I also really wanted to capture something scientific that will allow me to create some tools to estimate things. For me, comparisons come second to good scientific data you can use to help you design your system, so I focused in on capturing c/w relationships. With that I decided on a rather extensive approach to constructing a radiator testing bench to accurately measure 14 different points on the radiator. In addition I needed to have the ability to both vary and measure the actual heat load applied. I quickly realized a processor or computer product was not going to provide that heat source that's both measurable and easy to adjust, so I landed on an external heater. More specifically I decided I would try using several aquarium water heaters because I could fit several in my large testing reservoir and they are also simple devices I could measure power consumption with. The heaters themselves are very simple on/off type devices with thermostats and I quickly learned I had to take apart and remove those thermostats, but after that they were great. Initially I thought there would be a real need to adjust the heat load variable, so I aquired an A/C variable power supply which does a fine job at that. And finally to make easy measurement of the applied heat load I used a "Kill-a-watt" which reads voltage/amperage/ or "Watts" direct. After figuring out the relationship to heat was linear, I really didn't need the variac. I also attempted to measure c/w differences relative to flow rate, but quickly realized the pump heat added from high flow rates was offsetting the gains in thermal efficiency. Effects of flow rate are very very small and so I decided to stay with an average 1.5GPM I held flow rate at 1.5GPM by using a gate valve and monitoring my King Instruments flow meter and from my previous testing, pump heat dump would be approximatly 15 watts so I added that heat to the heater heat for each test.
With all of this I was able to put one set of fans on at a set speed, then apply a know heat value, and let it rip! The CrystalFontz was then furiously gathering data from my array of sensors, and after processing that data I aquired a good (water out - air in) delta for the known heat load and fans. I then did this again for different heat values, typically around 300 watts and then 600 watts for each fan setup. Then I'm able to plot a linear trendline between 0 through those data point to further average results and tighten things up as well as check. That trend-line represents C/W (Degrees Celcius per Watt) for that particular fan, which is very useful in estimating the water temperature. I did this same thing over several different fan types/setups and voltages to try and capture the spectrum of possible fans that could be used on the radiator. This will later come in handy in comparing how one radiator performs relative to others with different fans.
Radiator Testing Specifications:
- Thermal Temperature and Fan RPM Monitoring - CrystalFontz CFA-633 32 Channels of temperature, 4 channels of fan RPM, Logging Capability in CSV format exportable to excel, .5C absolute accuracy. Used to log 14 individual temperature sensors and one fan RPM sensor to log results at 1 second intervals. Here is a small data example of what just one run looks like which is logged in the below chart, thankfully the CrystalFontz does most of the work for me.
- Thermal Sensors - Dallas DS18B20 Digital one-wire sensors. .5C absolute accuracy overall with a .2C mean error between 20-30C.
- Test Bench Sensors Deployed -
- 8 each air inlet sensors, two for each 120mm fan section
- 4 each air outlet sensors, 1 for each 120mm fan section
- 1 water inlet sensor
- 1 water outlet sensor
- Custom Test Bench - Custom built 120mm x 4 radiator test bench with permanently mounted sensors to improve consistency and minimize setup time.
- Flow rate - King Instruments 7520 Series 0-5GPM, 250mm scale - Accuracy 2% of Full Scale. Flow rate is controlled via 3/4" brass gate valve to precisely 1.5GPM. Flow rate effects are generally minimal in radiators so I have selected 1.5GPM as a good average flow rate point.
- Water - I used regular filtered tap water for testing purposes.
- Warm-up - Each fan configuration is allowed to reach temperature for 30 minutes prior to recording and logging of temperatures.
- Fans:
- Logging of Temperatures - Each temperature sensor and fan rpm channel is logged for 30 minutes to both average out any temperature fluctuations and also to ensure the system has stabilized and heat loads/fan RPMs remained constant during the testing period. If temperatures did not fluctuate or an error occurred, the test was thrown out. Over a 30 minute period data for all 14 temperature sensors and fan header are recorded every second producing a data matrix of 1,800 entries over each channel.
- Air Inlet Temperature Data - Each test averages the 8 inlet channels (6 in the case of a triple radiator), and then average over the testing period of 1,800 results. So Air In can be the average of up to 8 x 1800 = 14,400 data points collected.
- Water Outlet Temperature Data - Water outlet data is also captured by the same Dallas sensor with an average of 1,800 data points collected.
Typical Test Logging for Each Fan Scenario and Heat Load

- Fan RPM - Also recorded and monitored with the Crystalfontz. Fan RPM is carefully adjusted using a Sunbean fan speed controller to be the following:
- 12V Full Speed - Each fan is first adjusted to 12.00V +- .05V for the full speed test runs
- RPM - Subsequent fan scenarios are voltage adjusted to match RPMs as specified with 10RPM.
Thermal Testing Results
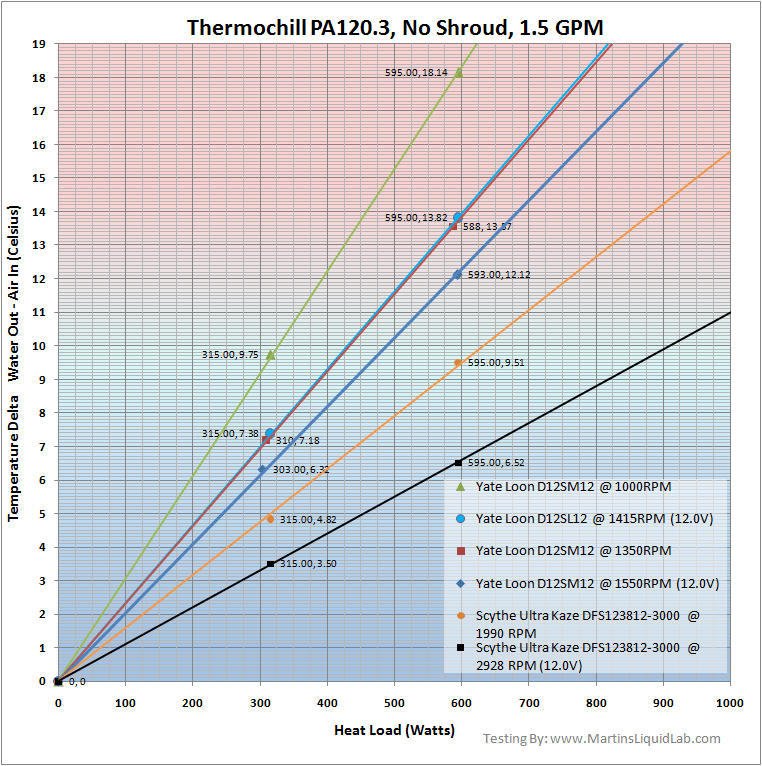
The Thermochill PA 120.3 has exceptional thermal properties, the following results were obtained. Many review sites simply measure one radiator to another, but since I focus my efforts on the science side, I chose to capture water/ambient delta from the data collected. This allows anyone to look at the chart and estimate a water temperature by selecting a heat load on the bottom axis, following the grid lines up to the selected fan scenario line, and then carrying that over horizontally to the left to see the estimate water/air delta:Water Temperature (Celsius) = Air Inlet Temperature (Celsius) + Water/Air Delta (Celsius)

To use the above chart start at
the bottom where the heat load axis resides. Select your heat
load and move up the grid until you intersect your fan selection.
Then move to the left horizontally until you intersect the
temperature delta axis on the left. Now take this value and add
it to your ambient temperature and you have your water temperature.
I hope the chart is usefull to use and I also hope it helps
clarify some misconceptions. Many folks think of radiators as a
set capacity (A 1000 watt radiator), etc, but this is not quite
correct. Some manufacturers post 10C delta heat dissipated curves
relative to flow rate, but I think it's confusing for most people and
they often think if they can dissipate 500 watts that adding another
block as long as they are less than their 500 watts won't do anything,
but it does. You could actuall dissipate 1000 watts with a 80mm
radiator if you wanted to, it would be an extremely high water
temperature, but eventually it could do it. I think looking at
this with the above graph should help shed that "How many watt
radiator" discussion, because the number of watts without know the
water temperature is undefined. My second goal to this chart
format is to explain emphasis in fan importance. As you can see,
the same radiator can have almost 3X the performance simply by putting
a different fan on it. Now if there wasn't that little "Noise"
issue blaring....that's up to you.

Thermal Water Temperature Estimator
The below link will open up ia very basic Excel file that will allow you to experiment with different heat load values and it looks like the image below.For educational purposes only, download excel 97 file in compressed .zip format here.
While this is the first of my thermal testing, the PA120.3 has a long history of very strong performance. Simply based on the fin density and double the normal radiator thickness as well as the longer than average length (greater than 120mm fan spacing), this radiator is a strong performer.
From the thermal results, it appears the radiator scales very well all the way down to 1000RPM ultra silent fans, and still continues to gain very well even through much more powerful fans. This is a very well designed radiator and I look forward to using these results in future comparisons. I expect it to continue to be an exceptional radiator specifically designed and optimized for medium to low speed fans.
Where to buy
Thermochill PA 120.3 @ Danger DenYate Loon or Scythe Ultra Kaze Fans at NCIX


