The Meltdown and Spectre vulnerabilities have been making many headlines lately. So far, security researchers have identified three variants. Variant 1 (CVE-2017-5753) and Variant 2 (CVE-2017-5715) are Spectre, while Variant 3 (CVE-2017-5754) is Meltdown. According to their security bulletin, NVIDIA has no reason to believe that their display driver is affected by Variant 3. In order to strengthen security against Variant 1 and 2, the company released their GeForce 390.65 driver earlier today, so NVIDIA graphics card owners can sleep better at night.
Experience tells us that some software patches come with performance hits, whether we like it or not. We were more than eager to find out if this was the case with NVIDIA's latest GeForce 390.65 driver. Therefore, we took to the task of benchmarking this revision against the previous GeForce 388.71 driver in 21 different games at the 1080p, 1440p, and 4K resolutions. We even threw in an Ethereum mining test for good measure. Our test system is powered by an Intel Core i7-8700K processor overclocked to 4.8 GHz, paired with G.Skill Trident-Z 3866 MHz 16 GB memory on an ASUS Maximus X Hero motherboard. We're running the latest BIOS, which includes fixes for Spectre, and Windows 10 64-bit with Fall Creators Update, fully updated, which includes the KB4056891 Meltdown Fix.

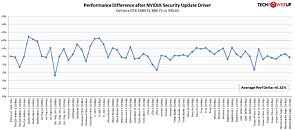
We grouped all 21 games, each at three resolutions, into a single chart. Each entry on the X axis is for a single test, showing the percentage difference between old and new driver in percent. Negative values stand for a performance decrease when using today's driver. Positive numbers for performance gained.
Cryptominers can rest assured that the new GeForce 390.65 driver won't affect their profits negatively. Our testing shows zero impact in Ethereum mining. With regard to gaming, there is no significant difference in performance either. The new driver actually gains a little bit of performance on average over the previous version (+0.32%). The results hint at some undocumented small performance gains in Wolfenstein 2 and F1 2017; the other games are nearly unchanged. Even if we exclude those two titles, the performance difference is still +0.1%. The variations that you see in the chart above are due to random effects and due to limited precision on taking measurements in Windows. Generally, for the kind of testing done in our VGA reviews we typically expect 1-2% margin of error between benchmark runs, even when using the same game, at identical settings, on the same hardware.
View at TechPowerUp Main Site
Experience tells us that some software patches come with performance hits, whether we like it or not. We were more than eager to find out if this was the case with NVIDIA's latest GeForce 390.65 driver. Therefore, we took to the task of benchmarking this revision against the previous GeForce 388.71 driver in 21 different games at the 1080p, 1440p, and 4K resolutions. We even threw in an Ethereum mining test for good measure. Our test system is powered by an Intel Core i7-8700K processor overclocked to 4.8 GHz, paired with G.Skill Trident-Z 3866 MHz 16 GB memory on an ASUS Maximus X Hero motherboard. We're running the latest BIOS, which includes fixes for Spectre, and Windows 10 64-bit with Fall Creators Update, fully updated, which includes the KB4056891 Meltdown Fix.

We grouped all 21 games, each at three resolutions, into a single chart. Each entry on the X axis is for a single test, showing the percentage difference between old and new driver in percent. Negative values stand for a performance decrease when using today's driver. Positive numbers for performance gained.
Cryptominers can rest assured that the new GeForce 390.65 driver won't affect their profits negatively. Our testing shows zero impact in Ethereum mining. With regard to gaming, there is no significant difference in performance either. The new driver actually gains a little bit of performance on average over the previous version (+0.32%). The results hint at some undocumented small performance gains in Wolfenstein 2 and F1 2017; the other games are nearly unchanged. Even if we exclude those two titles, the performance difference is still +0.1%. The variations that you see in the chart above are due to random effects and due to limited precision on taking measurements in Windows. Generally, for the kind of testing done in our VGA reviews we typically expect 1-2% margin of error between benchmark runs, even when using the same game, at identical settings, on the same hardware.
View at TechPowerUp Main Site


