- Joined
- Aug 16, 2005
- Messages
- 27,927 (3.84/day)
- Location
- Alabama
| System Name | RogueOne |
|---|---|
| Processor | Xeon W9-3495x |
| Motherboard | ASUS w790E Sage SE |
| Cooling | SilverStone XE360-4677 |
| Memory | 128gb Gskill Zeta R5 DDR5 RDIMMs |
| Video Card(s) | MSI SUPRIM Liquid 5090 |
| Storage | 1x 2TB WD SN850X | 2x 8TB GAMMIX S70 |
| Display(s) | 49" Philips Evnia OLED (49M2C8900) |
| Case | Thermaltake Core P3 Pro Snow |
| Audio Device(s) | Moondrop S8's on Schitt Gunnr |
| Power Supply | Seasonic Prime TX-1600 |
| Mouse | Razer Viper mini signature edition (mercury white) |
| Keyboard | Wooting 80 HE White, Gateron Jades |
| VR HMD | Quest 3 |
| Software | Windows 11 Pro Workstation |
| Benchmark Scores | I dont have time for that. |
Hello everyone! Pretty boring sunday, so after I was done recording the video I decided a written guide might be a good idea. So today, I am going to show you how to setup a TIG stack. As always,
I do NOT
Represent any specific company
Stand by any specific product
or
Represent Techpowerup as staff or otherwise
in any official capacity when I post guides. I am doing this because I'm a nerd that thinks you may benefit from the information.
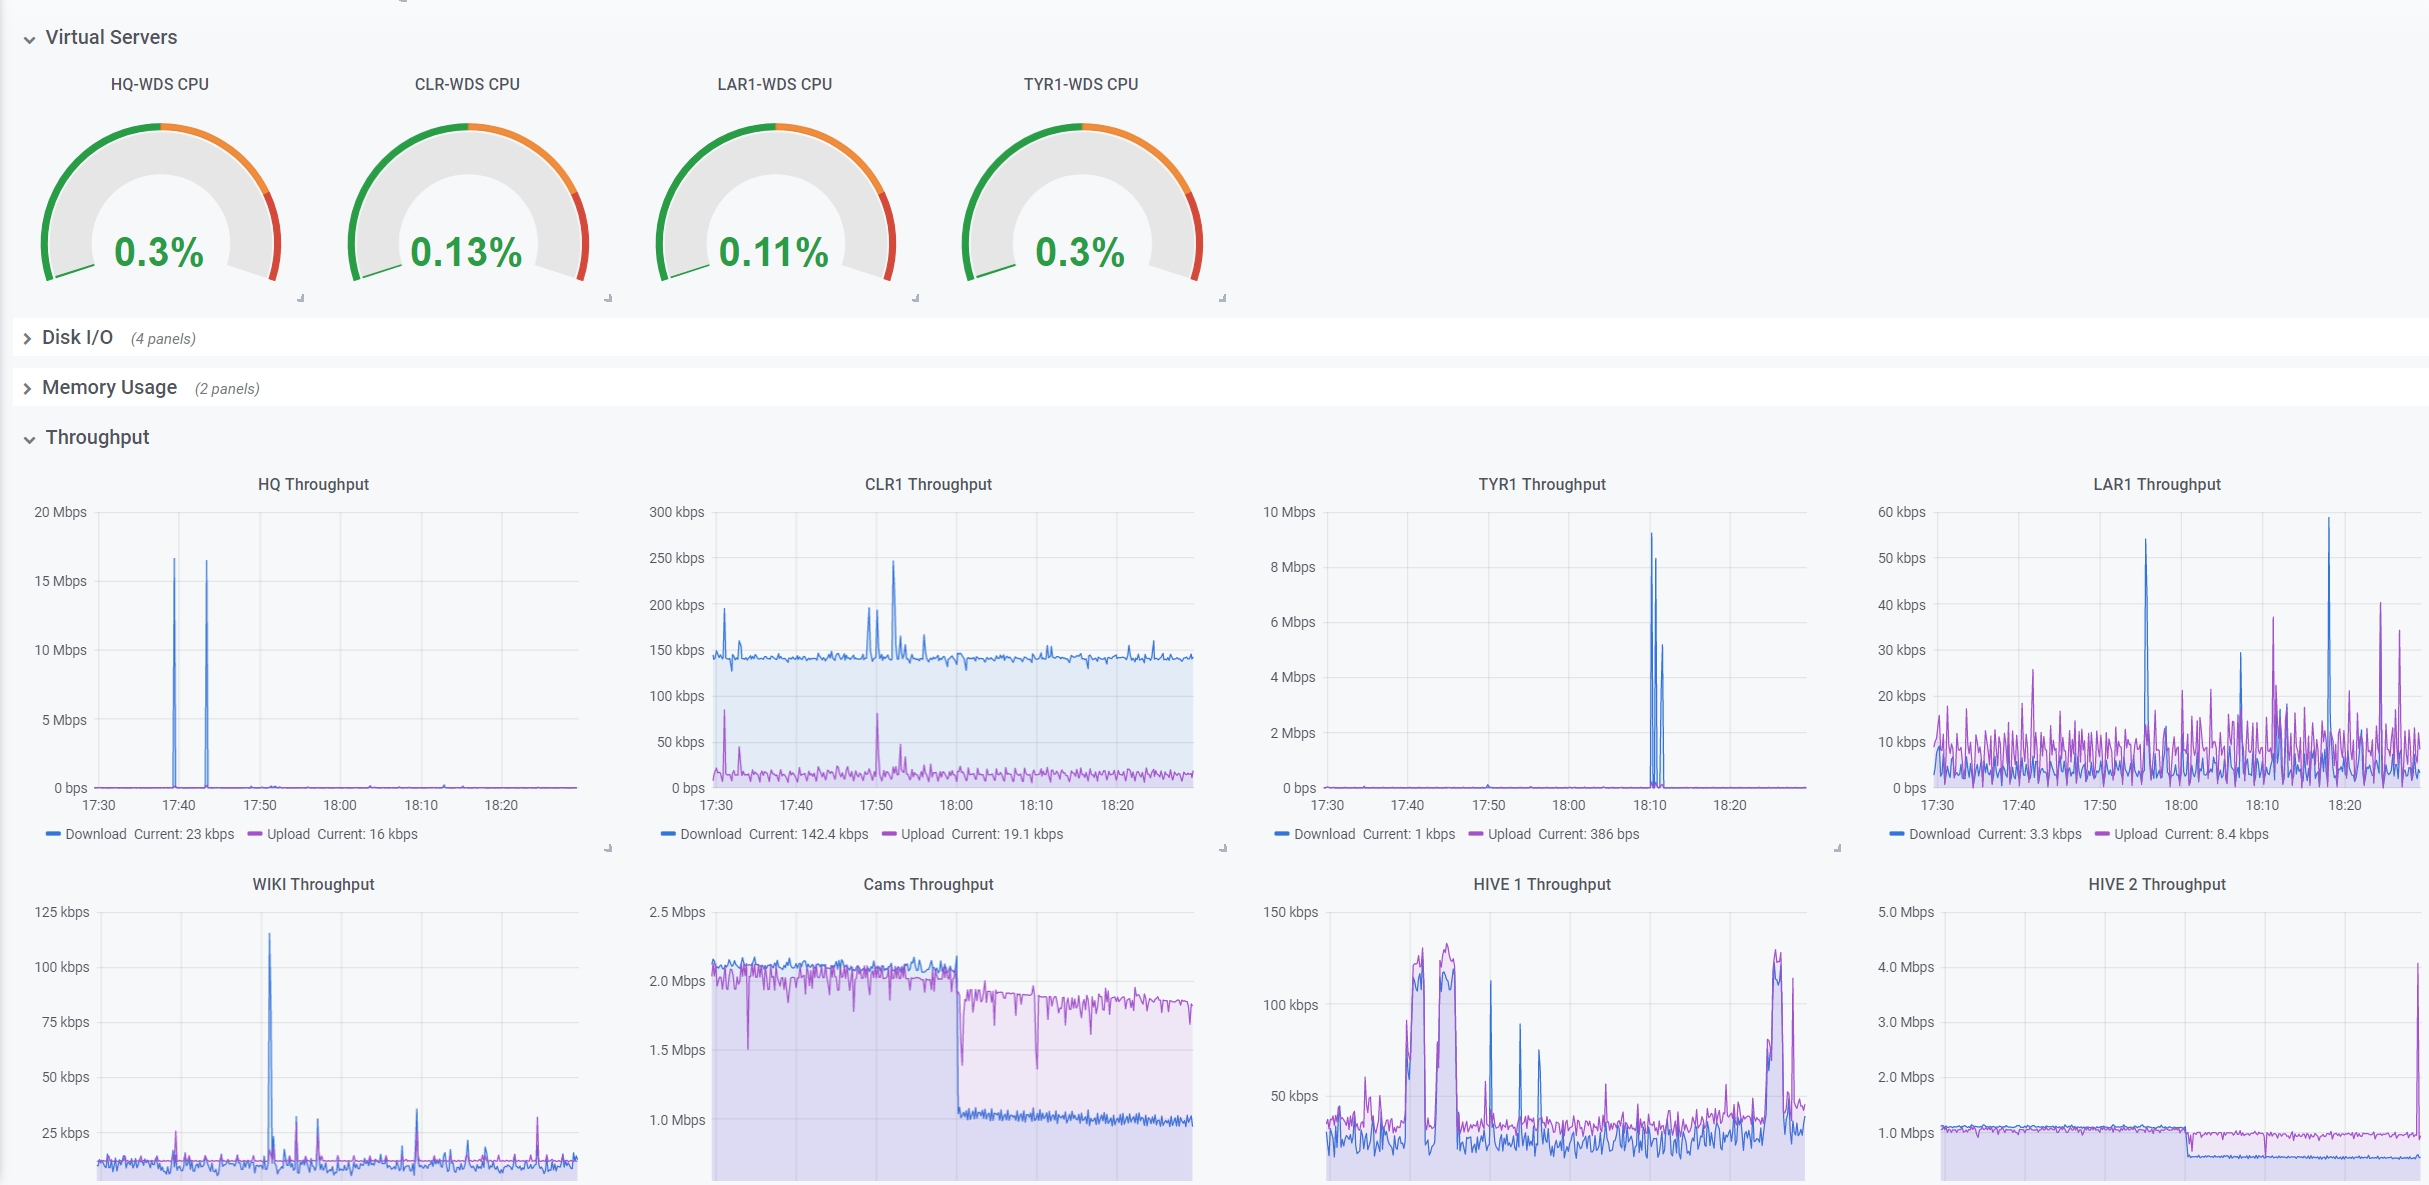
The possibilities are nearly endless with this kind of graphing and information gathering. Some people like myself monitor things from hardware CPU/Disk usage, to services or uptime. Others utilize it to harness the readouts from home automation, such as KWh draw or temperature. So how do we do it? Thankfully the world is our oyster and the stack itself is easy to setup, after that tweak to your hearts content or base your work off of anothers template.
Lets get started!
To get started our environment example will have a vanilla ubuntu 18.04 server install and a vanilla Server 2019 Standard install. You can test environments like this if you have Windows Pro or higher by installing the Hyper-V feature.
TIP: Make sure your grafana server has a static IP address!
Lets login to our ubuntu server and make sure it is updated!
Now lets install them.
Now that we are all patched up lets get cooking! First things first, lets do the databases first. You see we don't have anything for the agent to talk to, and we don't have anything for grafana to take info from. So starting in the middle seems like a great idea.
Now all of the new installation links will be on the install pages above. We will be using the as of current links for this guide.
First things first, we need to download the installer package. Dont forget to 'sudo'!
Now we install it! for this dpkg.
Now we just installed something new, so we need to make sure its running. Lets go ahead and start the process.
Cool beans! So we downloaded it, and we installed it, but its not going to work without a database right? right. So first lets talk to influx so we can interface with it. At the prompt just type.
We want to create a database for our file server. Lets make one with a simple name. Thankfully influx commands are pretty straight forward.
We just made a database called "filesrv" lets make sure we did it right and make sur it exists, maybe you can guess what we will type.
I know, earth shatteringly complex commands.
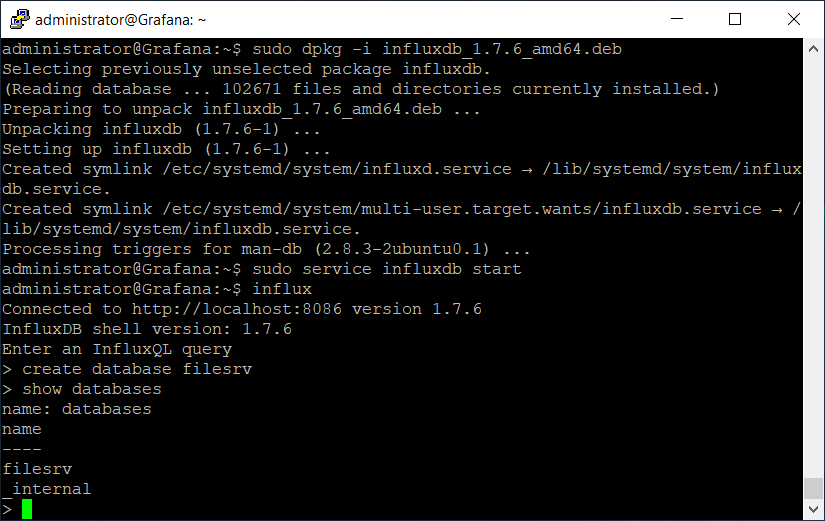
now just exit out of the influx command line with a simple;
Cool so now that we have influx installed lets move on to Grafana.
Super simple process just like before. I'm sure if your following the guide that may have taken you several minutes, but I bet if you asked yourself if you could do it again you could do it in less than 3.
To start lets download the installer.
Now a little hint, grafana requires a font library to properly display things. If we just installed grafana now ubuntu would get mad. So lets install that library real quick.
There all better, now lets get to the meaty part and install grafana.
Alright! Now just like influx lets start it up!
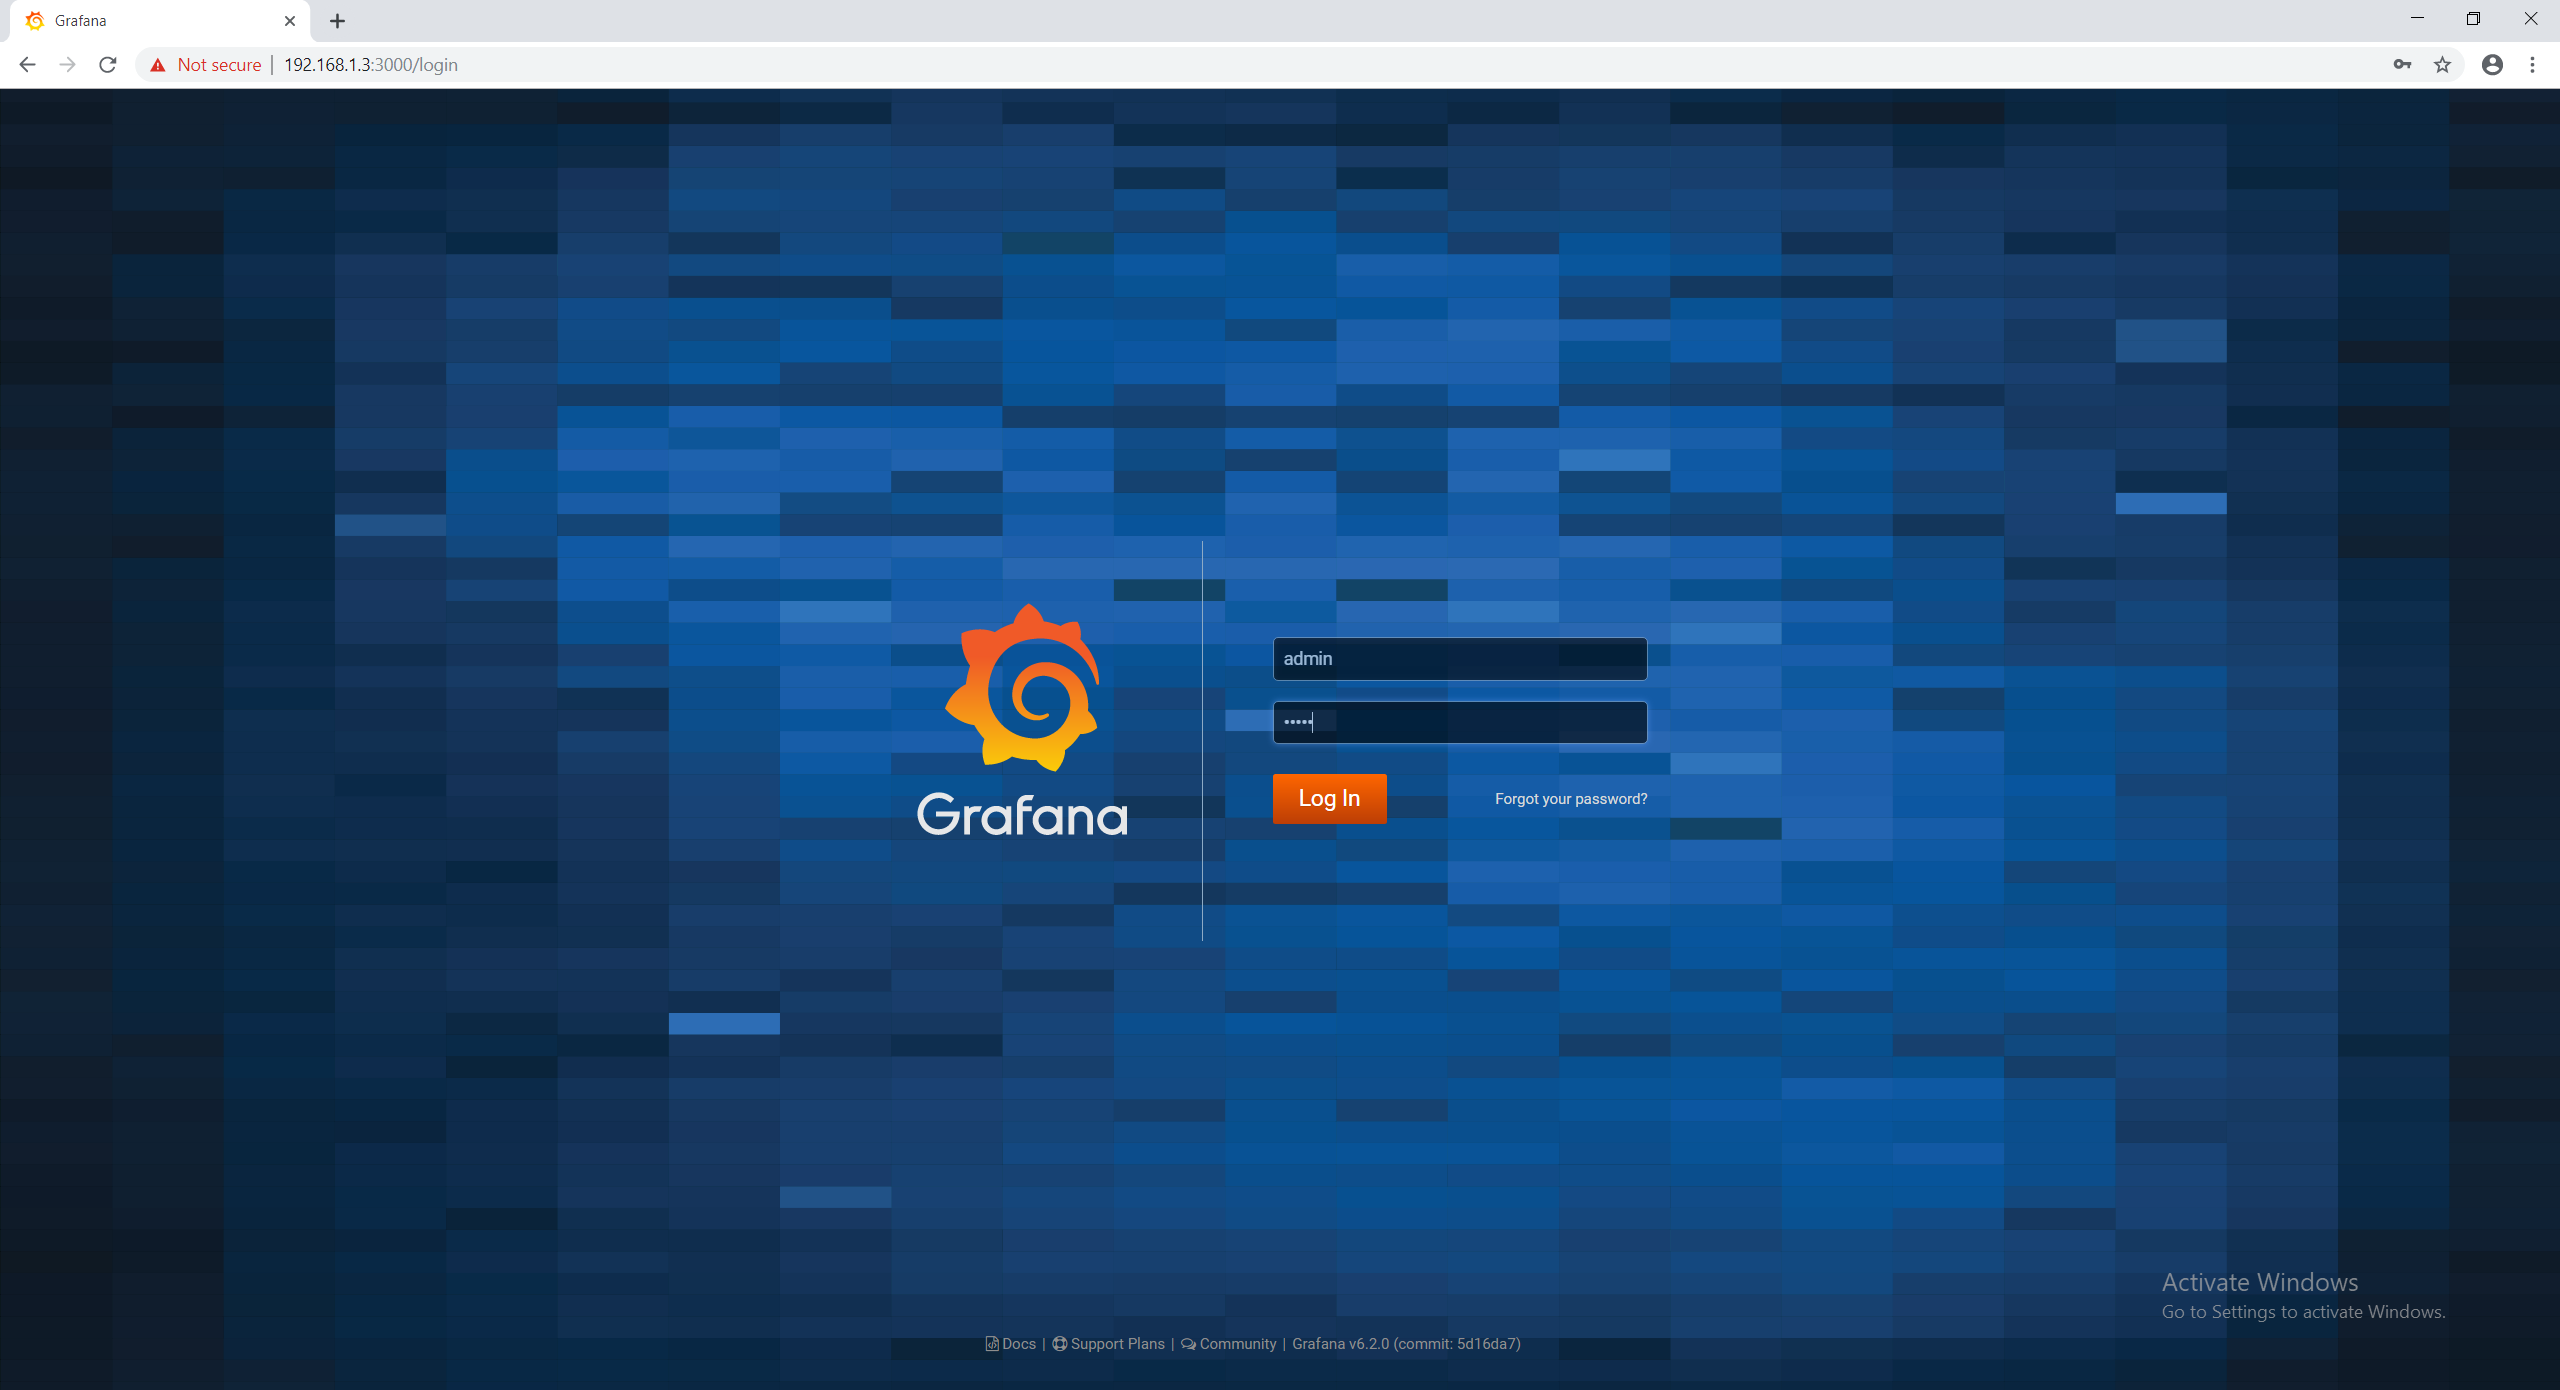
Wew all done! As I'm sure you noticed at like 90mb these two pieces of software are totally brutal on your machine so I imagine it took you hours to download them. Moving on. Lets take a peak at your grafana home page. By default the port is 3000. In my case it is
192.168.1.3:3000
Now the degault USN and pass for grafana is
Feel free to change it.
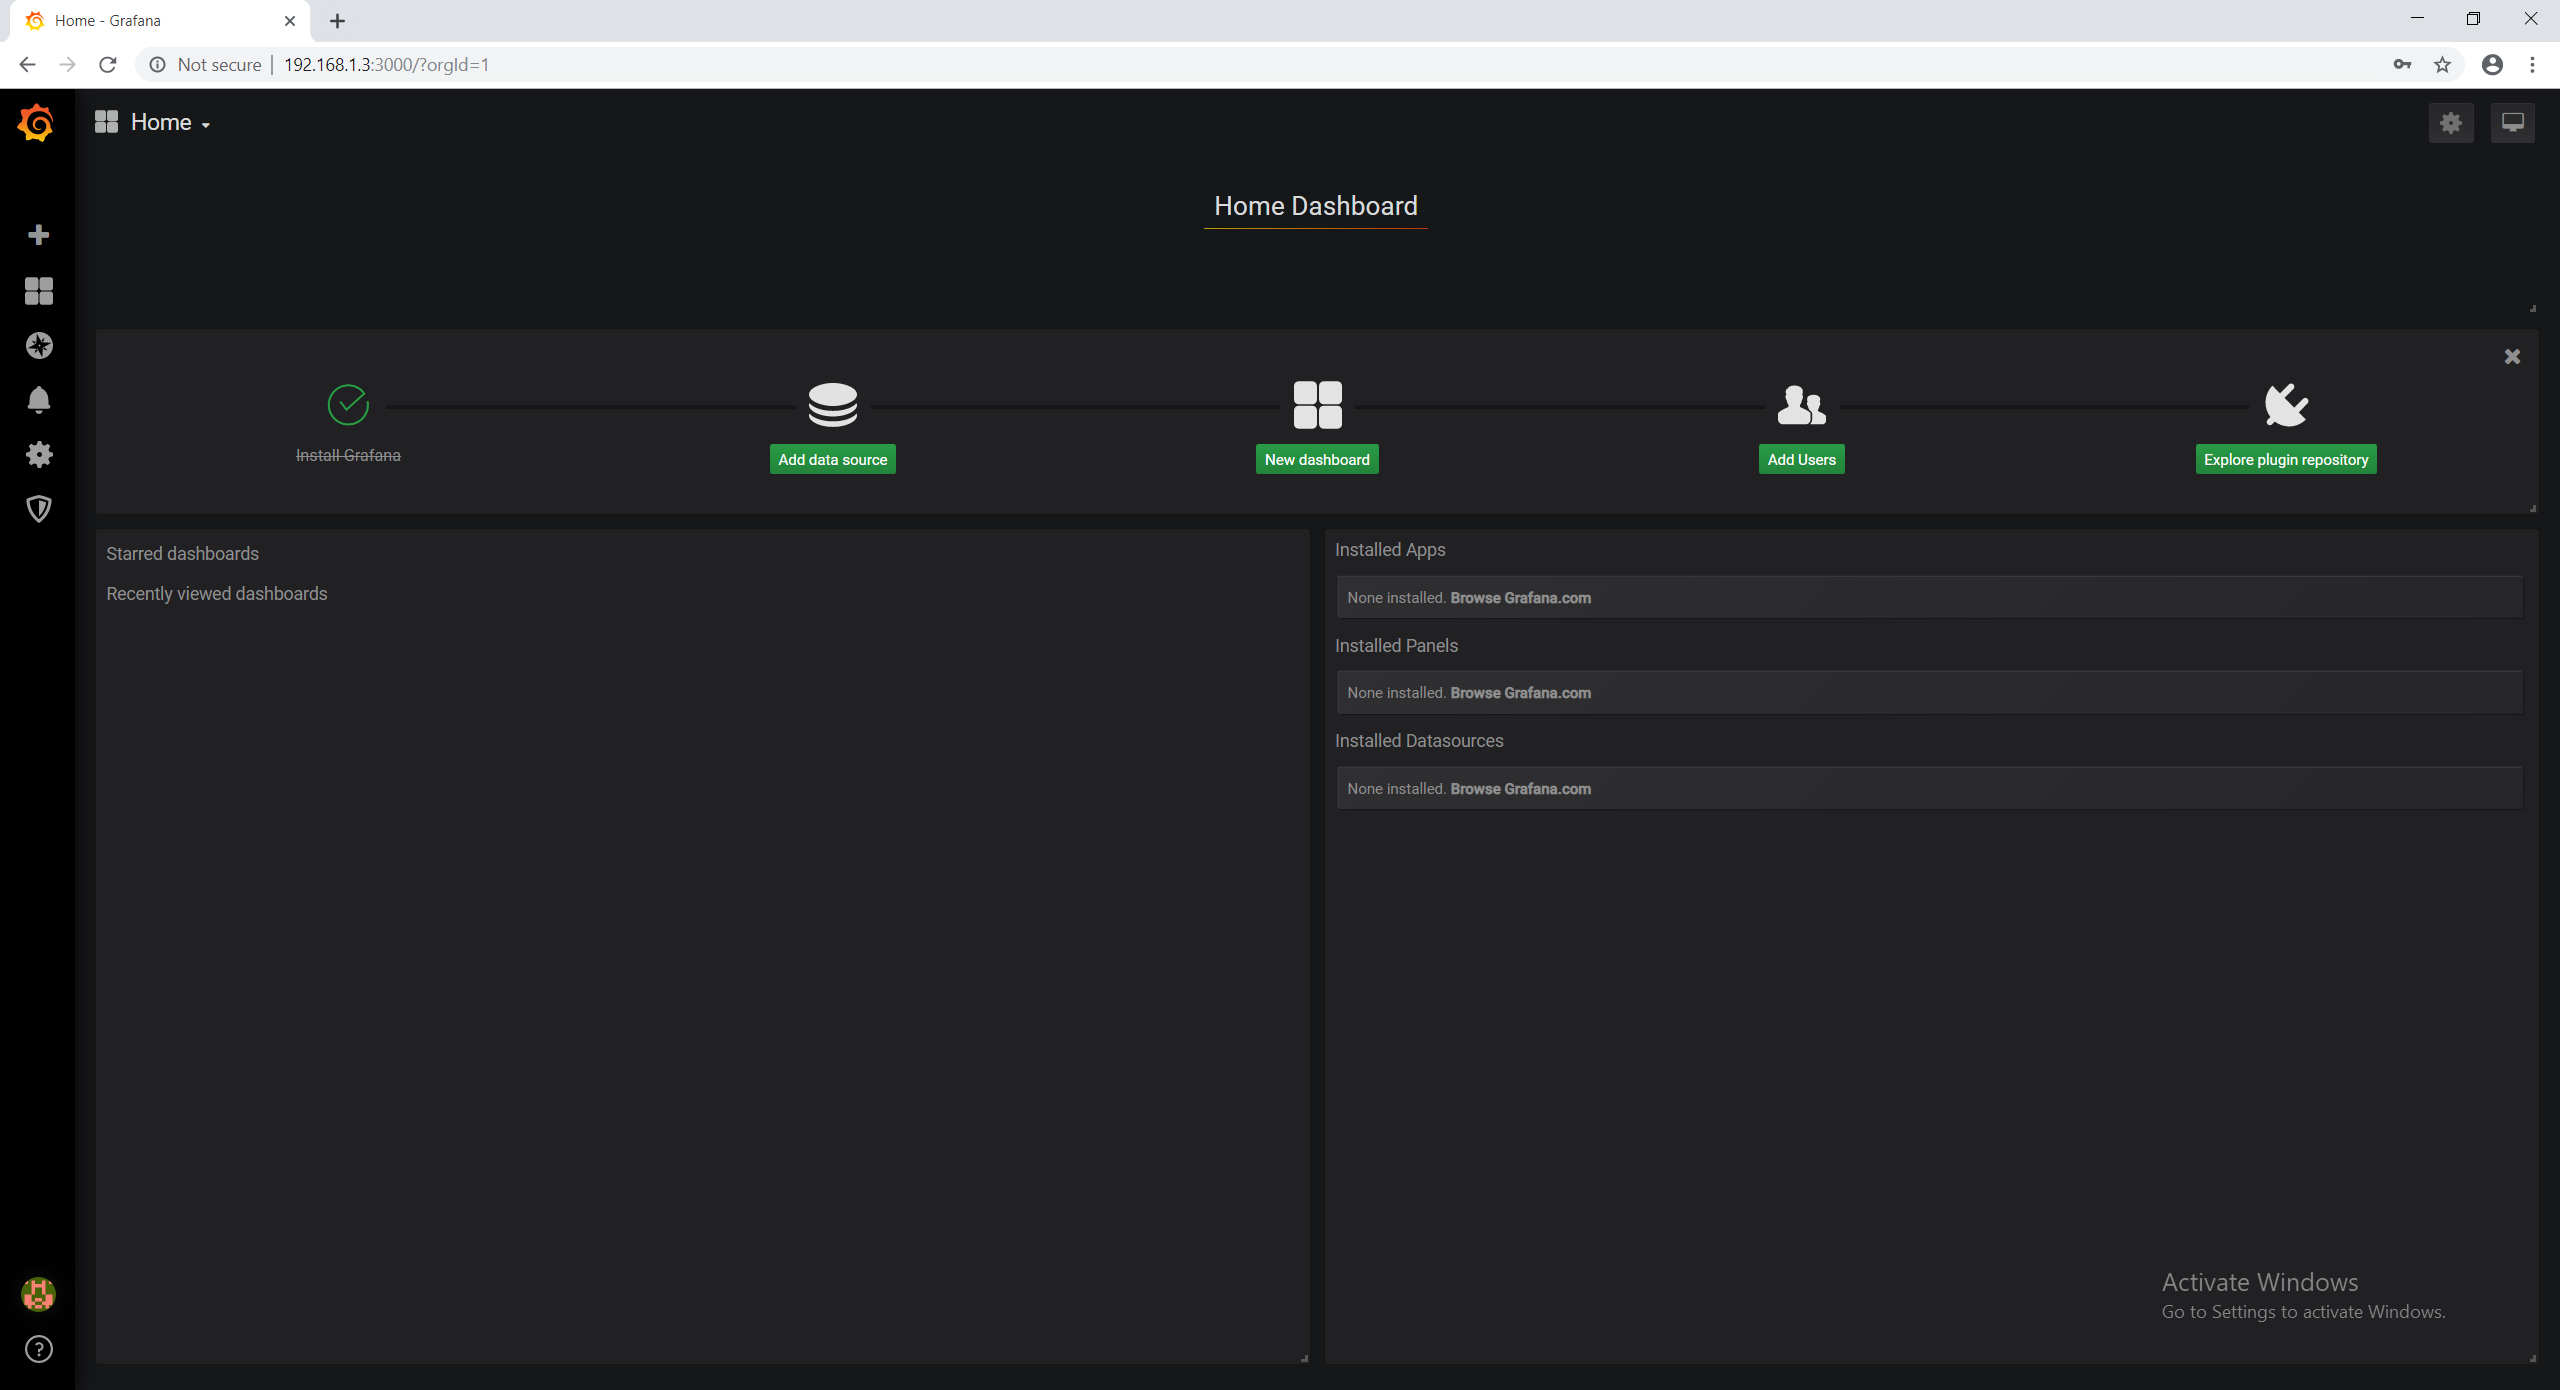
Next we will Add a data source. This basically means we are going to pick the DB we want to use. As I am sure you have noticed via the first start menu Grafana makes this dumb easy, so forgive me if I think I haven't lost you yet.
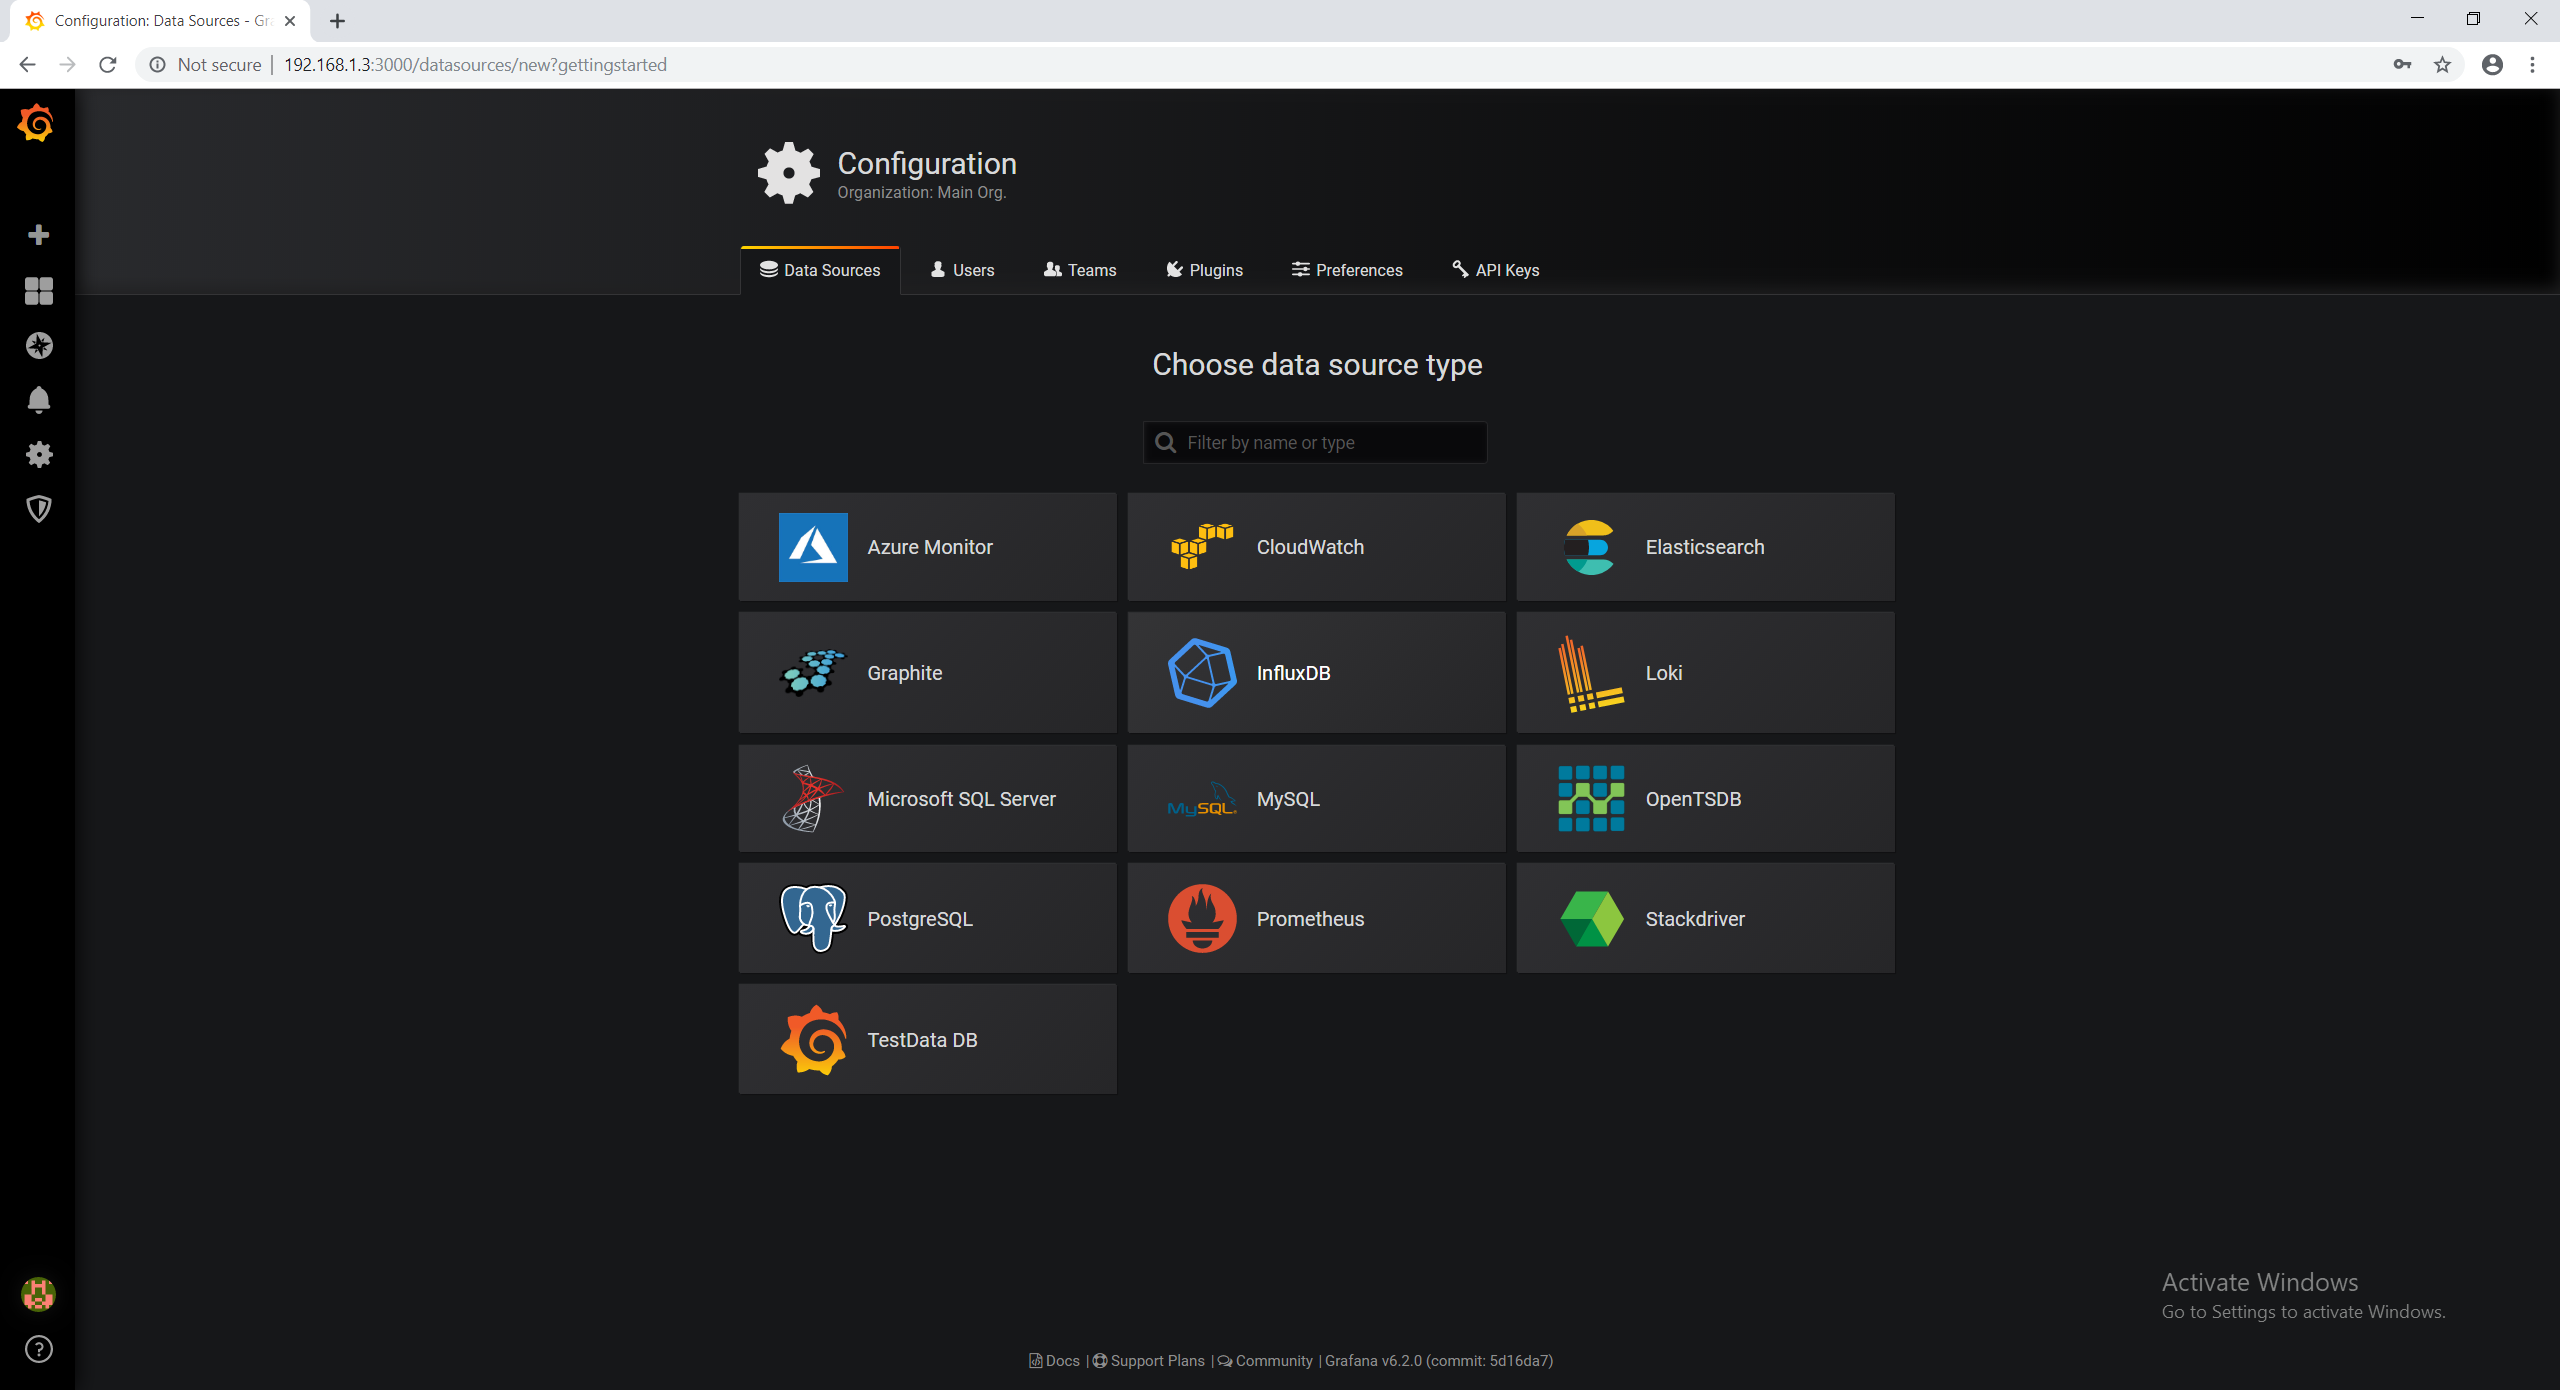
In our case we are going to pick "InfluxDB" because well if you don't know by now this guide may be a little out of your tech scope.
Now we configure grafana to talk to our database, don't worry this isnt scary and its pretty simple. Name the "Data Source" whatever you want as long as you understand it. Next In the URL field just double click (in case your browser understands autofill) and select the default option of
Next we type the database name as we named it in Influx. Lastly, we enter the user name and password for grafana.
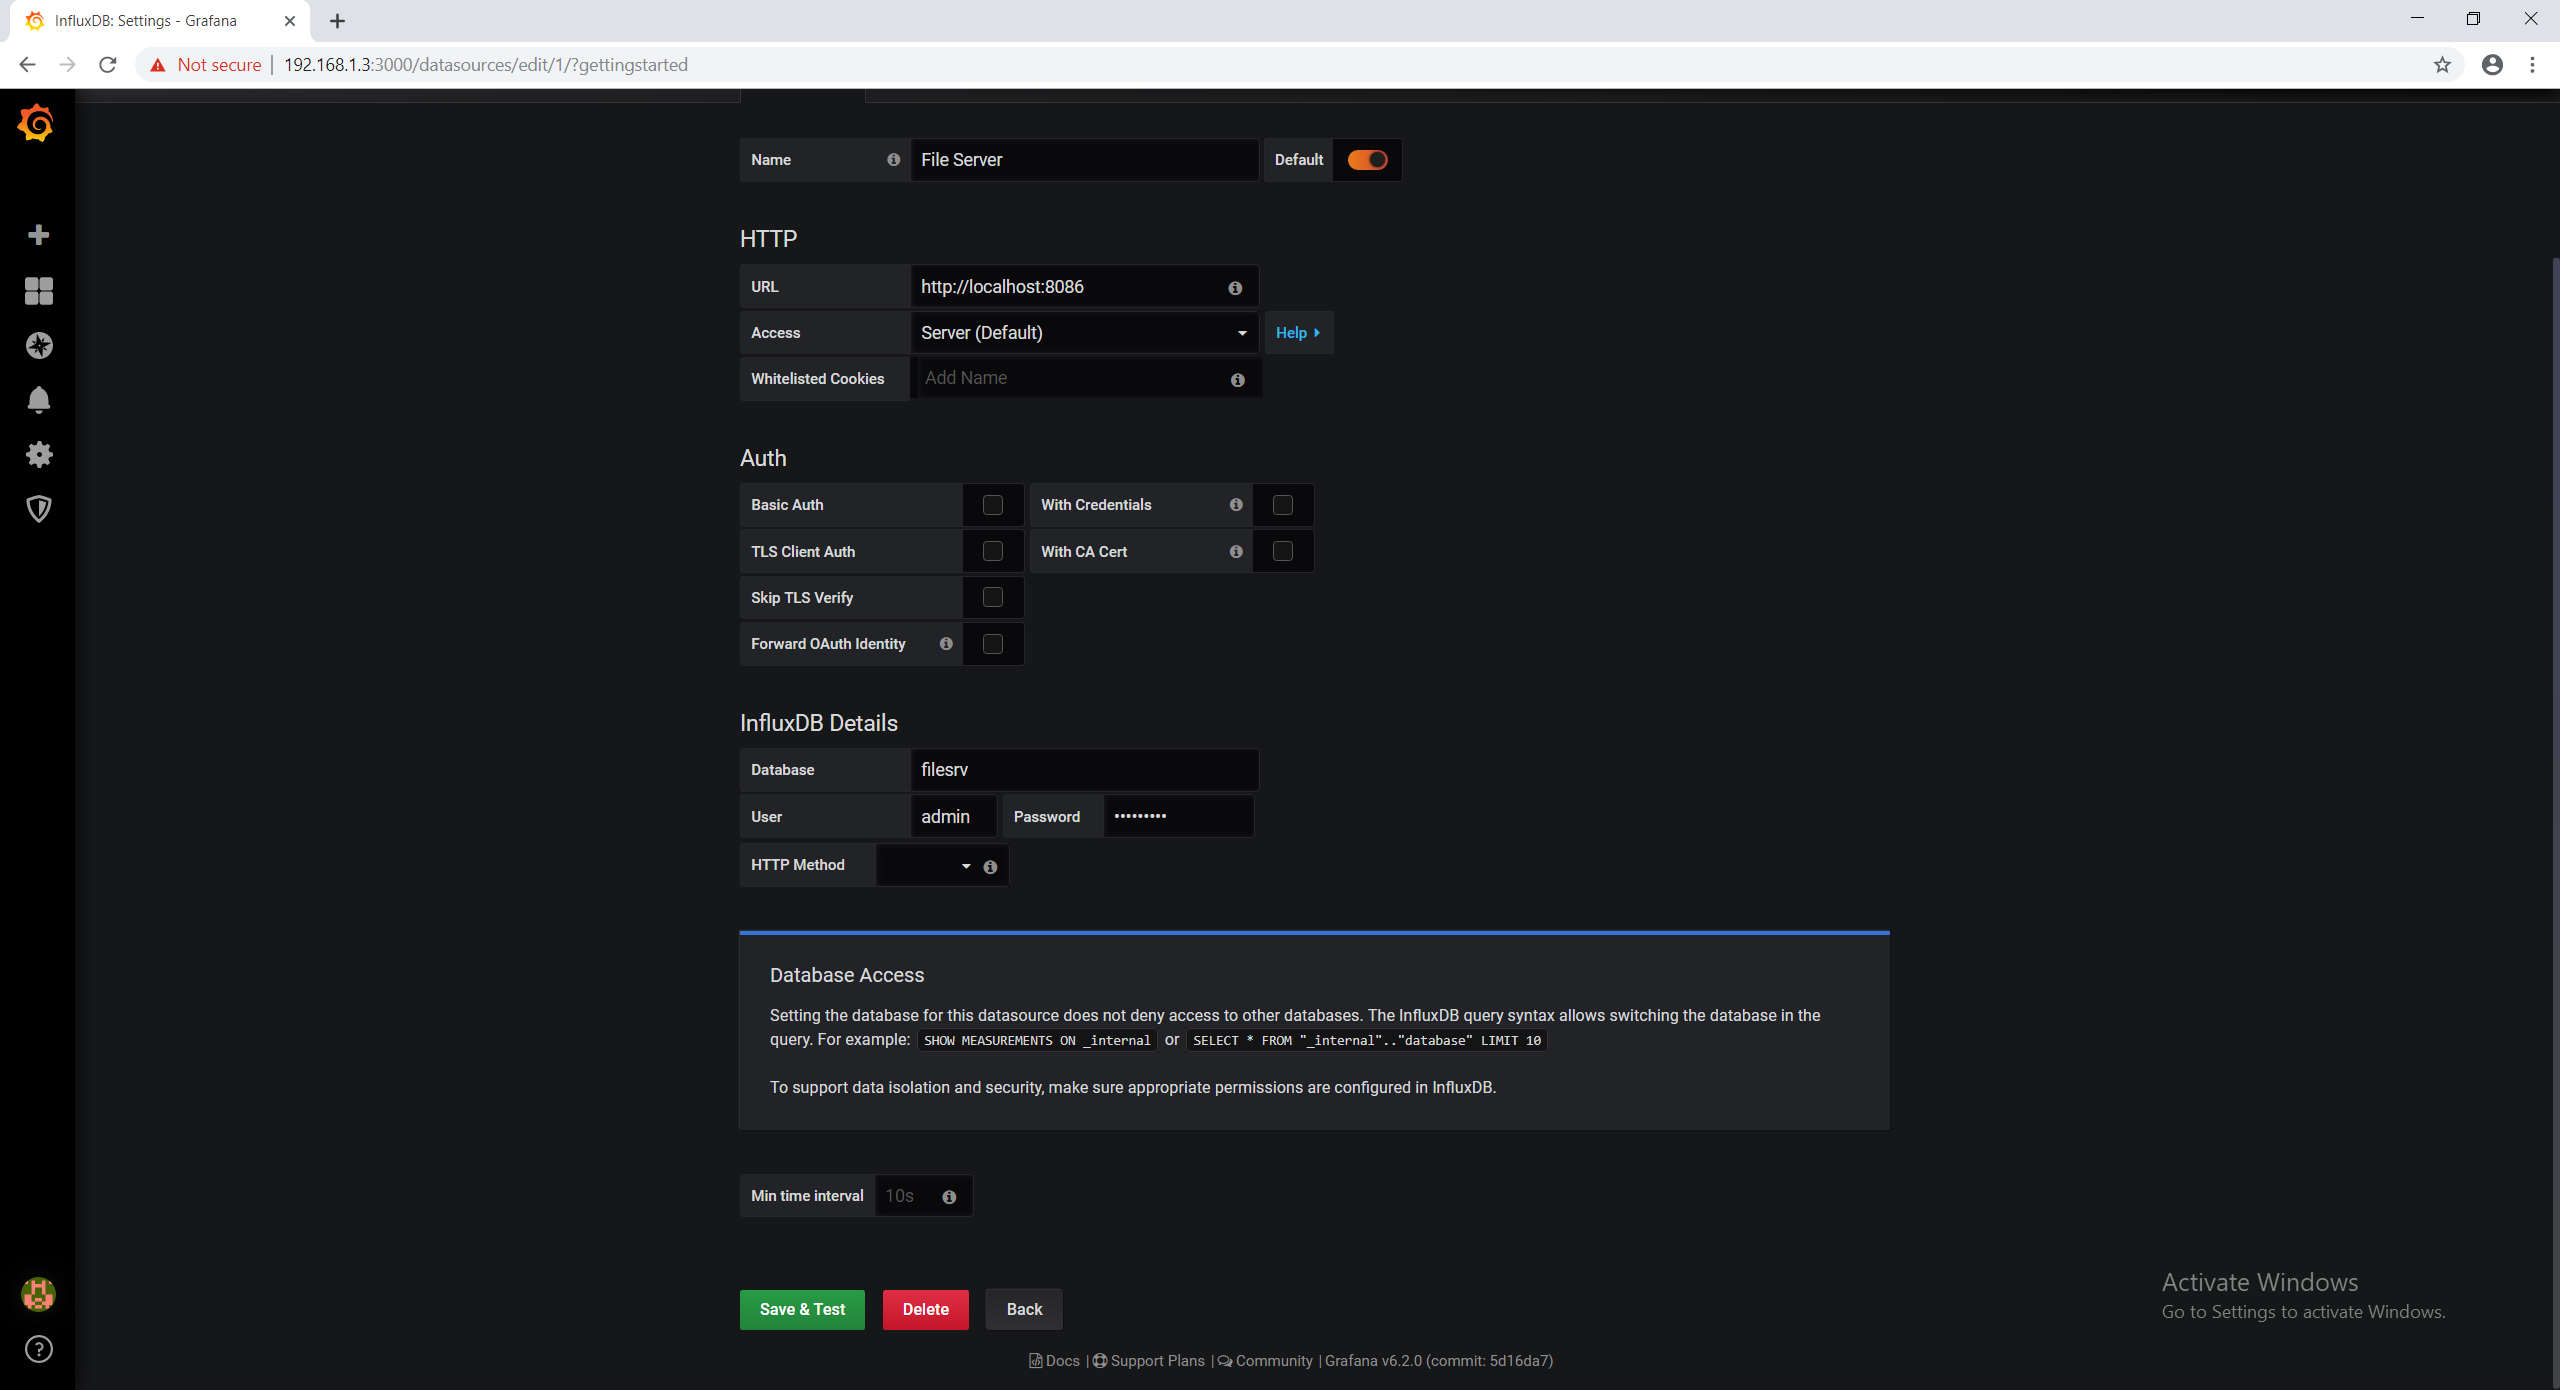
Now go ahead and click "Save & Test" This should start a quick self test that will let you know all is well and grafana can talk to the databse.
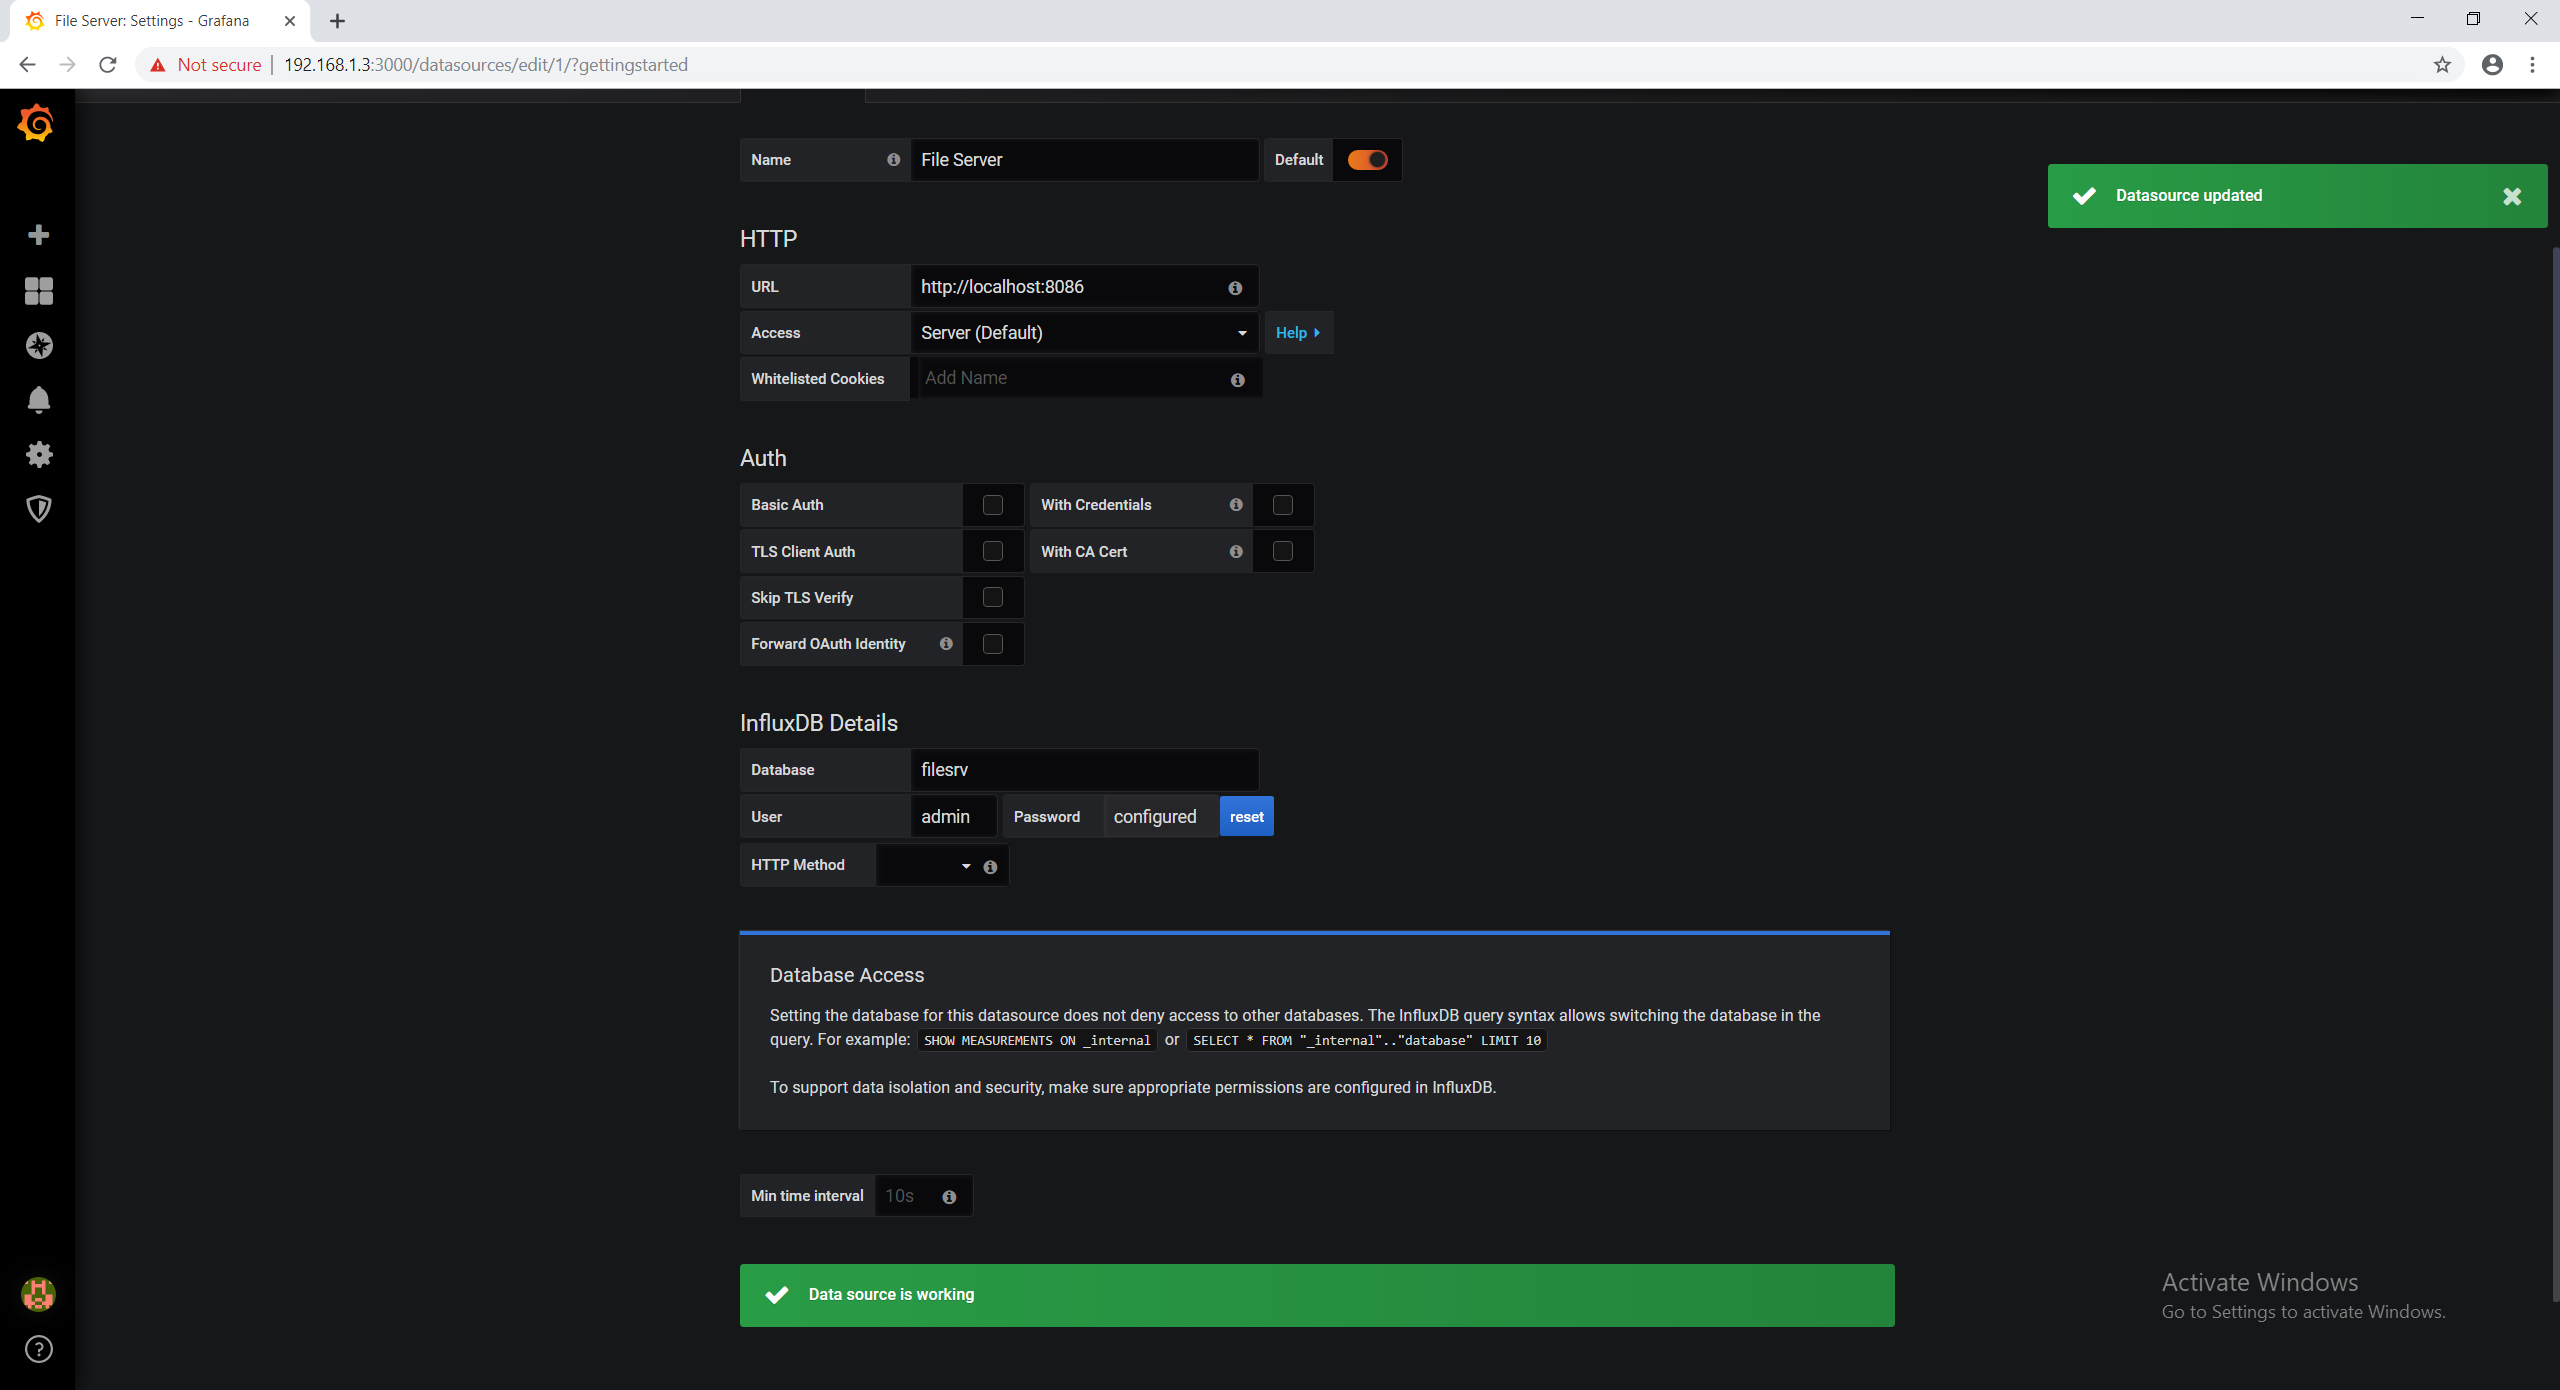
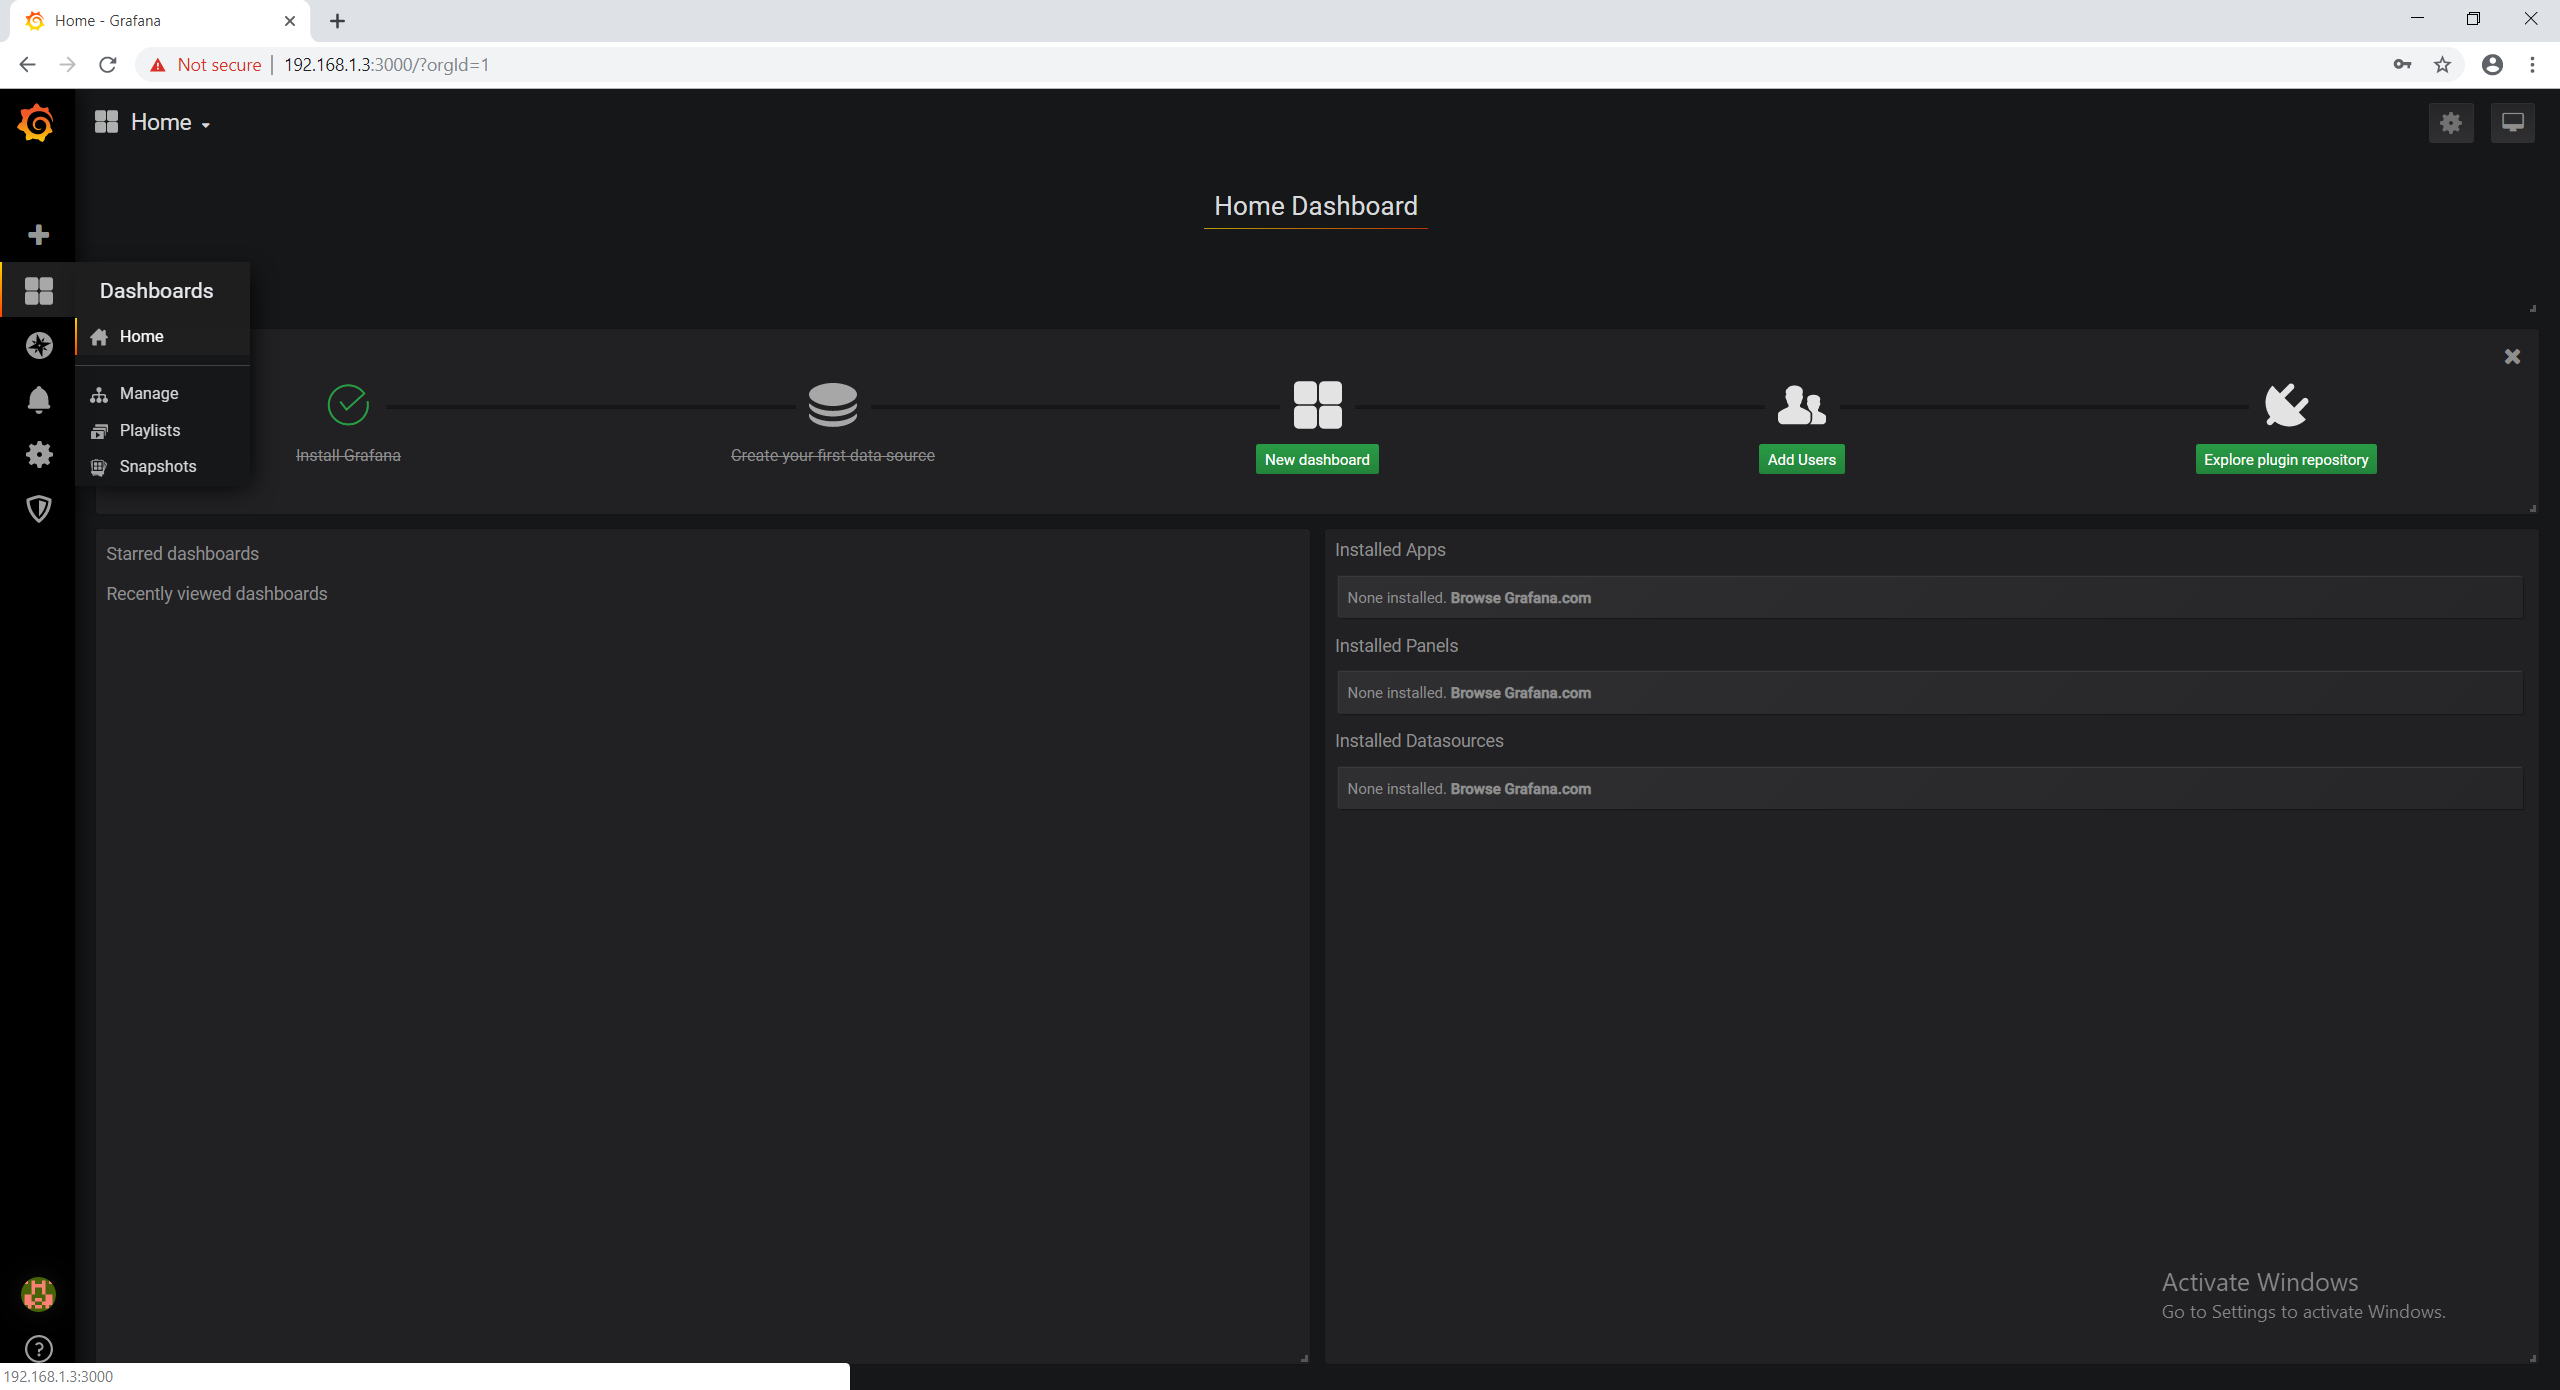
Yay all good! Now lets go "Home" by clicking the grid in the left hand menu and selecting home. Now we can make our first dashboard.
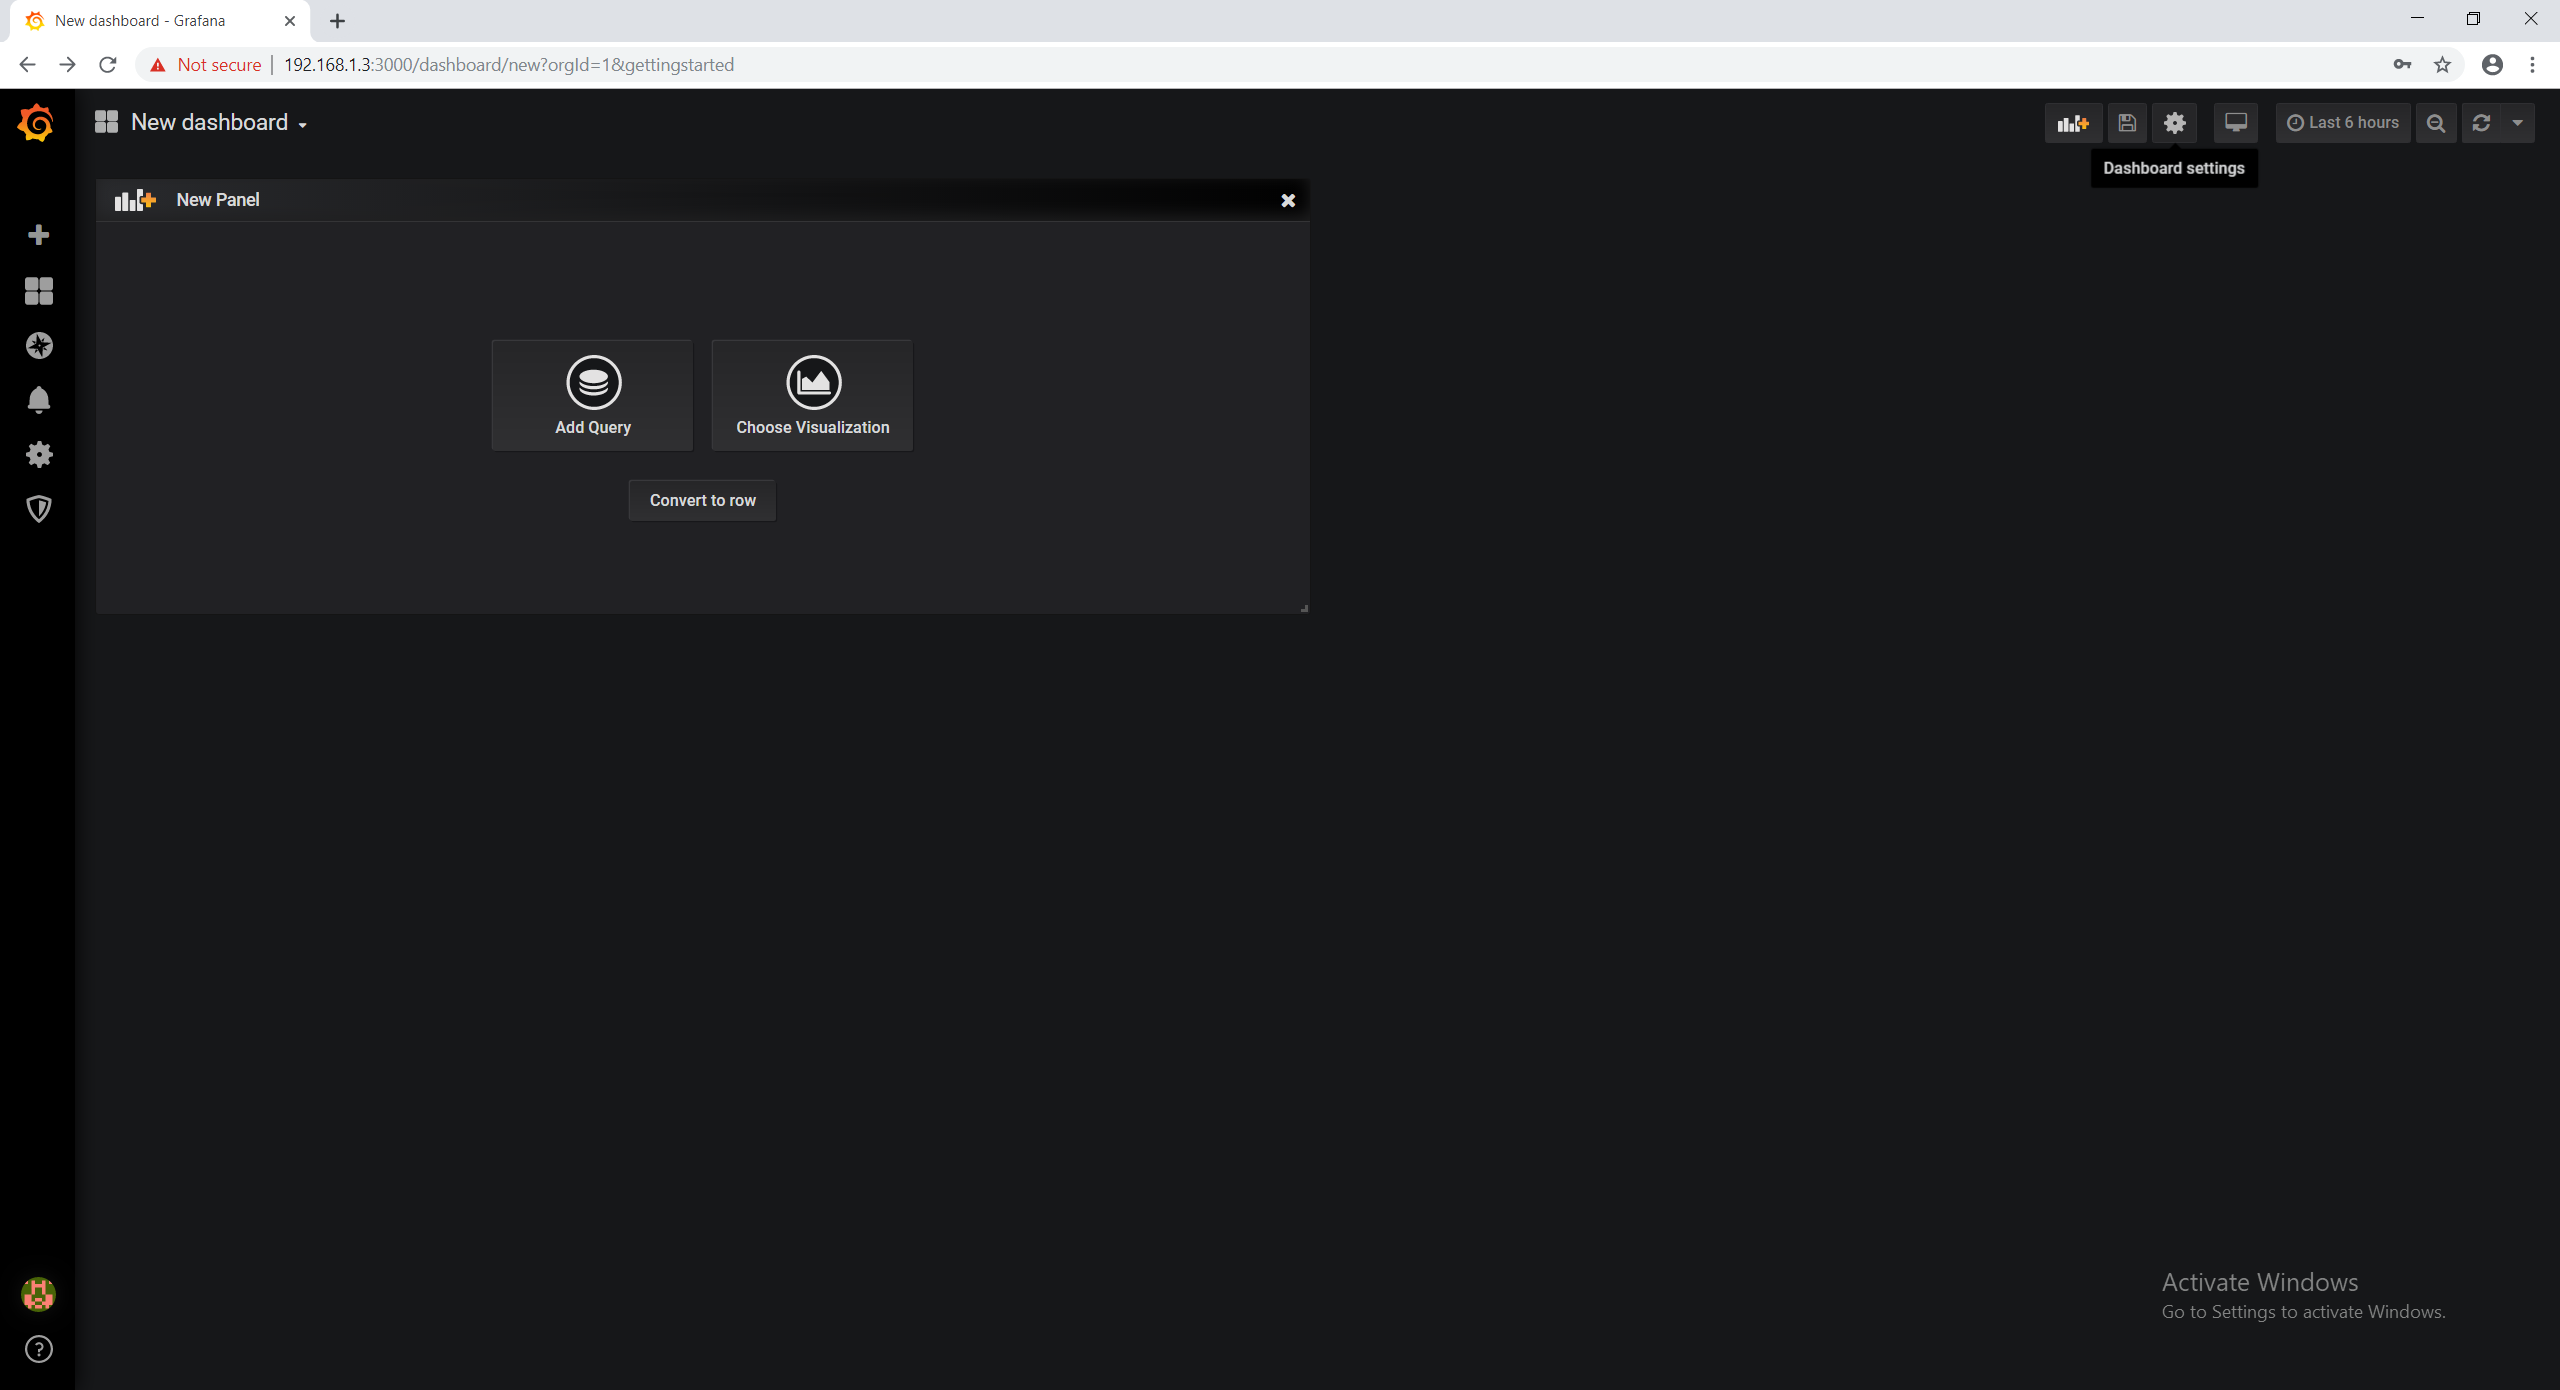
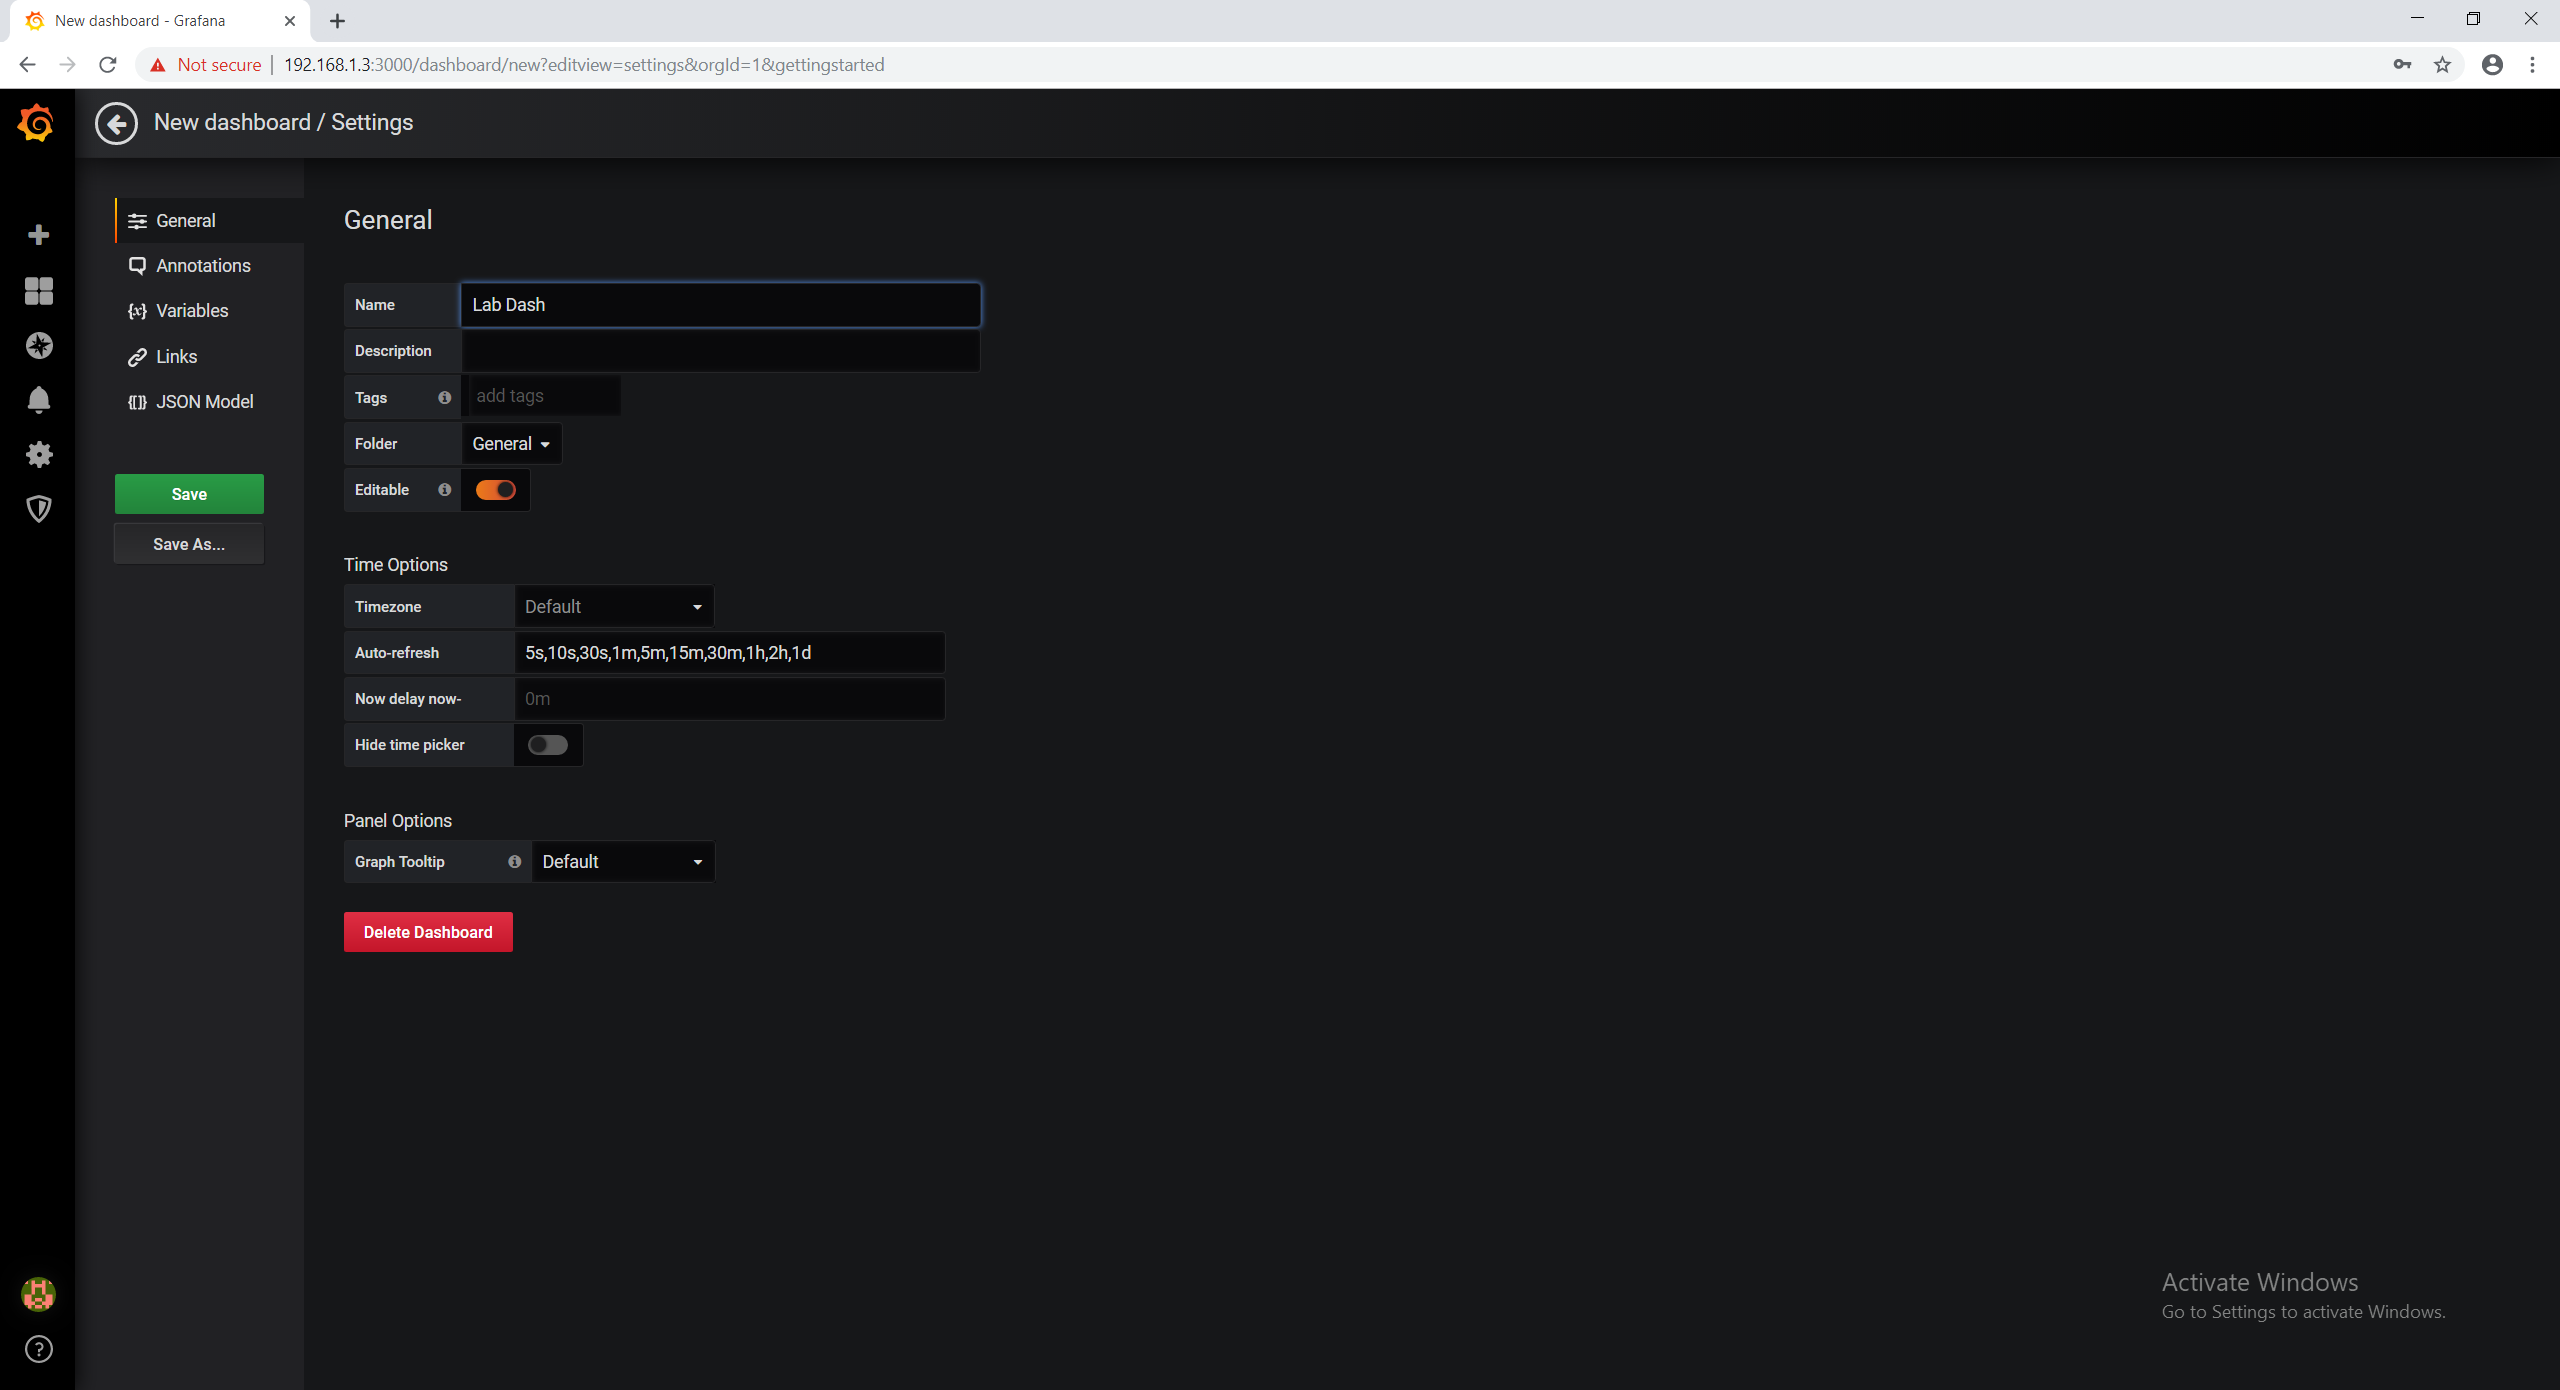
Once we click "New dashboard" we can immediately add data to it. We don't have any data right now so I just usually rename the dashboard at this point. Click the gear at the top right.
From here we can change the name and a few other options of the dash itself. Don't forget to save!
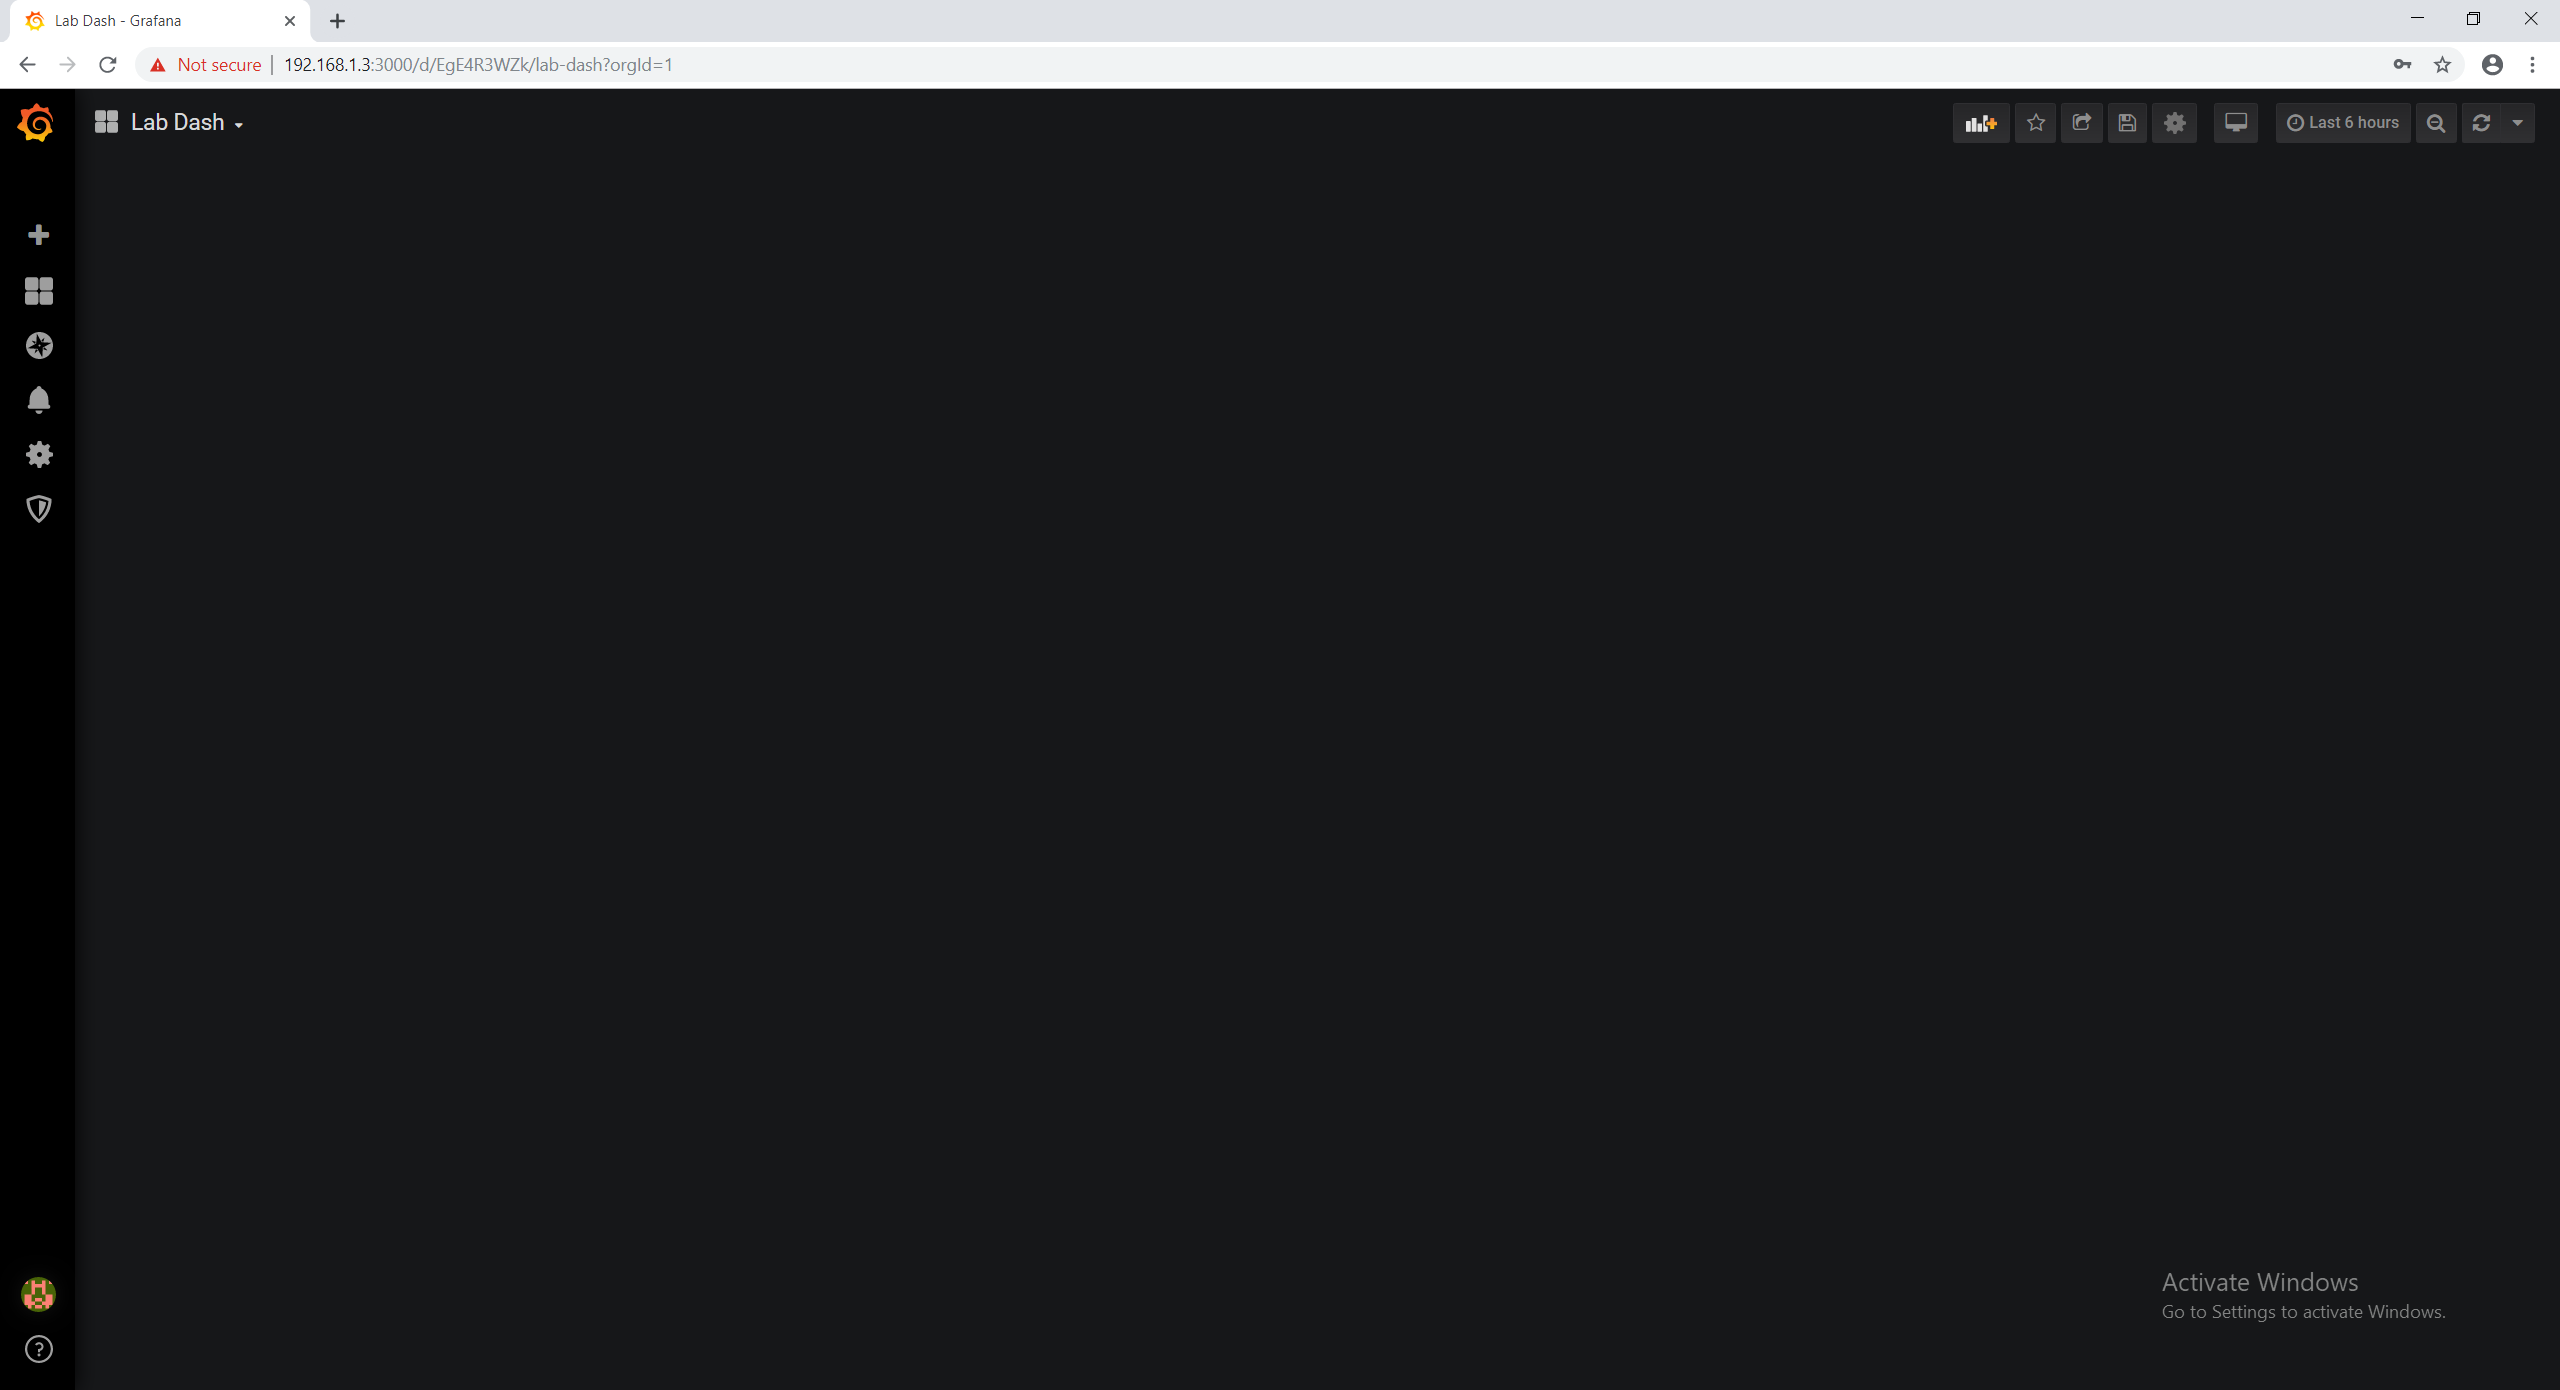
Now we have a blank dash with nothing going on!
Lets fix this and install telegraf.
Telegraf has alot of options for both Windows and *nix systems alike, but don't worry for this we will stick with the basics. (I also included the conf I use and the command to install it.) We need to edit 3 lines in the telegraf.conf file so that we can start getting data.
Boot up your windows machine here we go!
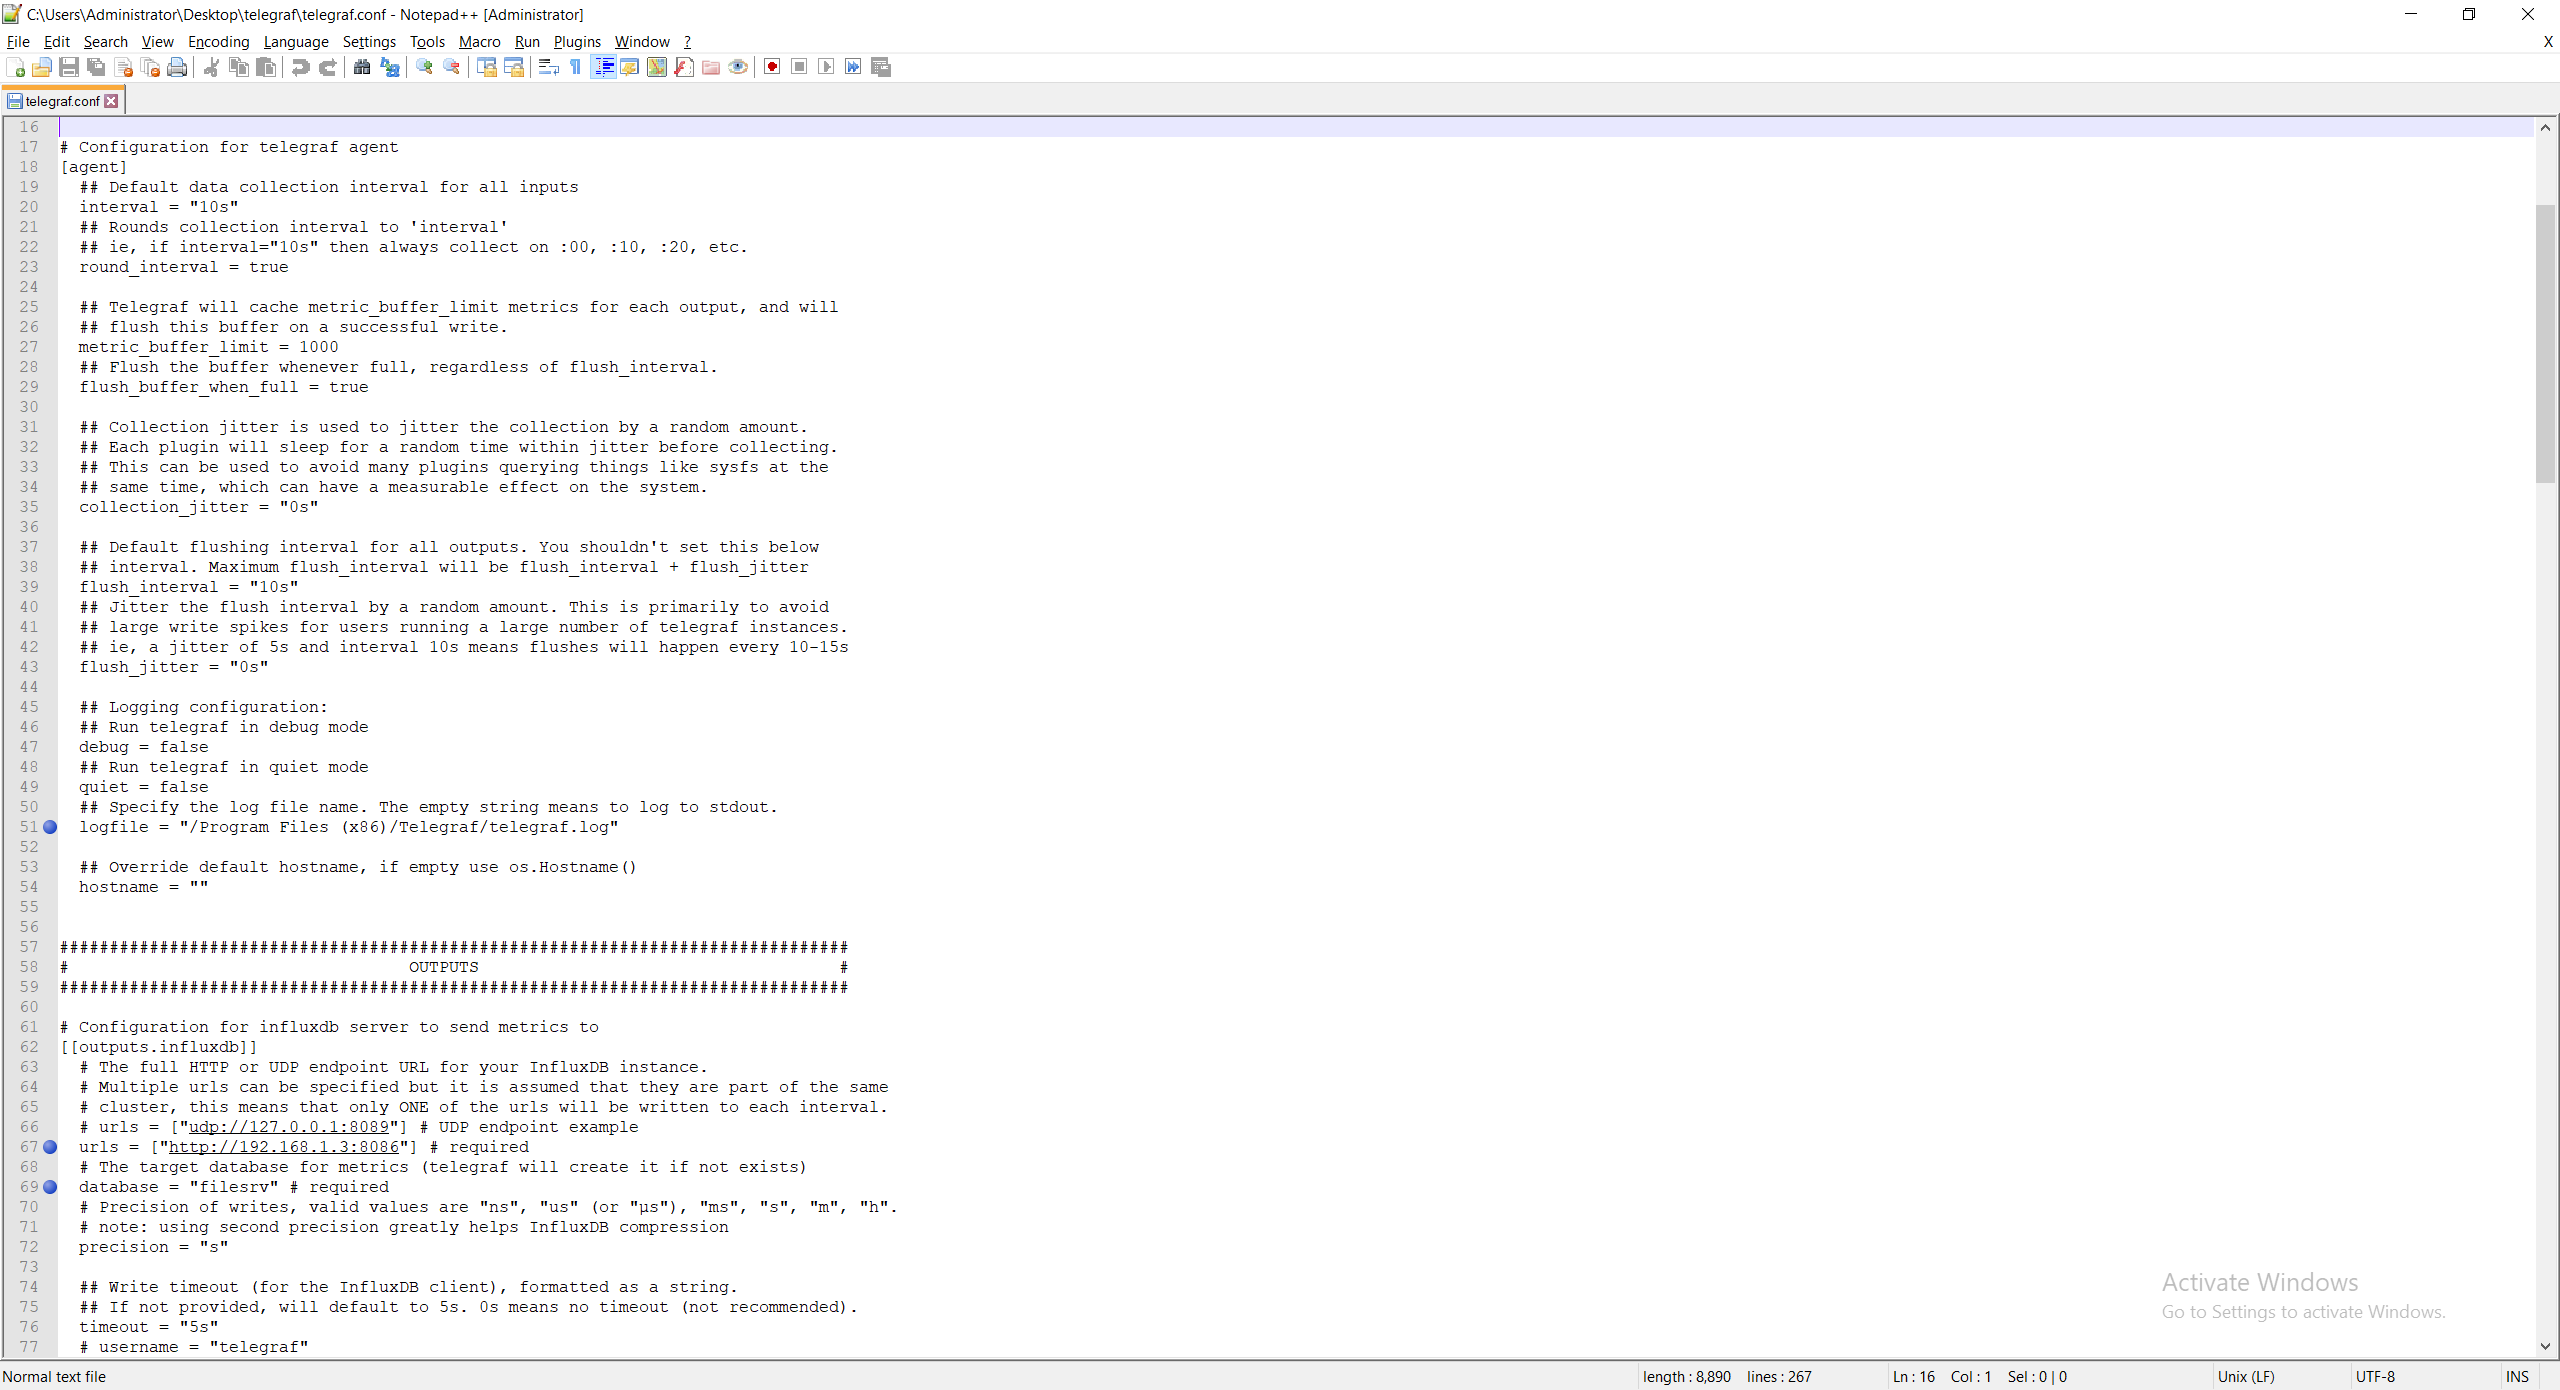
In our case notice we did
This is because we are going to make a telegraf directory with all of our files in the program files folder. This keeps it out of the way and in a place most people would look when troubleshooting.
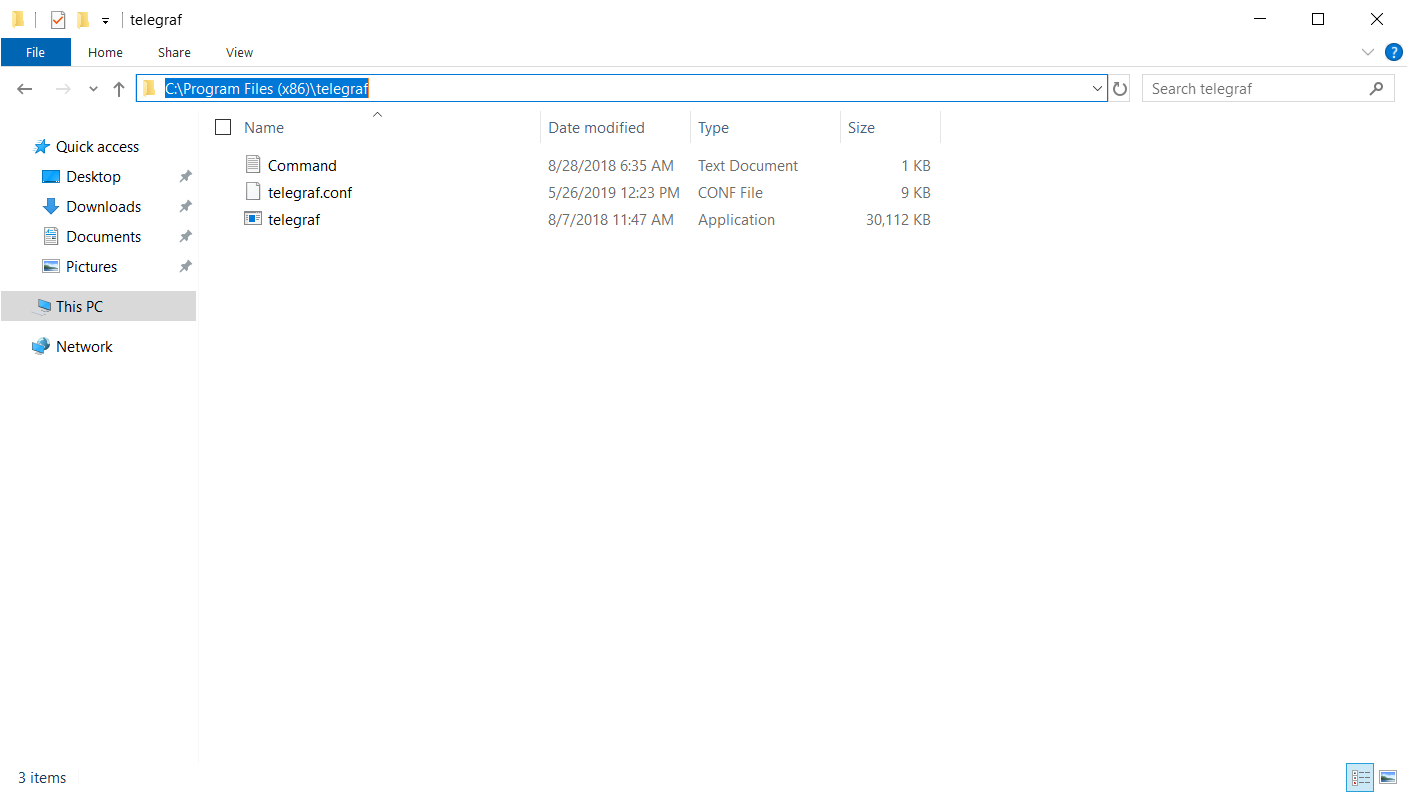
Now that things are copied over and ready to go lets open CMD as admin and copy the directory path of our telegraf directory. In this case again.
Now lets type the following into CMD to navigate it to that folder.
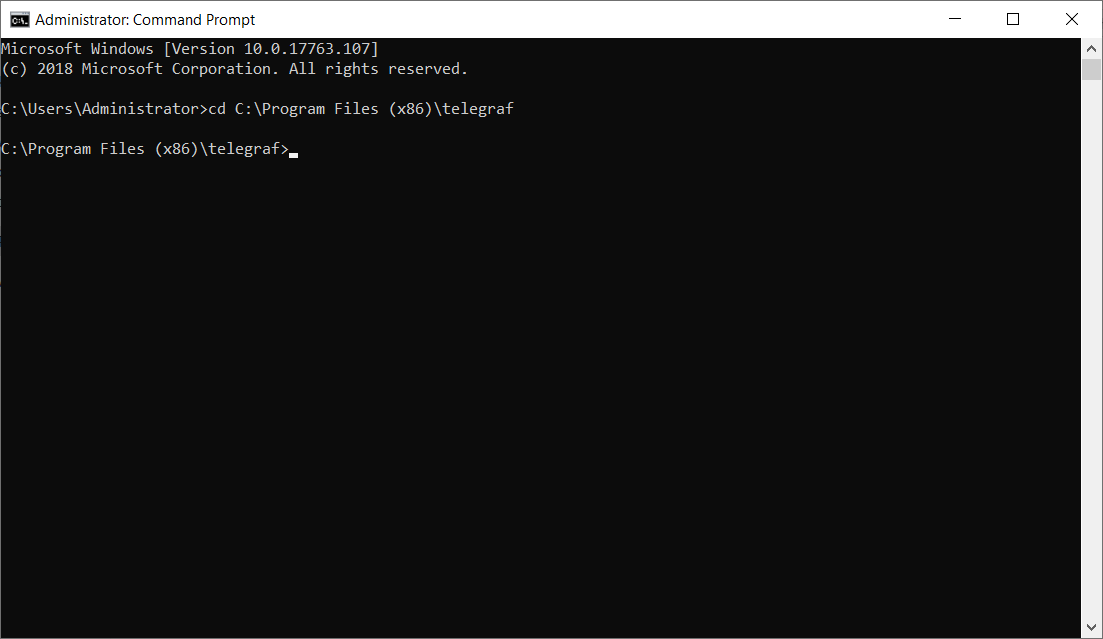
yay, now lets run the command to install telegraf as a service AND use the configuration file sitting in the directory with it.
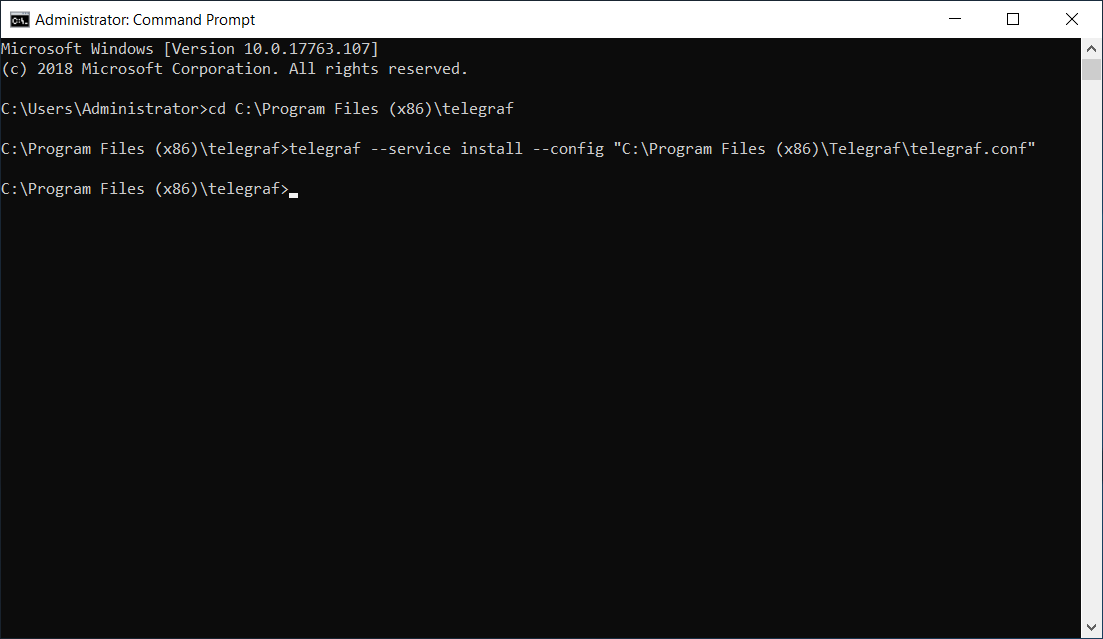
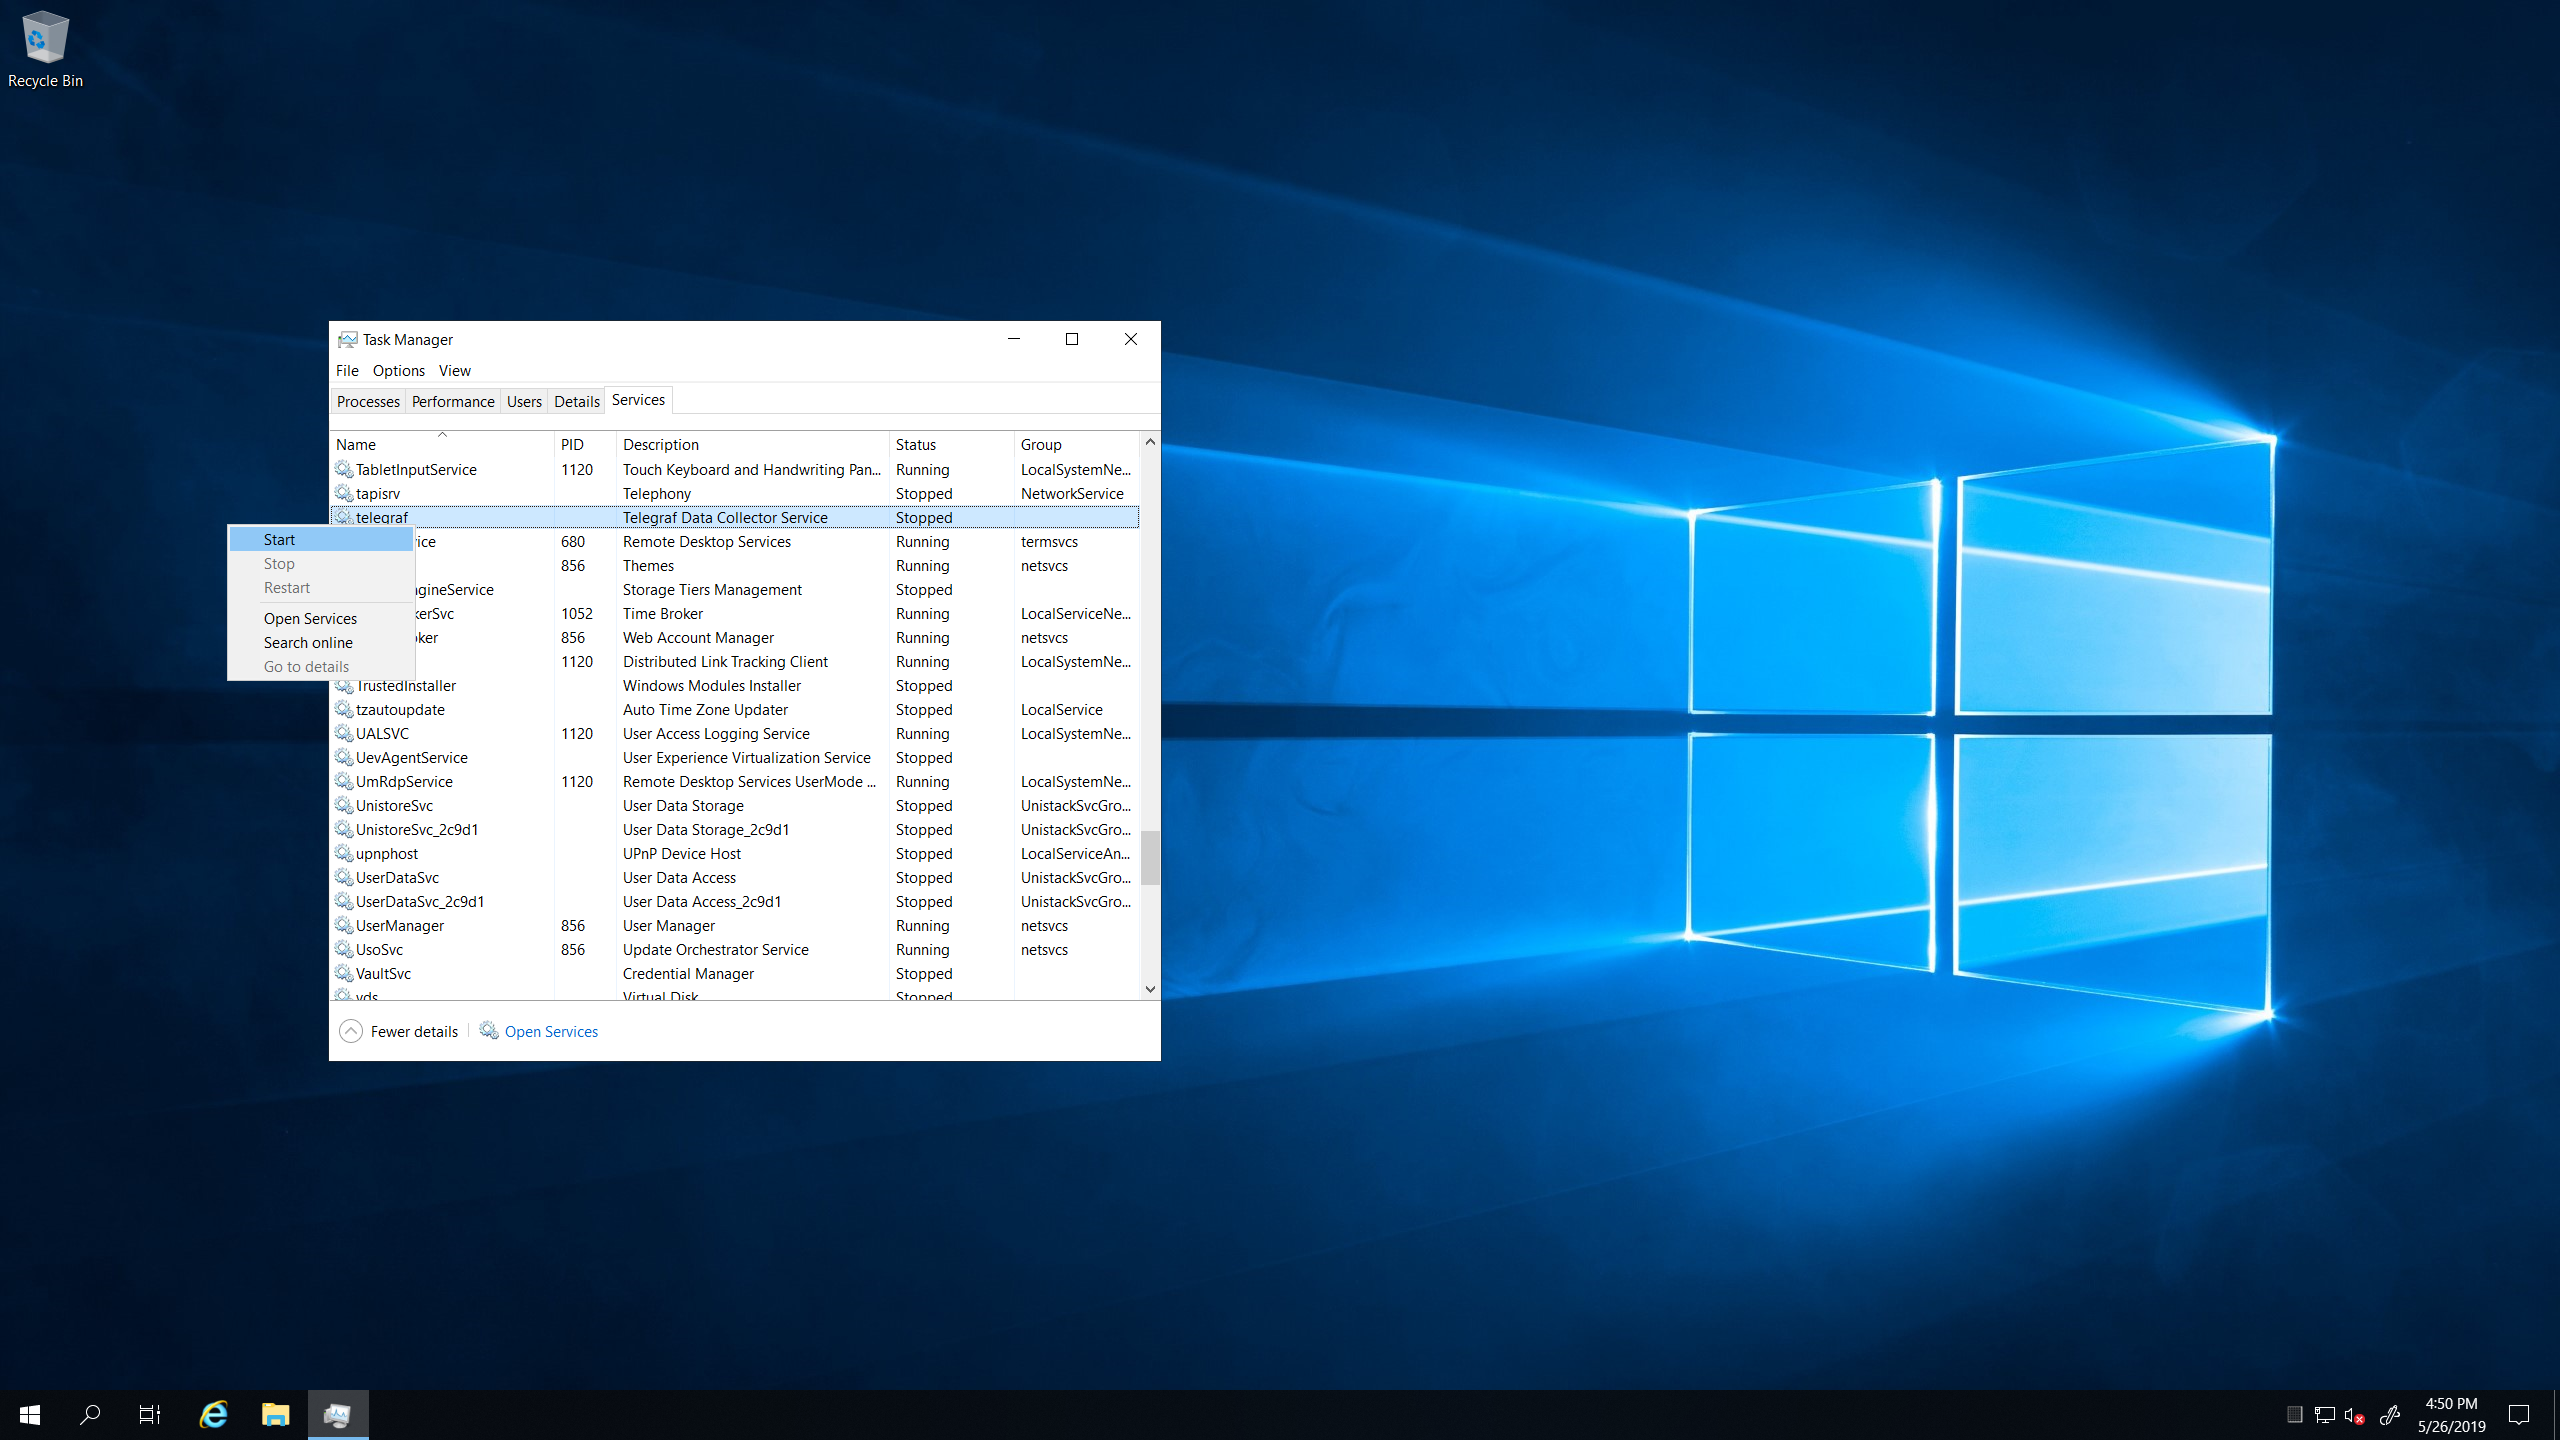
No errors! Last but not least lets open up the services tab in task manager and like influx and grafana start her up!
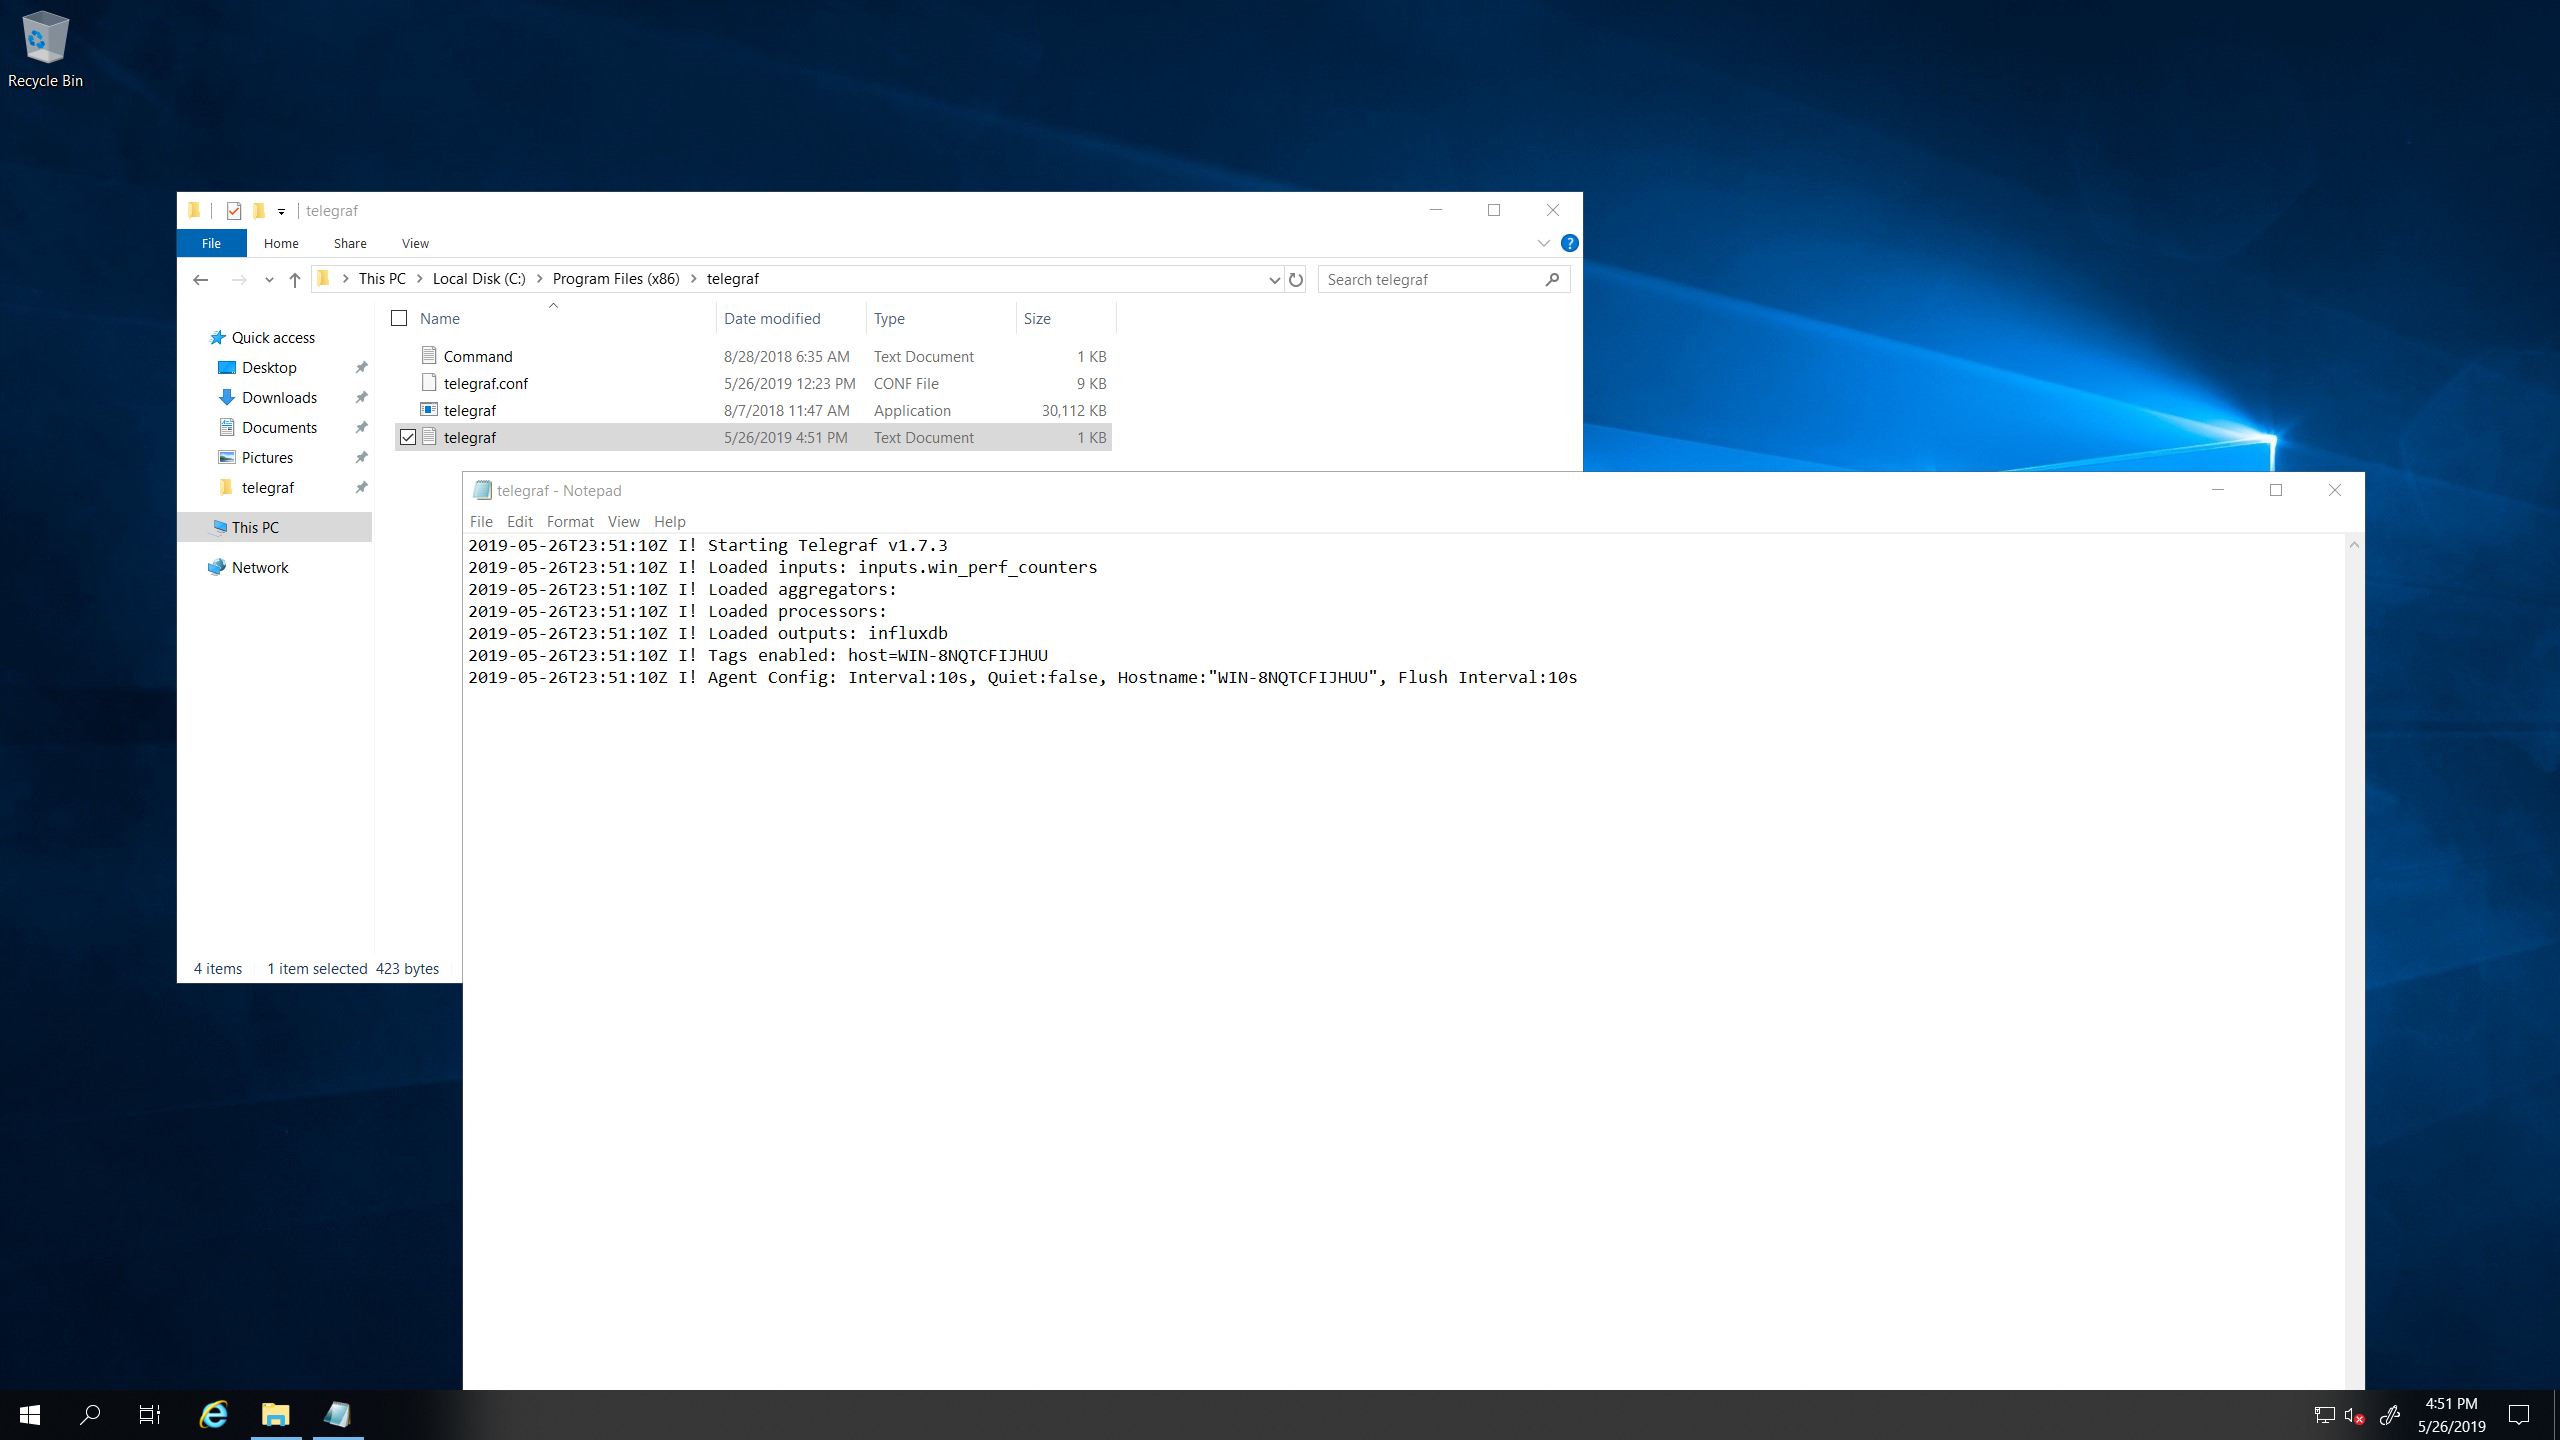
Now that telegraf has started we also now have a nifty log file generated in the telegraf directory. This is handy incase and problems show up.
Now that the telegraf agent is running on our server lets add some panels to grafana and get to graphing!!
First lets pull our browser backup and add a panel.
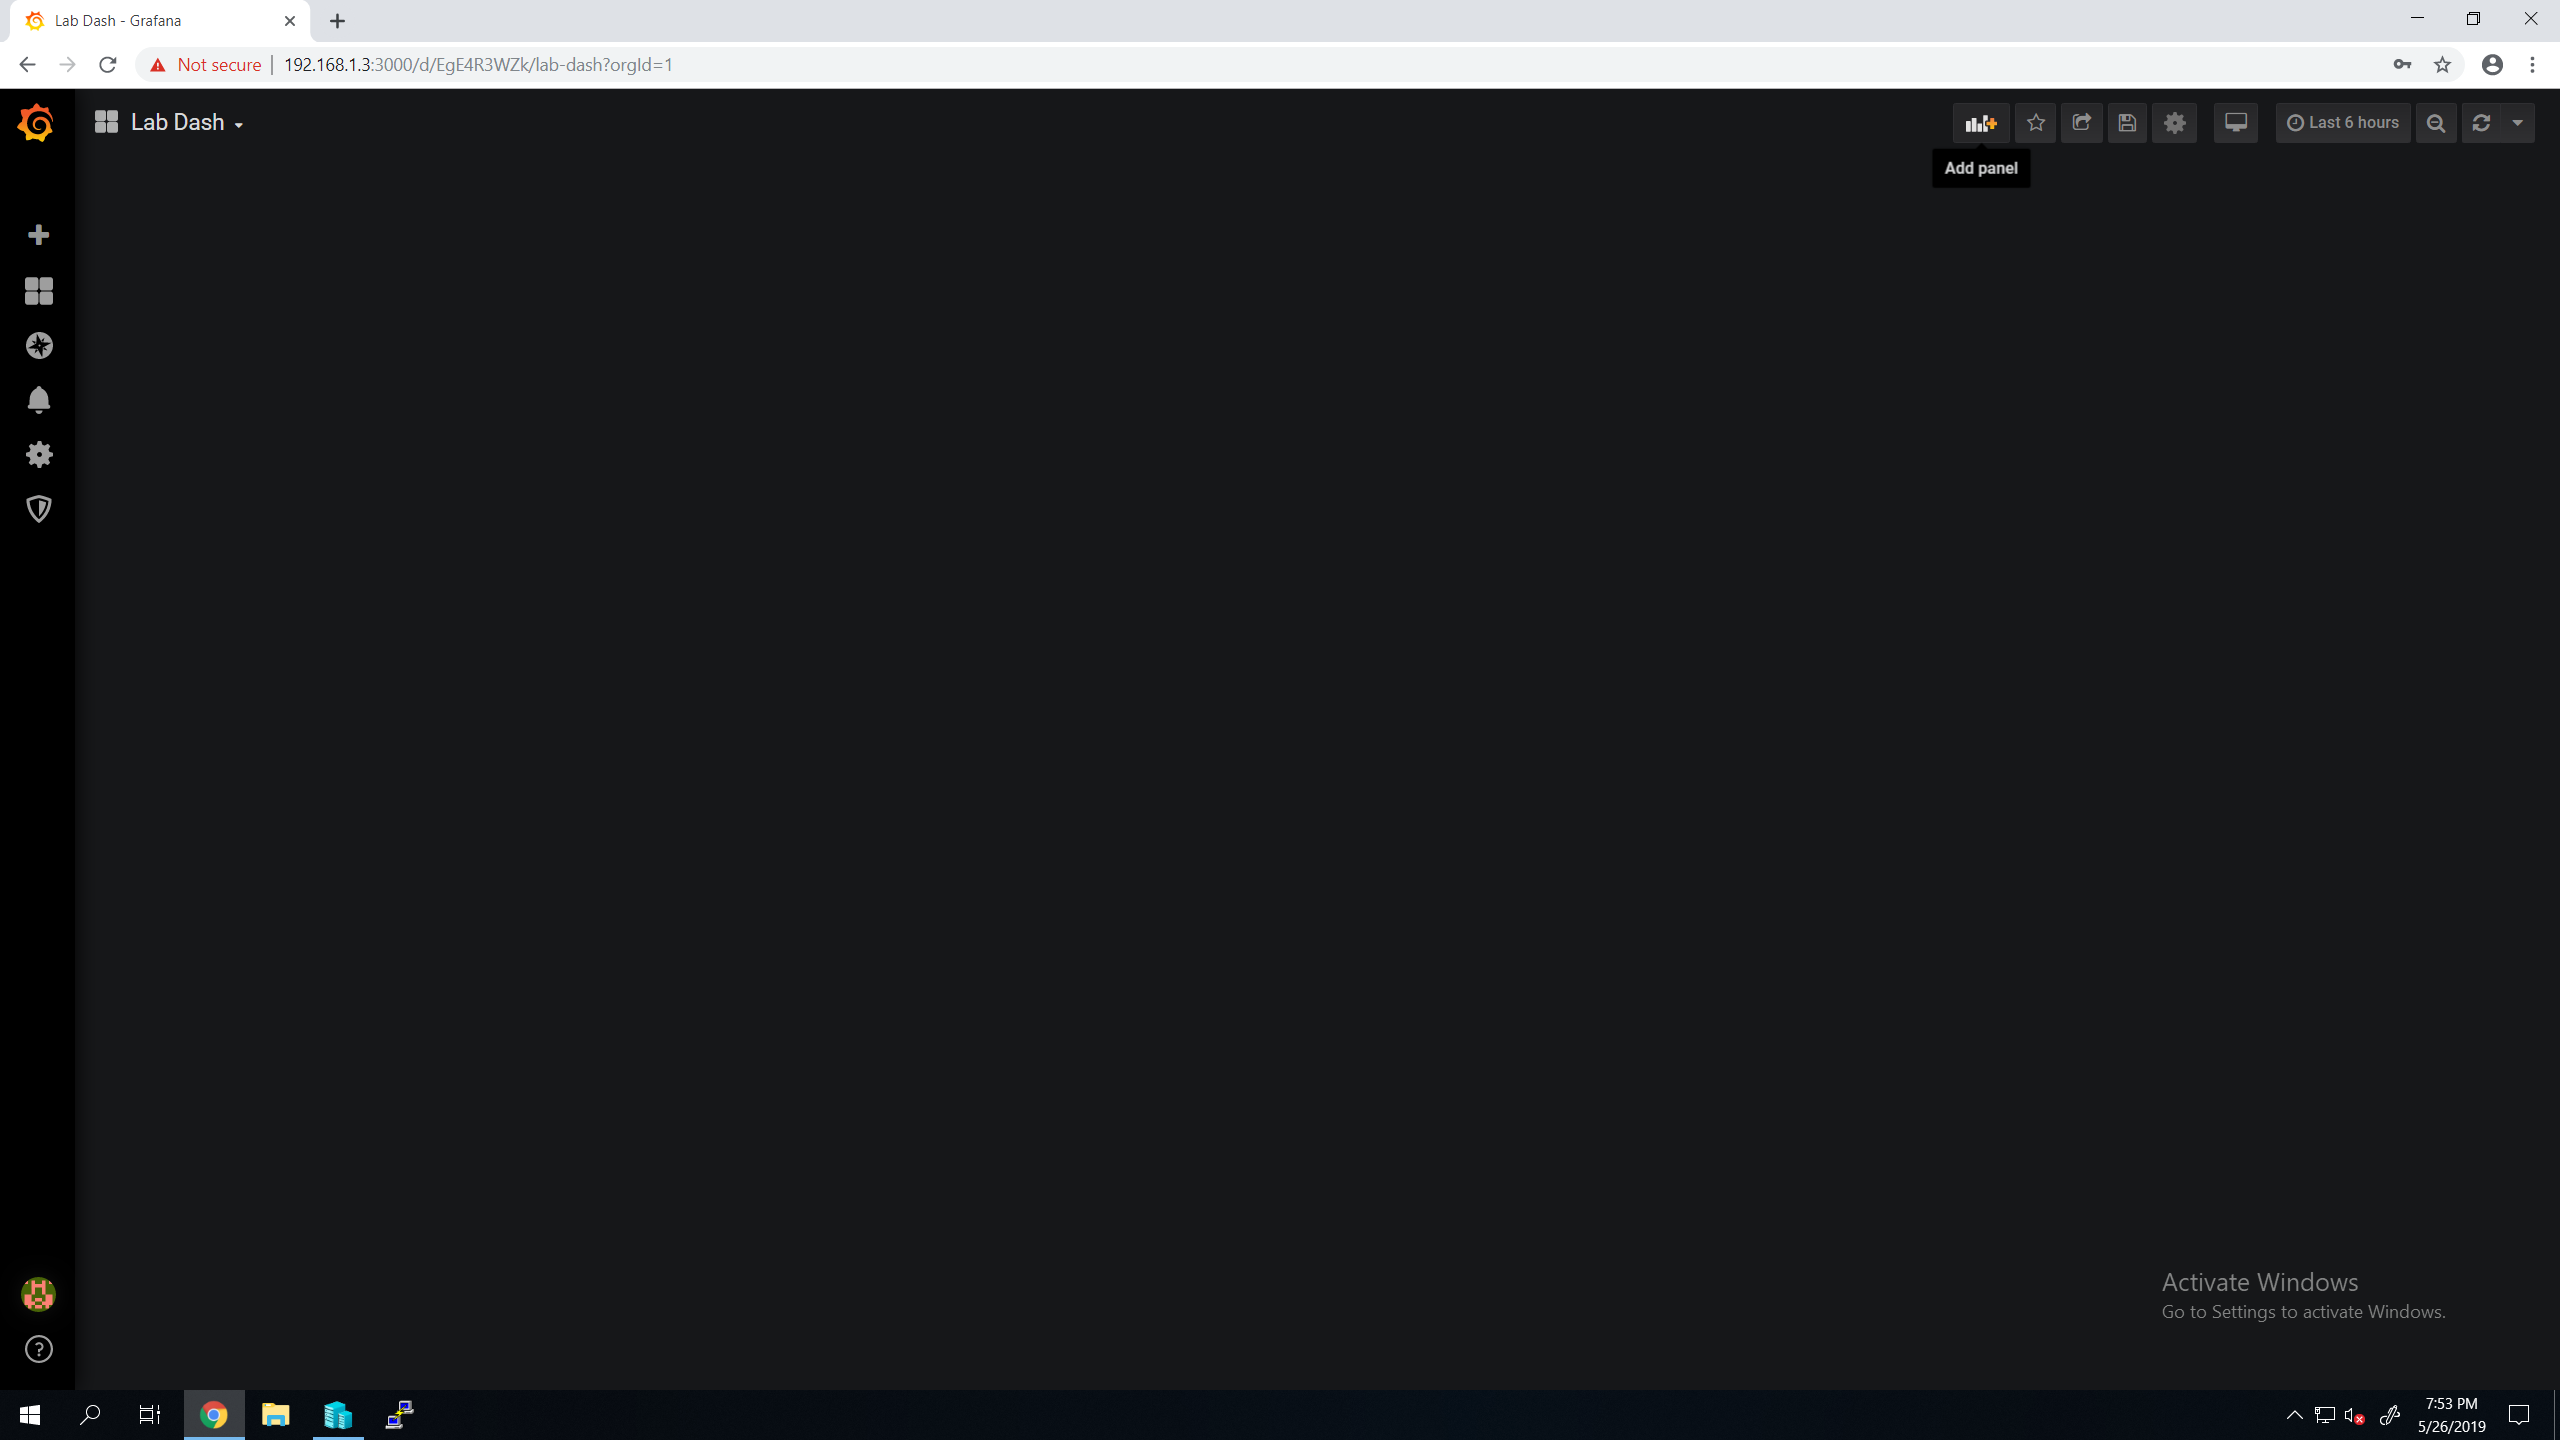
Next select "Add Query"
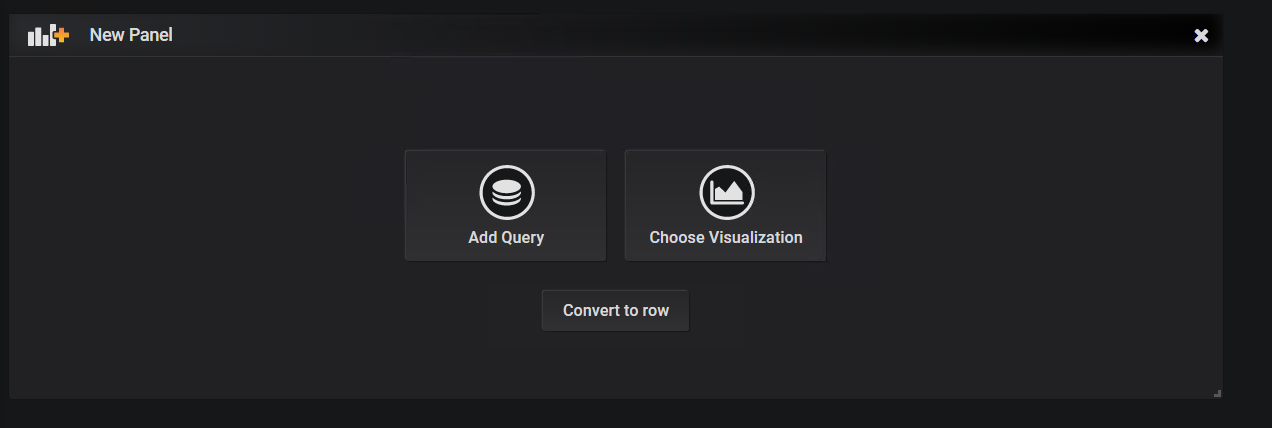
woot! From here we can configure grafana to get certain kinds of data from influx for us. Now this is a little more difficult because data typing is not my strong suite. You can do some really powerful stuff though, and like above you can even copy templates to get close to what you want. Lets start with something like a simple CPU counter.
Make sure to select the database you want to talk to at the top of the query window. In my case "File Server" from here we can plug in the fields we need to get CPU stats. Don't worry it gives you a basic config to build off of, but below I have the finished product.

Yay! we are getting blips on our graph! but graphs aren't a good way to display this....Lets turn it into a gauge! Click on the "Visualization" button on the left hand menu for the panel.
A few seconds later and a drop down or two and we are now getting the Current value of the CPU between a percent of 0-100 and color change threshholds at 50 and 80% and of course we enabled the gauge.
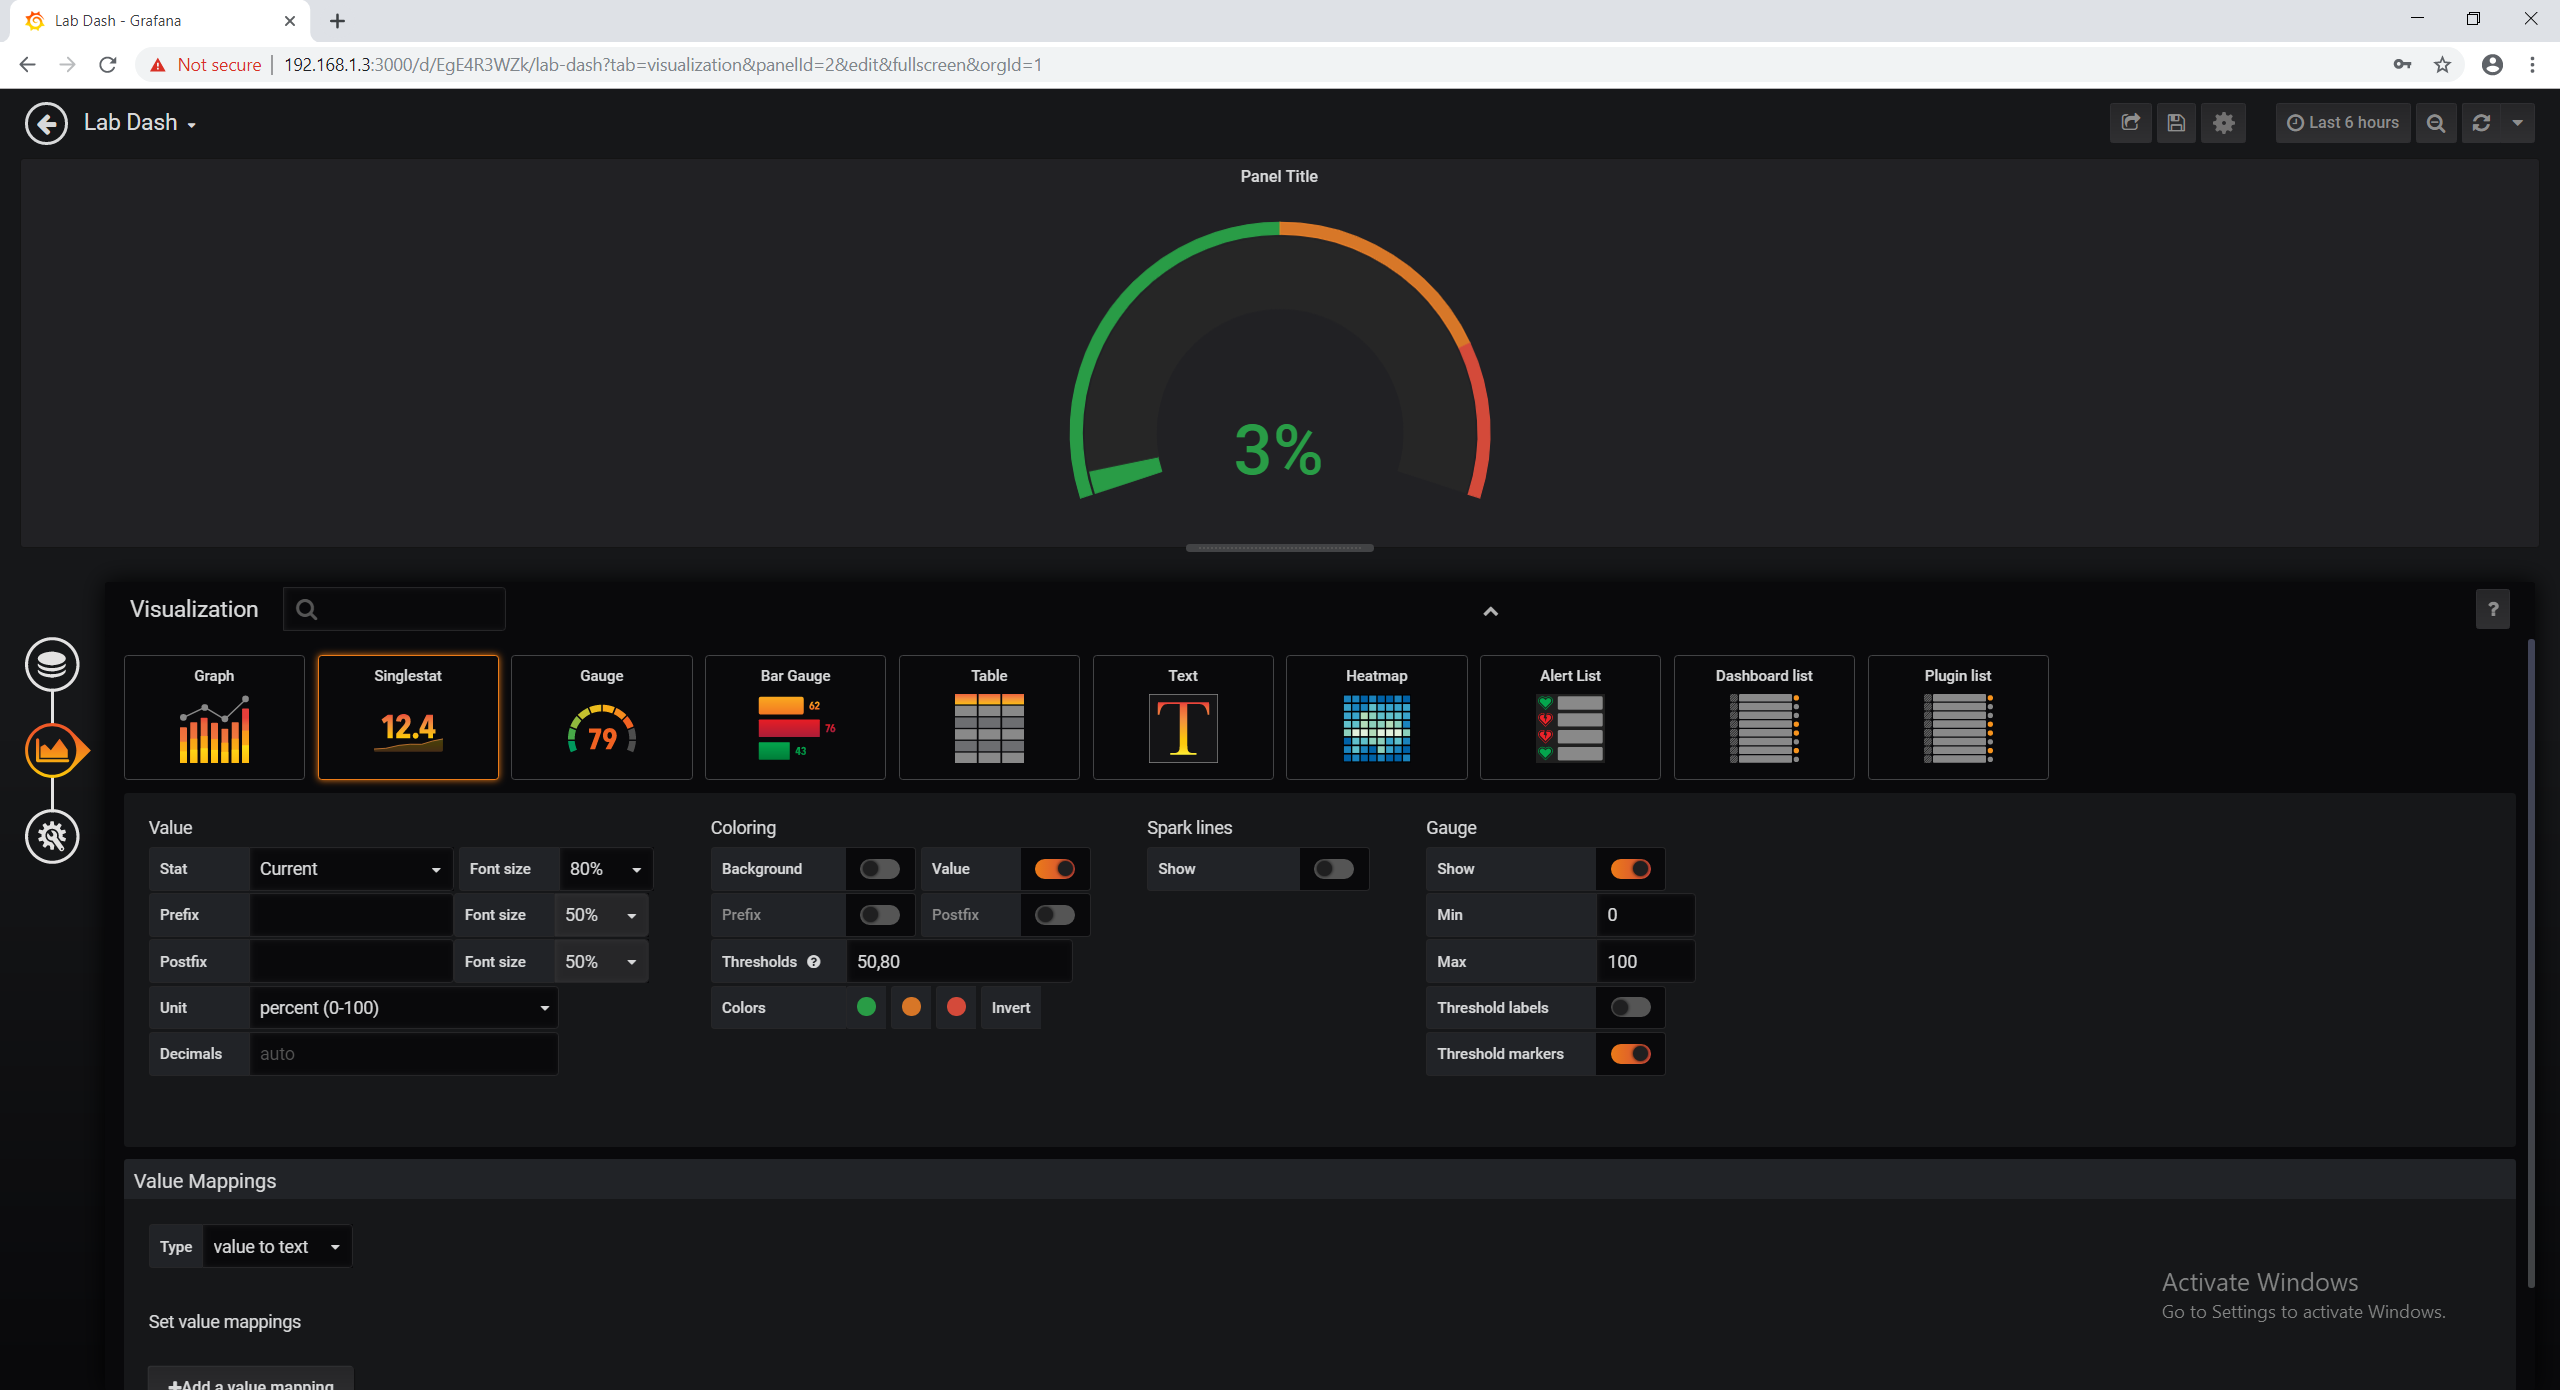
Nice! Hit save at the top right and lets do other cool stuff.
This time, real quick lets get the disk R/W information!
For this we are going to want to hit the "Add Query" button after configuring our first settings. This will add another copy of the settings so we can display two types of data on the same graph! Cool right?
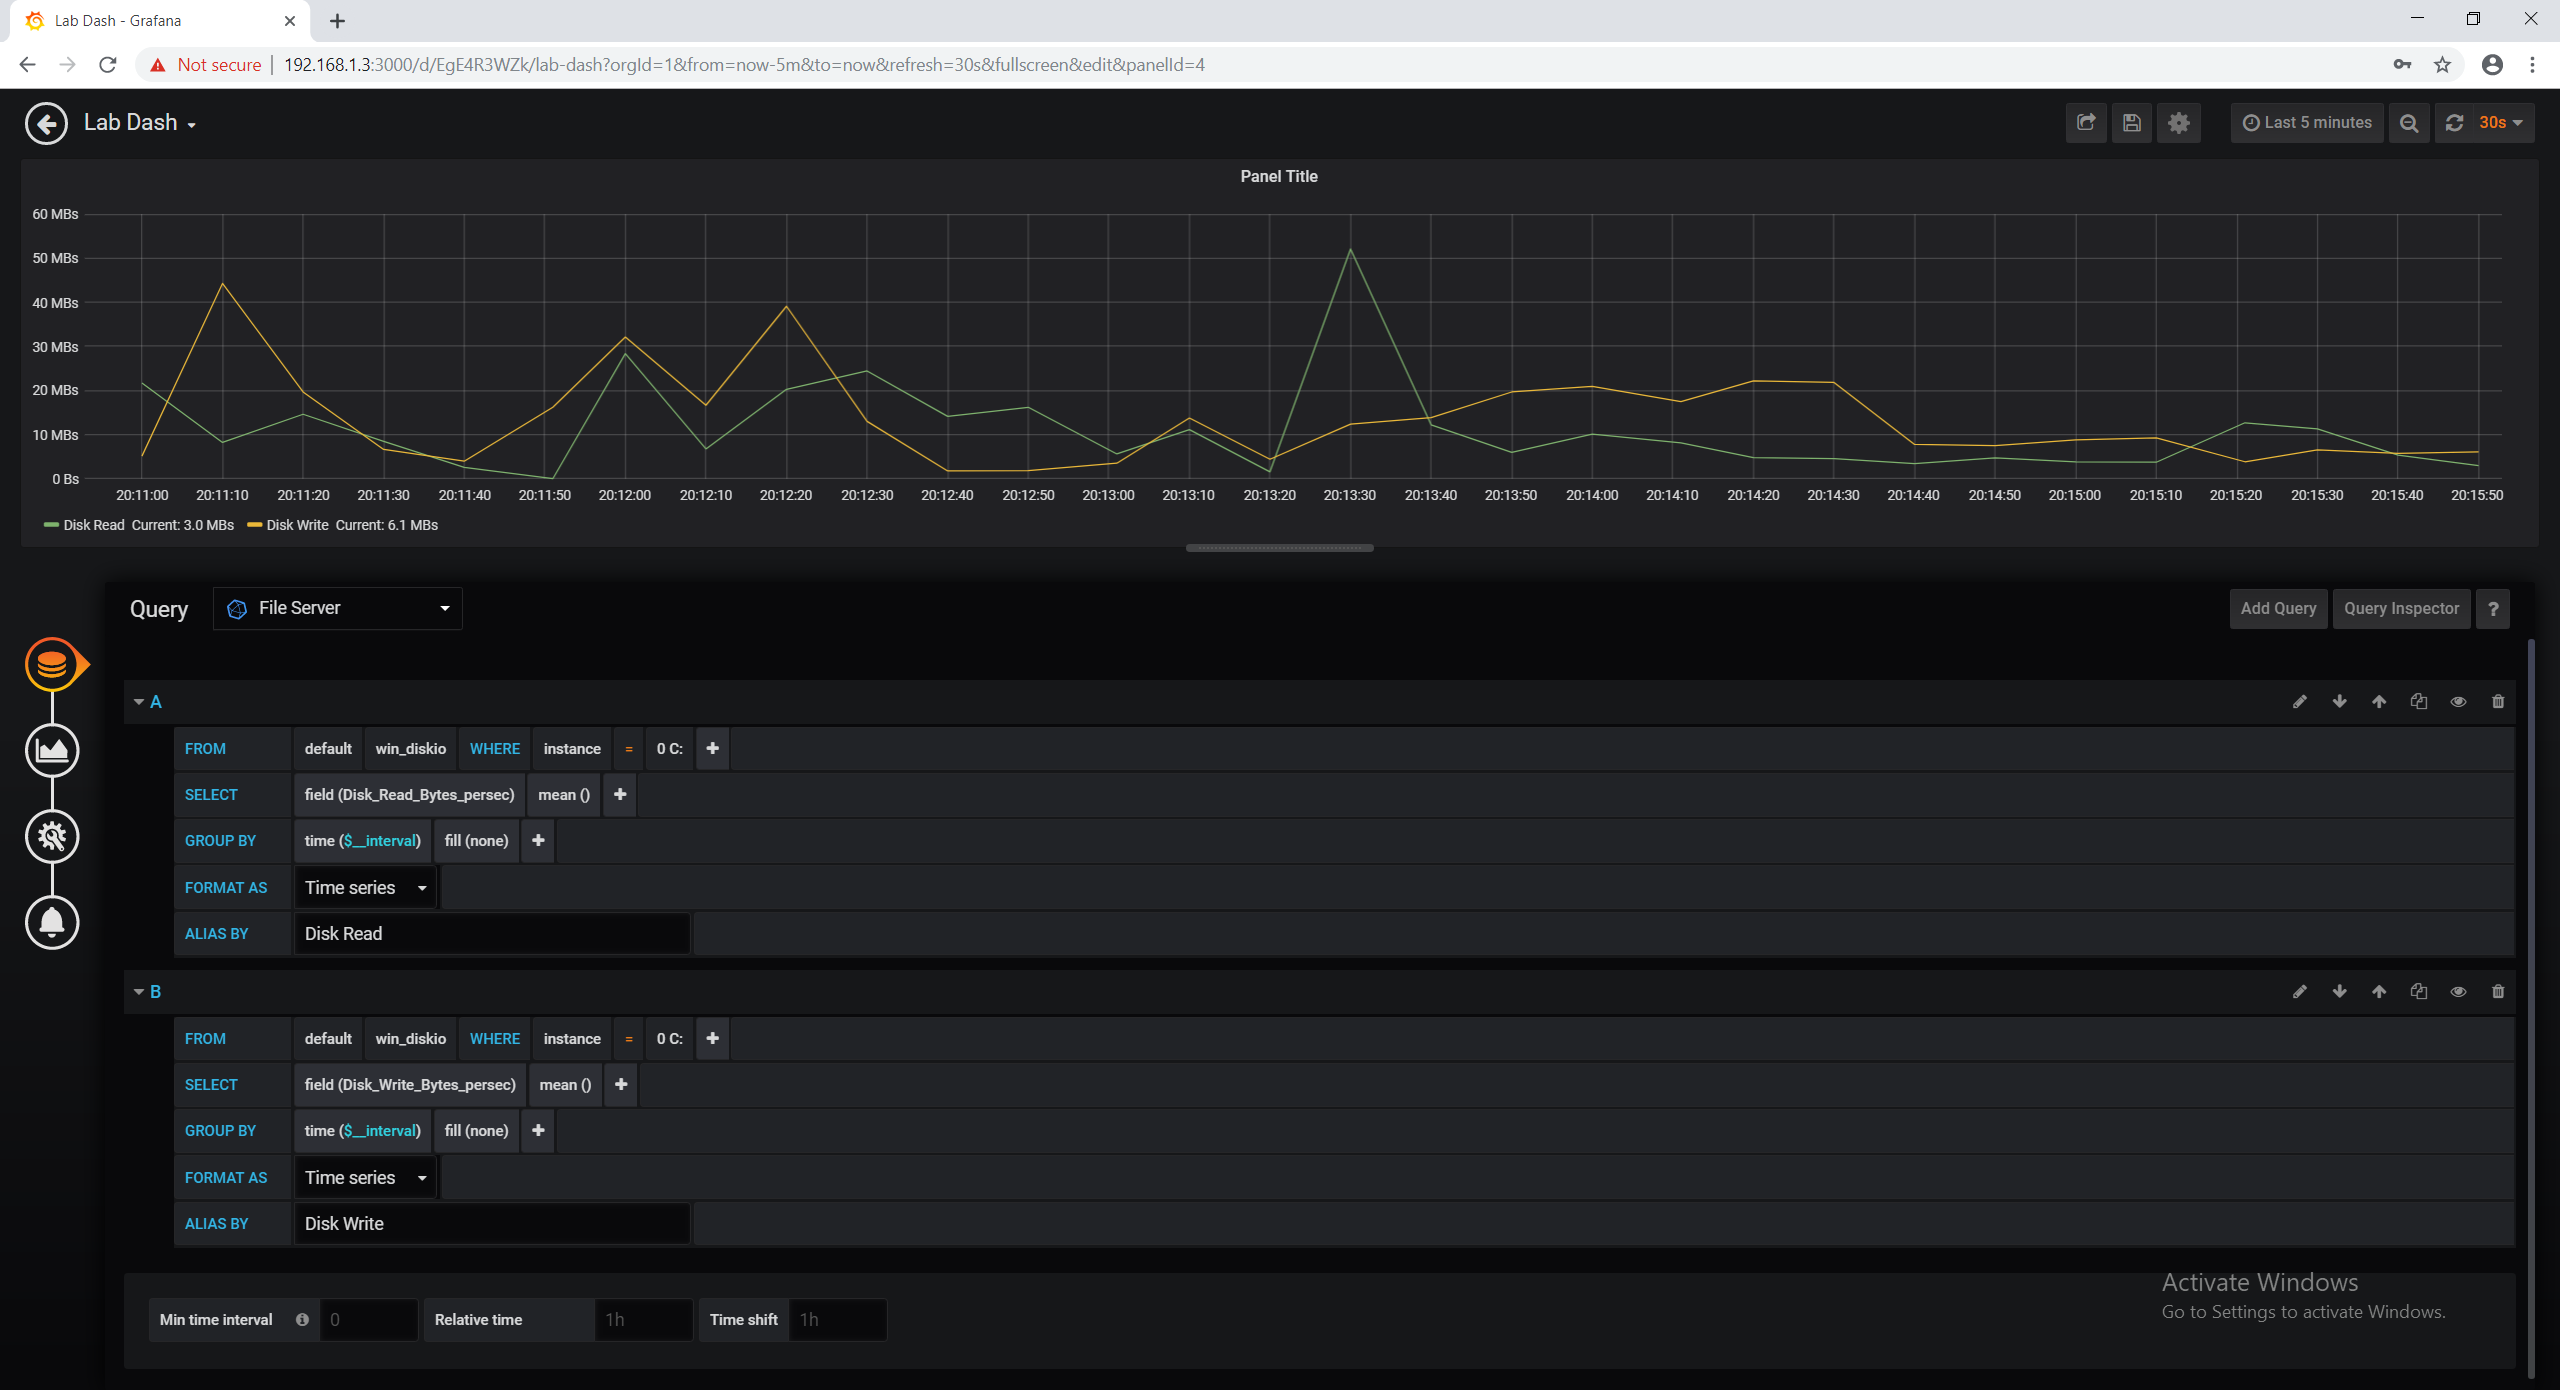
Hm, this seems pretty cool but the axes aren't right at all. Lets change the scale into something I actually understand.
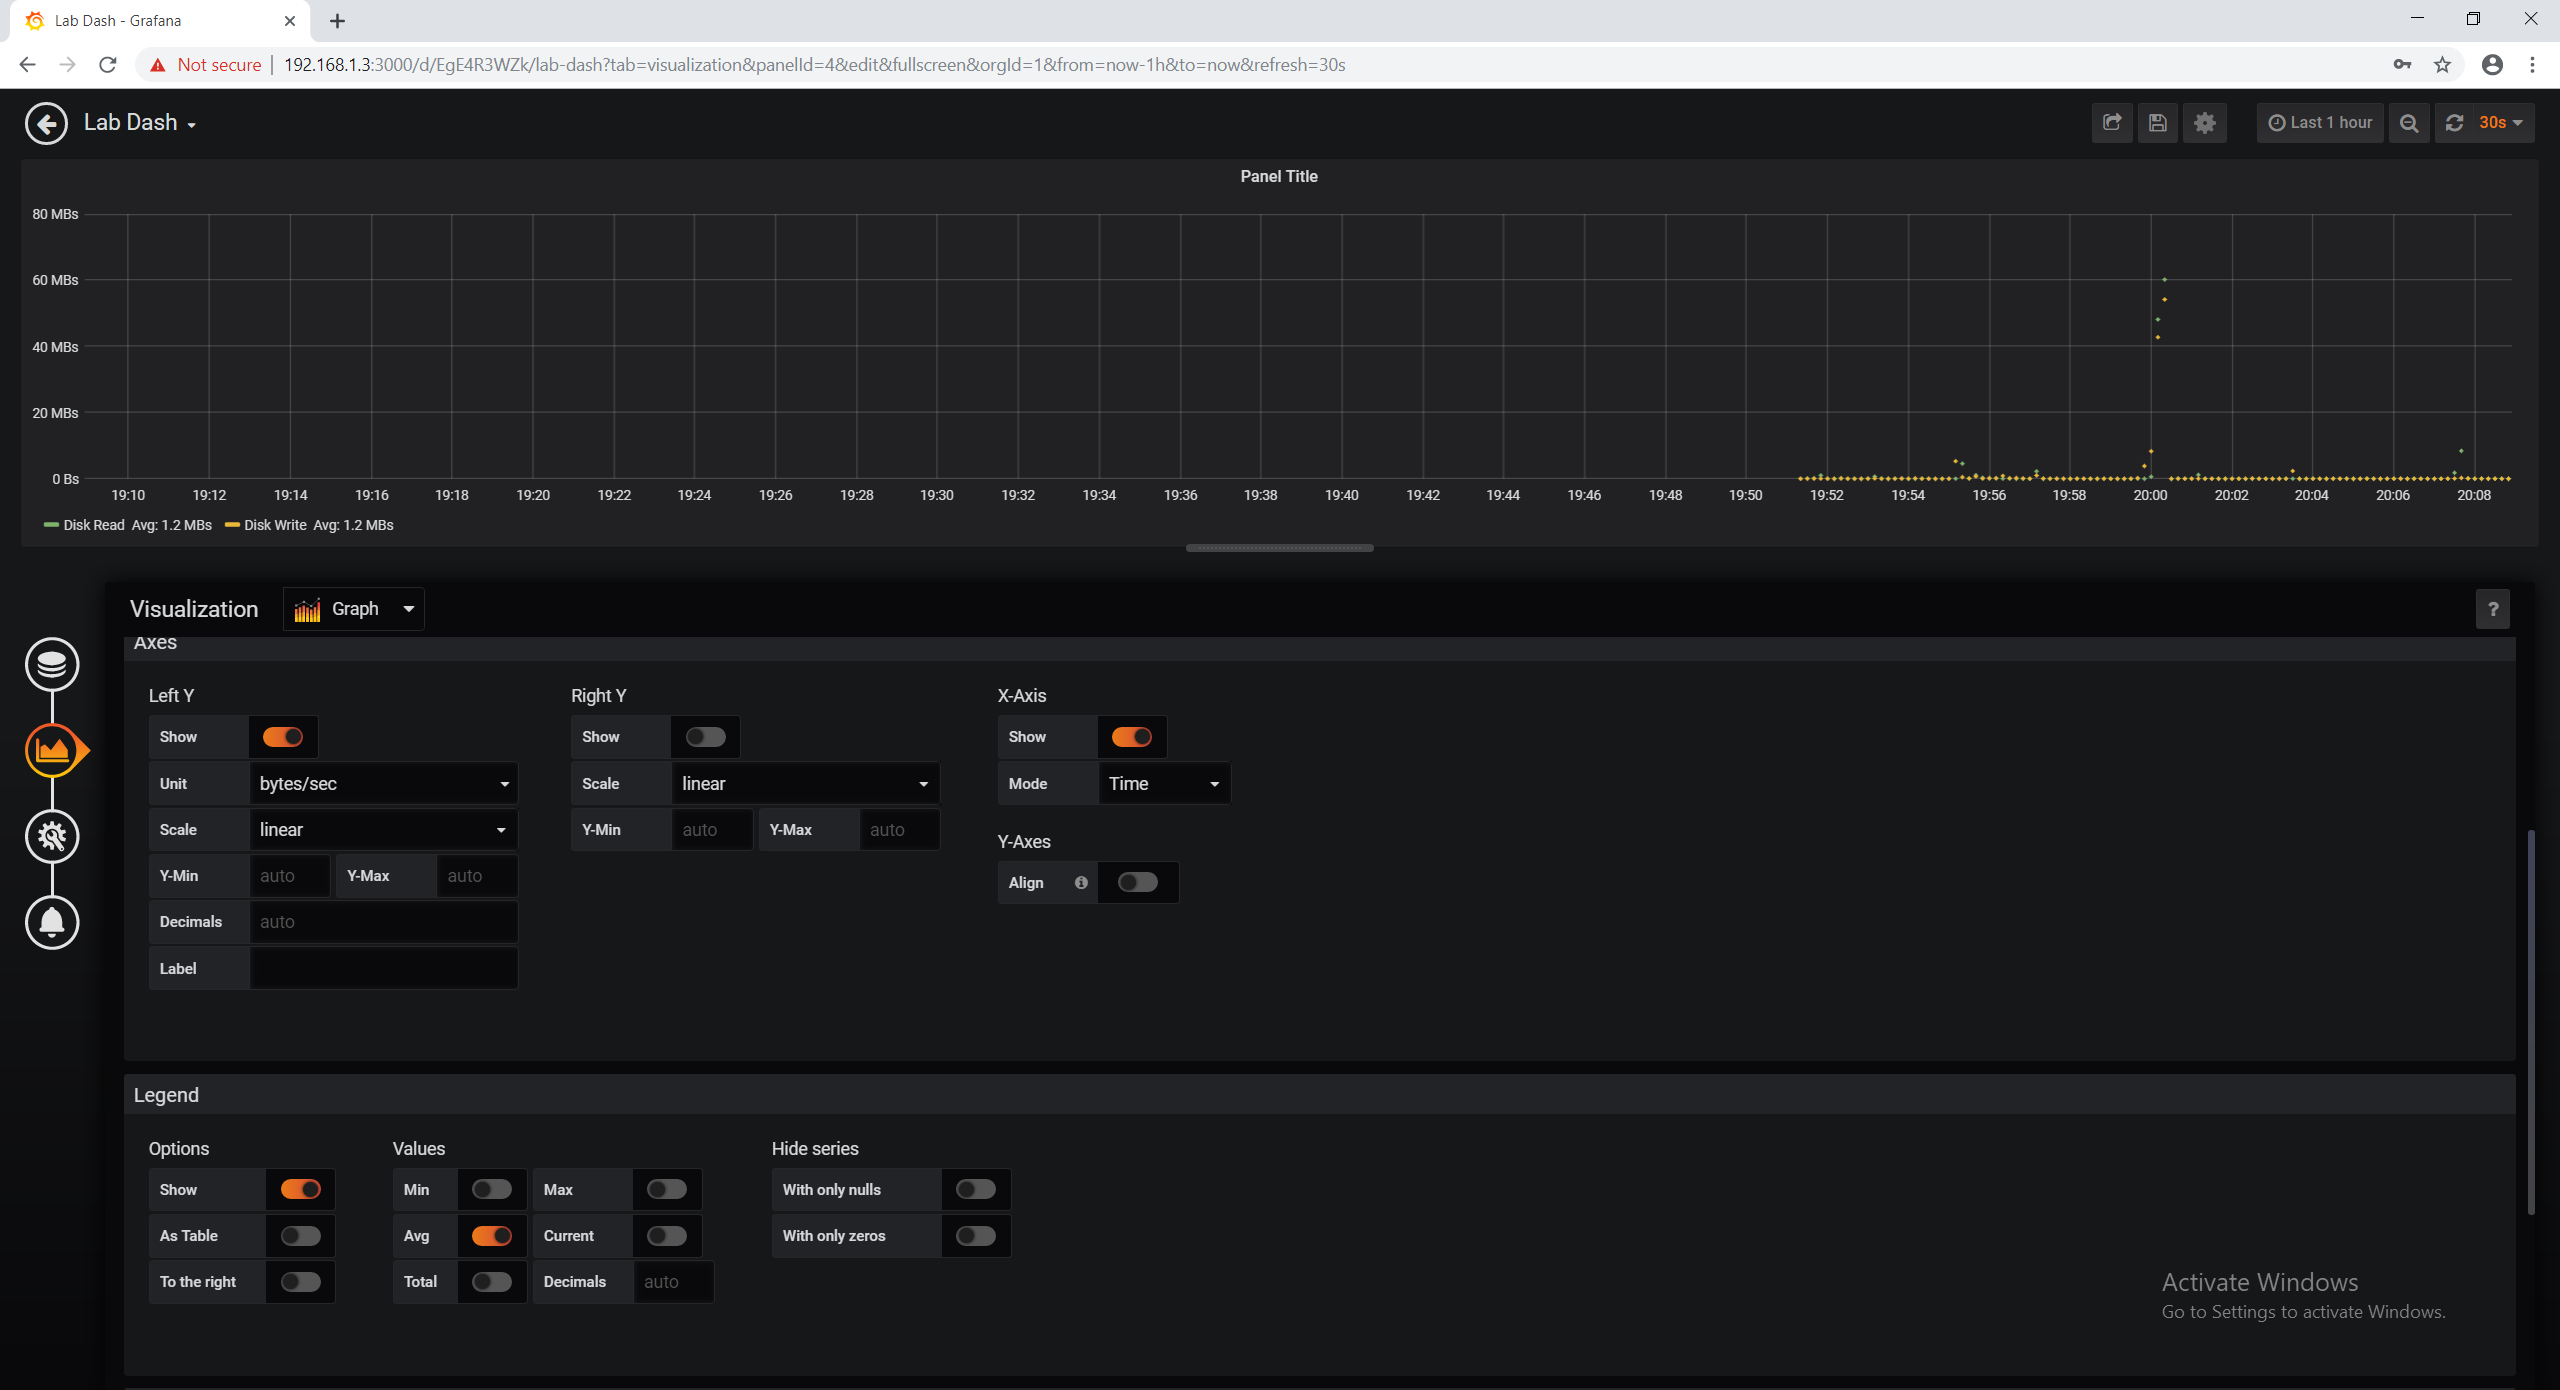
Sweet, switching it to bytes/sec helped make it MB/s which I understand much much better.
Now lets do some Windows upodates and watch our graphing do stuff!
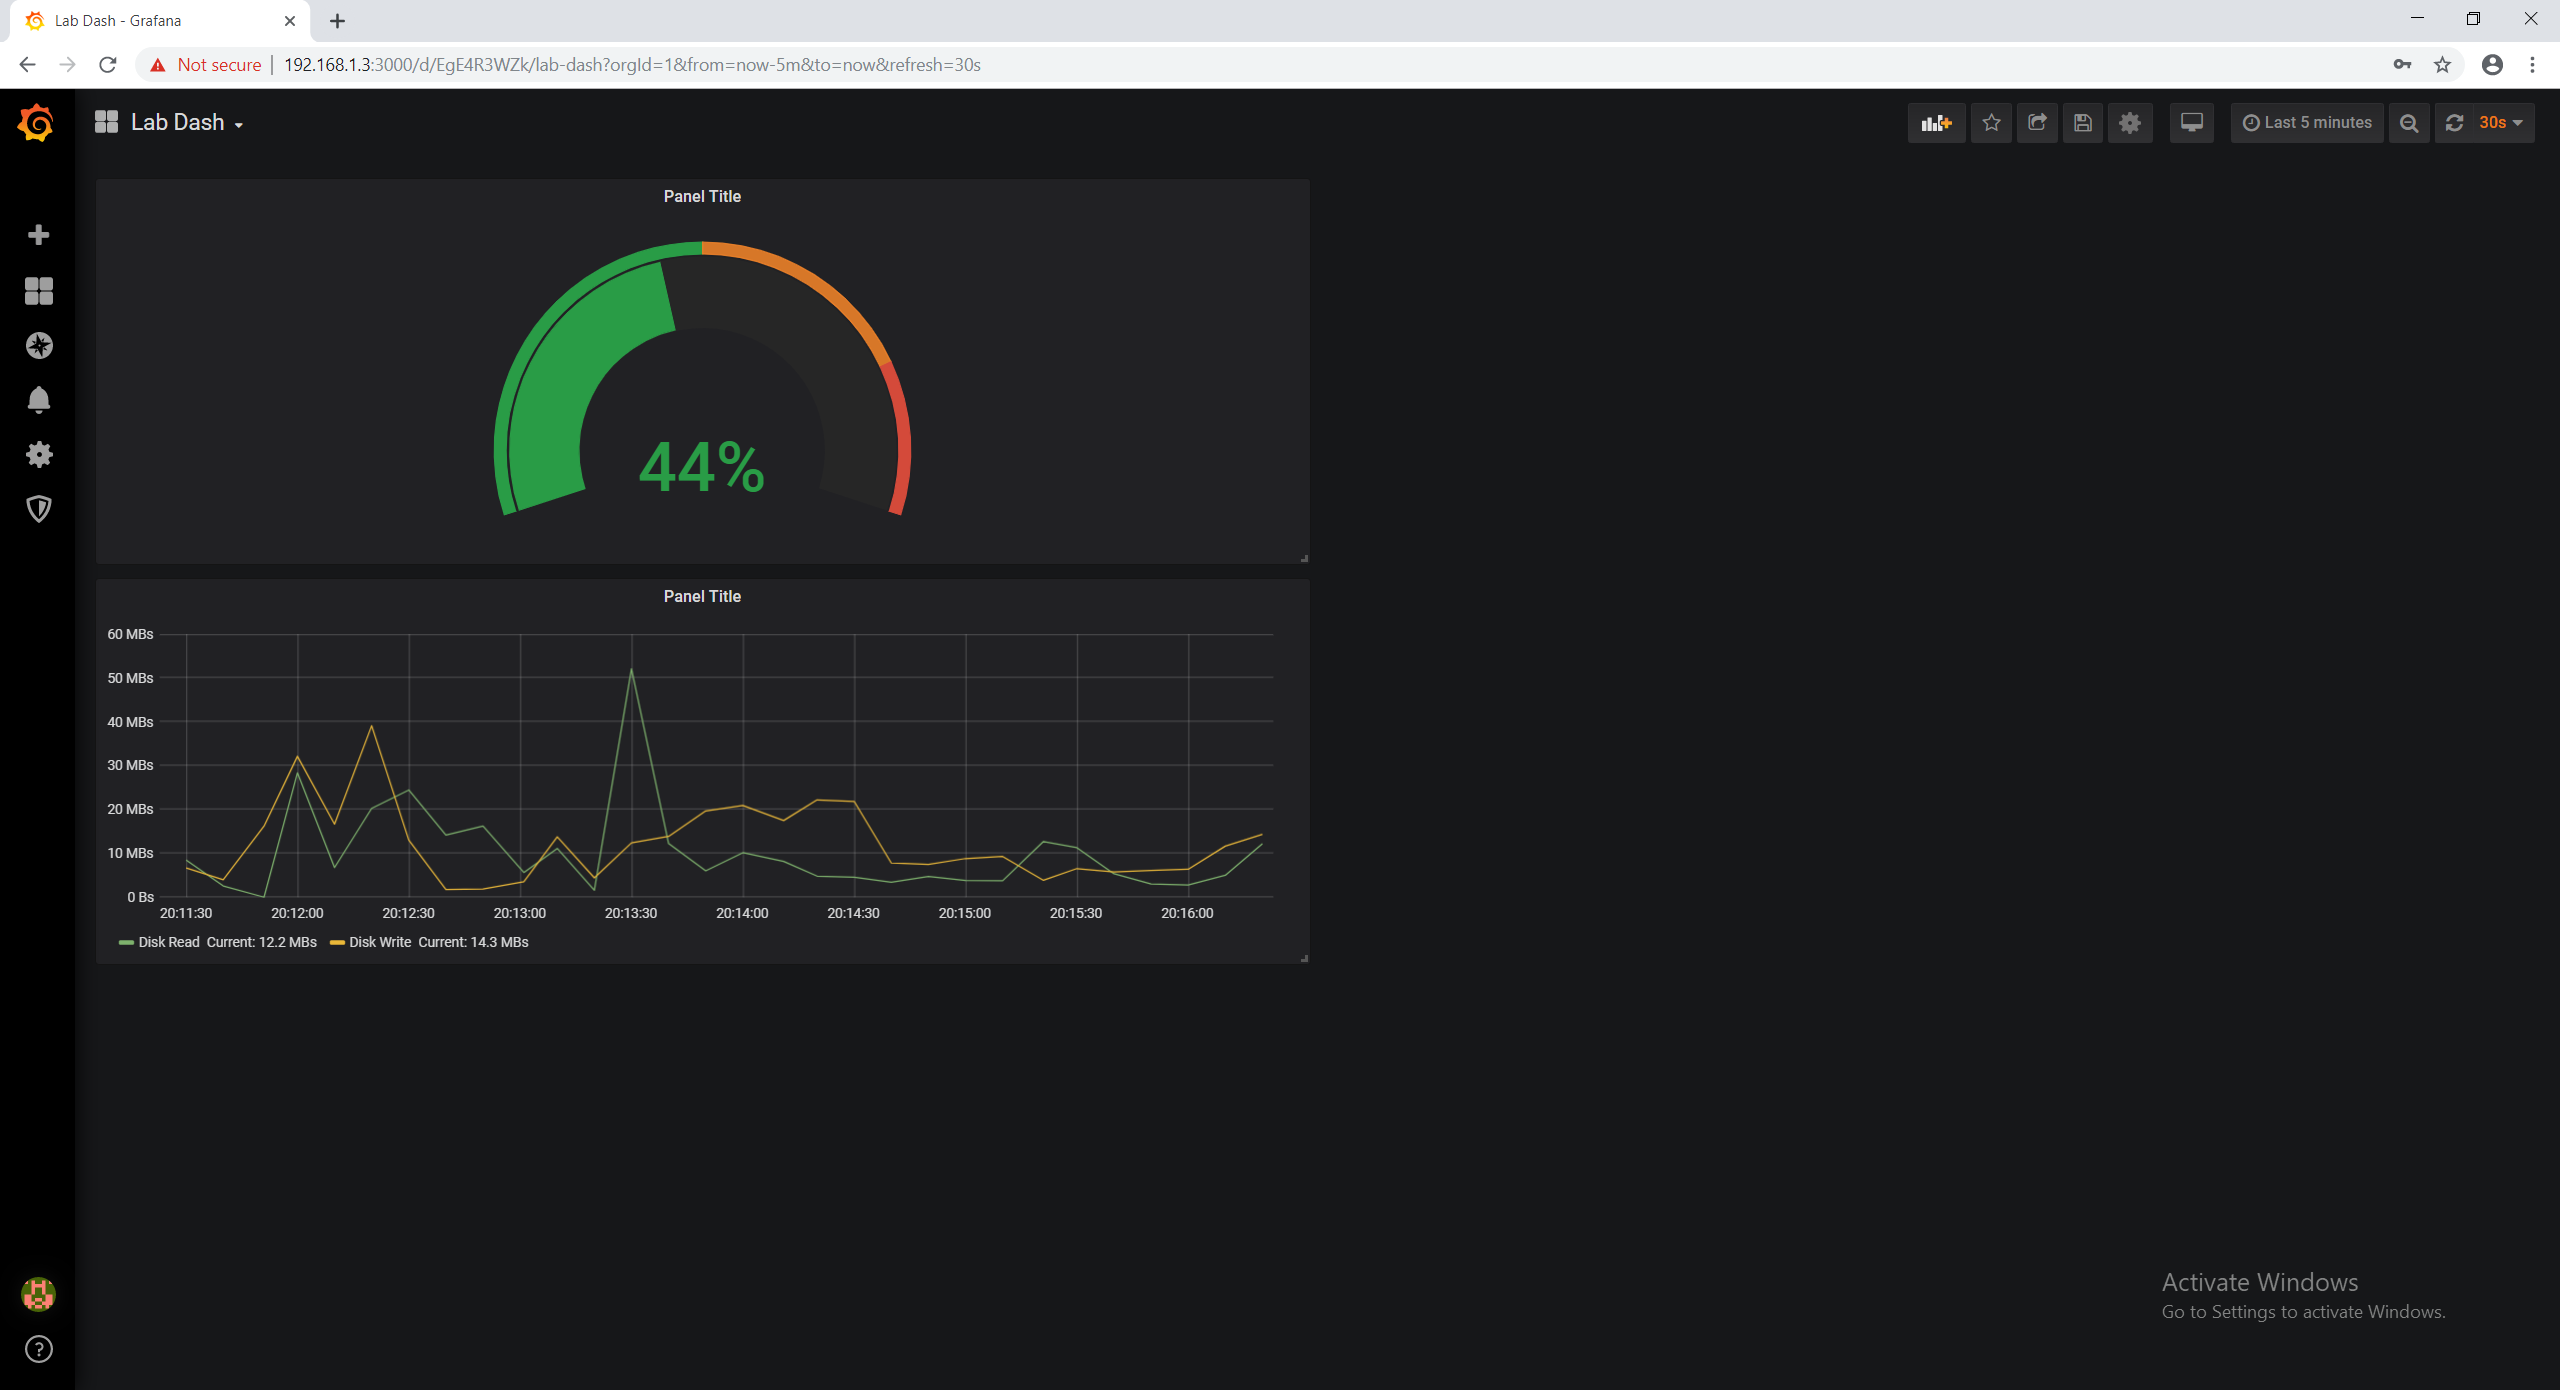
Sweet!
Thats all folks. I hope you enjoyed this guide and understood it was not supposed to be a deep dive, but a brief introduction to system setup. This guide and the infrastructure and settings within can easily handle multiple servers settings and data points. Its upto you to explore and discover things you want to monitor and how you want it displayed to you visually.
I do NOT
Represent any specific company
Stand by any specific product
or
Represent Techpowerup as staff or otherwise
in any official capacity when I post guides. I am doing this because I'm a nerd that thinks you may benefit from the information.
Introduction
In my real job and in my home lab I deal with the TIG stack everyday. So lets first talk a little about what it is and what it does for your lab, or your infrastructure. The TIG stack is:
- Telegraf (The agent that collects the data)
- InfluxDB (The database that contains the data given by telegraf)
- Grafana (The webUI that makes all the data in Influx pretty)
The possibilities are nearly endless with this kind of graphing and information gathering. Some people like myself monitor things from hardware CPU/Disk usage, to services or uptime. Others utilize it to harness the readouts from home automation, such as KWh draw or temperature. So how do we do it? Thankfully the world is our oyster and the stack itself is easy to setup, after that tweak to your hearts content or base your work off of anothers template.
Lets get started!
To get started our environment example will have a vanilla ubuntu 18.04 server install and a vanilla Server 2019 Standard install. You can test environments like this if you have Windows Pro or higher by installing the Hyper-V feature.
TIP: Make sure your grafana server has a static IP address!
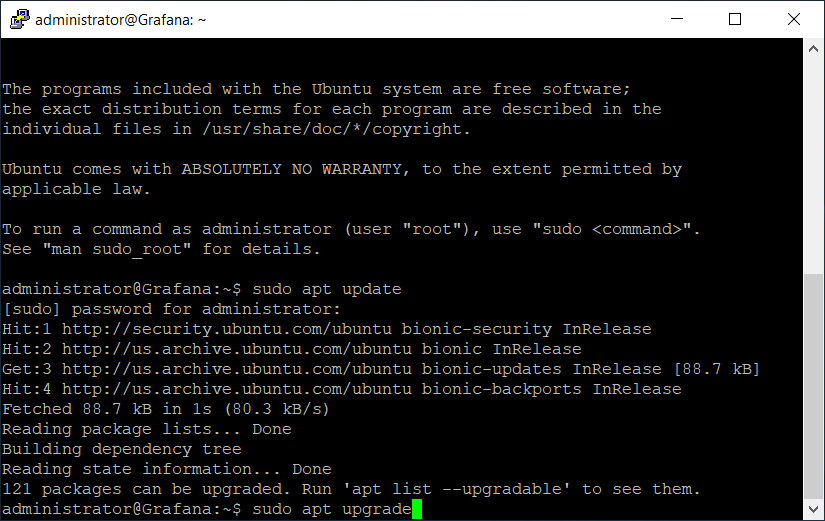
Lets login to our ubuntu server and make sure it is updated!
Code:
sudo apt updateNow lets install them.
Code:
sudo apt upgradeInfluxDB
Now that we are all patched up lets get cooking! First things first, lets do the databases first. You see we don't have anything for the agent to talk to, and we don't have anything for grafana to take info from. So starting in the middle seems like a great idea.
Now all of the new installation links will be on the install pages above. We will be using the as of current links for this guide.
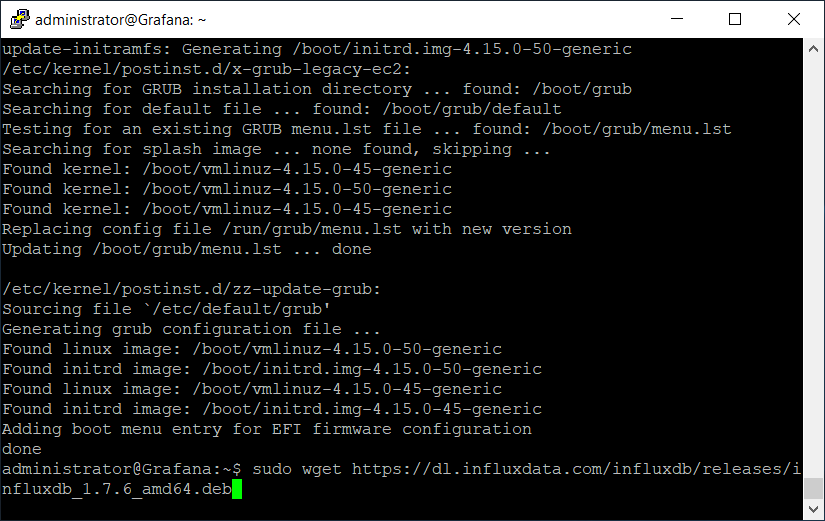
First things first, we need to download the installer package. Dont forget to 'sudo'!
Code:
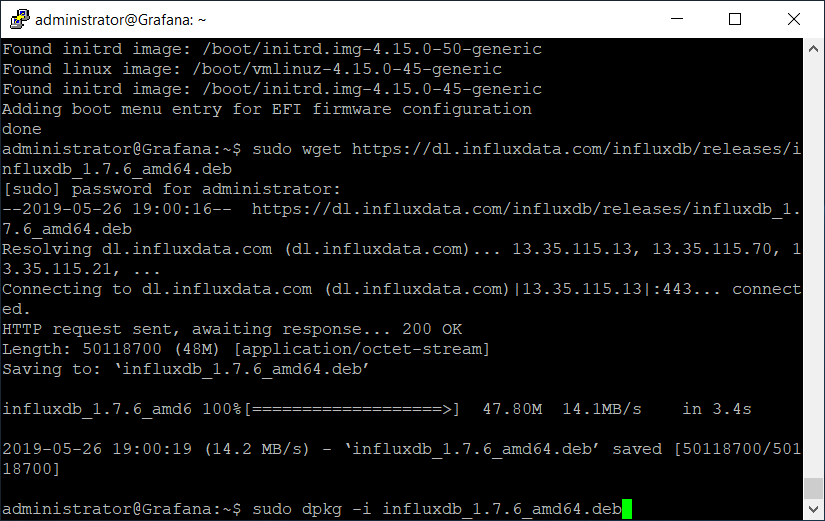
sudo wget https://dl.influxdata.com/influxdb/releases/influxdb_1.7.6_amd64.debNow we install it! for this dpkg.
Code:
sudo dpkg -i influxdb_1.7.6_amd64.debNow we just installed something new, so we need to make sure its running. Lets go ahead and start the process.
Code:
sudo service influxdb startCool beans! So we downloaded it, and we installed it, but its not going to work without a database right? right. So first lets talk to influx so we can interface with it. At the prompt just type.
Code:
influxWe want to create a database for our file server. Lets make one with a simple name. Thankfully influx commands are pretty straight forward.
Code:
CREATE DATABASE filesrvWe just made a database called "filesrv" lets make sure we did it right and make sur it exists, maybe you can guess what we will type.
Code:
SHOW DATABASESI know, earth shatteringly complex commands.
now just exit out of the influx command line with a simple;
Code:
exitGrafana
Cool so now that we have influx installed lets move on to Grafana.
Super simple process just like before. I'm sure if your following the guide that may have taken you several minutes, but I bet if you asked yourself if you could do it again you could do it in less than 3.
To start lets download the installer.
Code:
sudo wget https://dl.grafana.com/oss/release/grafana_6.2.0_amd64.debNow a little hint, grafana requires a font library to properly display things. If we just installed grafana now ubuntu would get mad. So lets install that library real quick.
Code:
sudo apt-get install -y adduser libfontconfig1There all better, now lets get to the meaty part and install grafana.
Code:
sudo dpkg -i grafana_6.2.0_amd64.debAlright! Now just like influx lets start it up!
Code:
sudo service grafana-server startWew all done! As I'm sure you noticed at like 90mb these two pieces of software are totally brutal on your machine so I imagine it took you hours to download them.
 Moving on. Lets take a peak at your grafana home page. By default the port is 3000. In my case it is
192.168.1.3:3000
Now the degault USN and pass for grafana is
Code:
User: admin
Password: admin
Feel free to change it.
Next we will Add a data source. This basically means we are going to pick the DB we want to use. As I am sure you have noticed via the first start menu Grafana makes this dumb easy, so forgive me if I think I haven't lost you yet.
In our case we are going to pick "InfluxDB" because well if you don't know by now this guide may be a little out of your tech scope.
Now we configure grafana to talk to our database, don't worry this isnt scary and its pretty simple. Name the "Data Source" whatever you want as long as you understand it. Next In the URL field just double click (in case your browser understands autofill) and select the default option of
Code:
http://localhost:8086Next we type the database name as we named it in Influx. Lastly, we enter the user name and password for grafana.
Now go ahead and click "Save & Test" This should start a quick self test that will let you know all is well and grafana can talk to the databse.
Yay all good! Now lets go "Home" by clicking the grid in the left hand menu and selecting home. Now we can make our first dashboard.
Once we click "New dashboard" we can immediately add data to it. We don't have any data right now so I just usually rename the dashboard at this point. Click the gear at the top right.
From here we can change the name and a few other options of the dash itself. Don't forget to save!
Now we have a blank dash with nothing going on!
Lets fix this and install telegraf.
Telegraf
Telegraf has alot of options for both Windows and *nix systems alike, but don't worry for this we will stick with the basics. (I also included the conf I use and the command to install it.) We need to edit 3 lines in the telegraf.conf file so that we can start getting data.
- The logfile location
- The IP of our database server
- The database name in Influx we want to send data too
Boot up your windows machine here we go!
In our case notice we did
Code:
logfile = "/Program Files (x86)/Telegraf/telegraf.log"This is because we are going to make a telegraf directory with all of our files in the program files folder. This keeps it out of the way and in a place most people would look when troubleshooting.
Now that things are copied over and ready to go lets open CMD as admin and copy the directory path of our telegraf directory. In this case again.
Code:
C:\Program Files (x86)\telegrafNow lets type the following into CMD to navigate it to that folder.
Code:
cd C:\Program Files (x86)\telegrafyay, now lets run the command to install telegraf as a service AND use the configuration file sitting in the directory with it.
Code:
telegraf --service install --config "C:\Program Files (x86)\Telegraf\telegraf.conf"No errors! Last but not least lets open up the services tab in task manager and like influx and grafana start her up!
Now that telegraf has started we also now have a nifty log file generated in the telegraf directory. This is handy incase and problems show up.
Now that the telegraf agent is running on our server lets add some panels to grafana and get to graphing!!
First lets pull our browser backup and add a panel.
Next select "Add Query"
woot! From here we can configure grafana to get certain kinds of data from influx for us. Now this is a little more difficult because data typing is not my strong suite. You can do some really powerful stuff though, and like above you can even copy templates to get close to what you want. Lets start with something like a simple CPU counter.
Make sure to select the database you want to talk to at the top of the query window. In my case "File Server" from here we can plug in the fields we need to get CPU stats. Don't worry it gives you a basic config to build off of, but below I have the finished product.
Yay! we are getting blips on our graph! but graphs aren't a good way to display this....Lets turn it into a gauge! Click on the "Visualization" button on the left hand menu for the panel.
A few seconds later and a drop down or two and we are now getting the Current value of the CPU between a percent of 0-100 and color change threshholds at 50 and 80% and of course we enabled the gauge.
Nice! Hit save at the top right and lets do other cool stuff.
This time, real quick lets get the disk R/W information!
For this we are going to want to hit the "Add Query" button after configuring our first settings. This will add another copy of the settings so we can display two types of data on the same graph! Cool right?
Hm, this seems pretty cool but the axes aren't right at all. Lets change the scale into something I actually understand.
Sweet, switching it to bytes/sec helped make it MB/s which I understand much much better.
Now lets do some Windows upodates and watch our graphing do stuff!
Sweet!
Thats all folks. I hope you enjoyed this guide and understood it was not supposed to be a deep dive, but a brief introduction to system setup. This guide and the infrastructure and settings within can easily handle multiple servers settings and data points. Its upto you to explore and discover things you want to monitor and how you want it displayed to you visually.


