 23
23
Acer Predator GM7 1 TB Review - Impressive Performance
(23 Comments) »Introduction
Acer is a world-leading manufacturer of computer hardware. The company was founded in 1976, in Taiwan and are mostly known for their laptops, desktop PCs, and monitors. BIWIN Storage has been granted an official license by Acer to produce, market and sell solid-state-drives using their name.

With this review we're introducing our new 2023 SSD Test Bench, which comes with upgraded hardware, refined tests and new power consumption measurements. The first SSD that we're testing is the Acer Predator GM7, which is the company's newest cost-efficient drive. It is based on the new Maxiotech MAP1602 controller, paired with 128-layer YMTC TLC NAND flash.
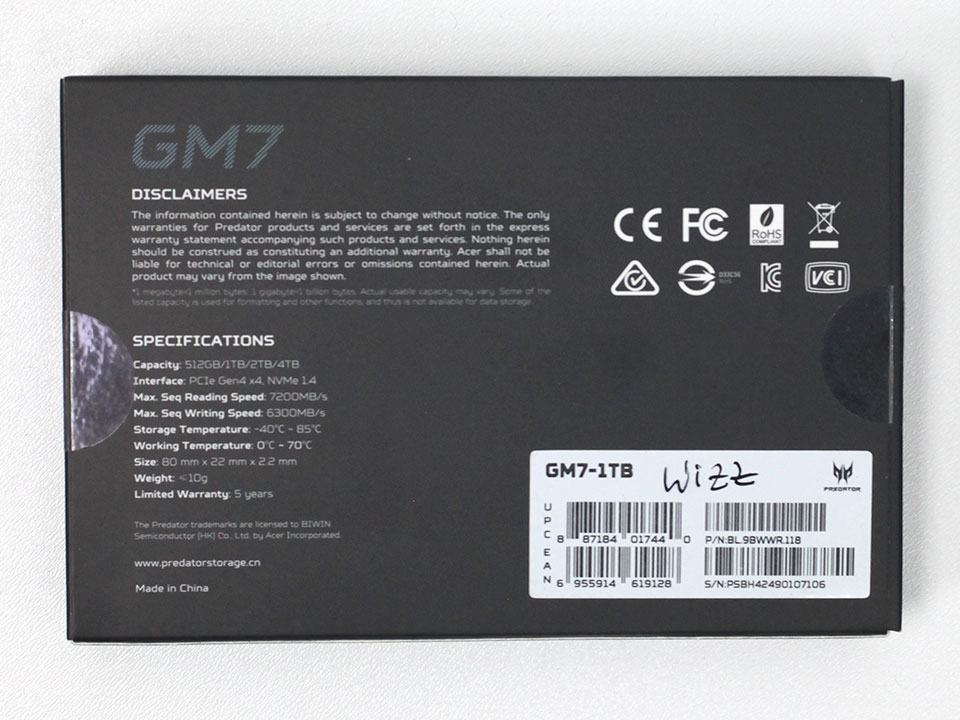
The Acer Predator GM7 is available in capacities of 512 GB GB ($50), 1 TB ($66) and 2 TB ($100). Endurance for these models is set to 300 TBW, 600 TBW and 1200 TBW, respectively. Acer includes a five-year warranty with the GM7.
| Specifications: Acer Predator GM7 1 TB SSD | |
|---|---|
| Brand: | Acer |
| Model: | GM7-1TB / BL.9BWWR.118 |
| Capacity: | 1024 GB (953 GB usable) No additional overprovisioning |
| Controller: | Maxiotech MAP1602A |
| Flash: | YMTC 128-Layer 3D TLC Rebranded as BIWIN BWN09TC1B1RCAD |
| DRAM: | N/A but 32 MB HMB |
| Endurance: | 600 TBW |
| Form Factor: | M.2 2280 |
| Interface: | PCIe Gen 4 x4, NVMe 1.4 |
| Device ID: | Predator SSD GM7 M 2 1TB |
| Firmware: | SN08560 |
| Warranty: | Five years |
| Price at Time of Review: | $66 / $64 per TB |
Packaging

The Drive
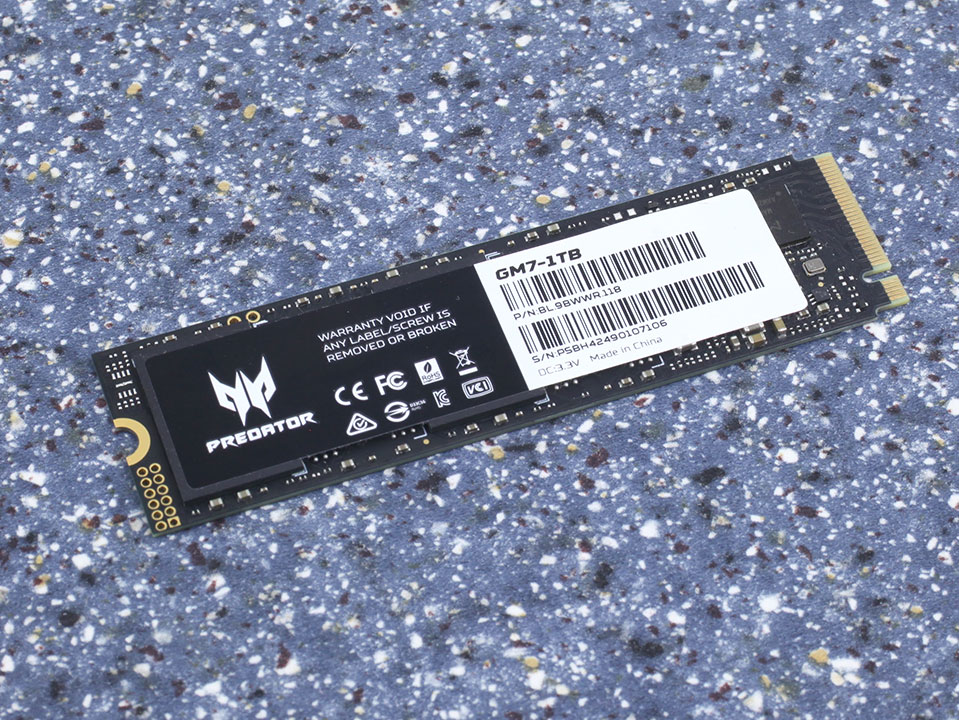
The drive is designed for the M.2 2280 form factor, which makes it 22 mm wide and 80 mm long.
PCI-Express 4.0 x4 is used as the host interface to the rest of the system, which doubles the theoretical bandwidth compared to PCIe 3.0 x4.
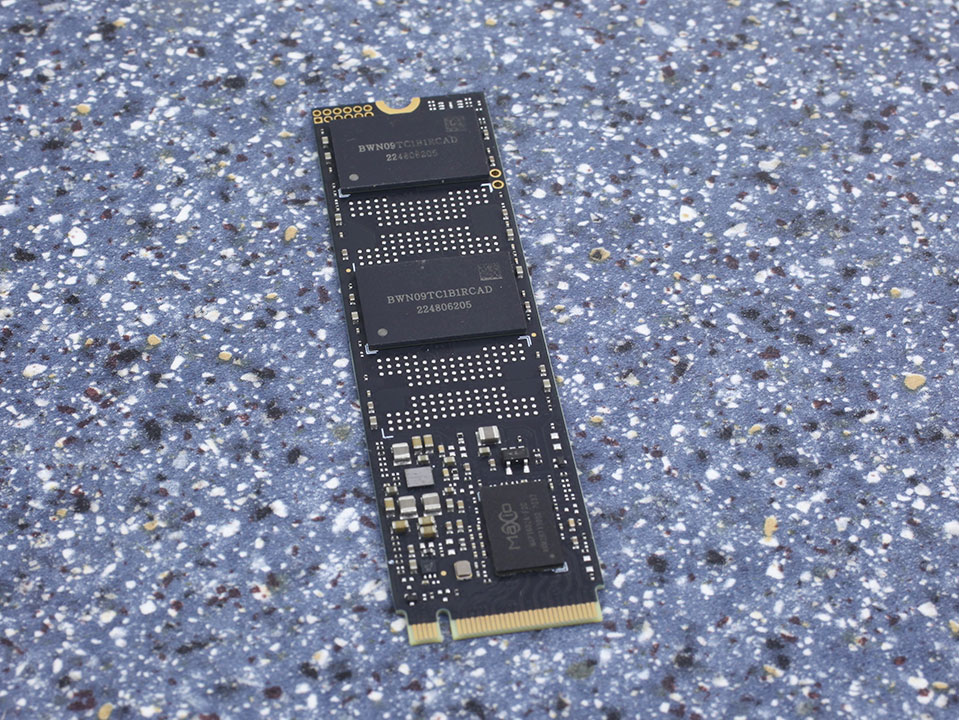
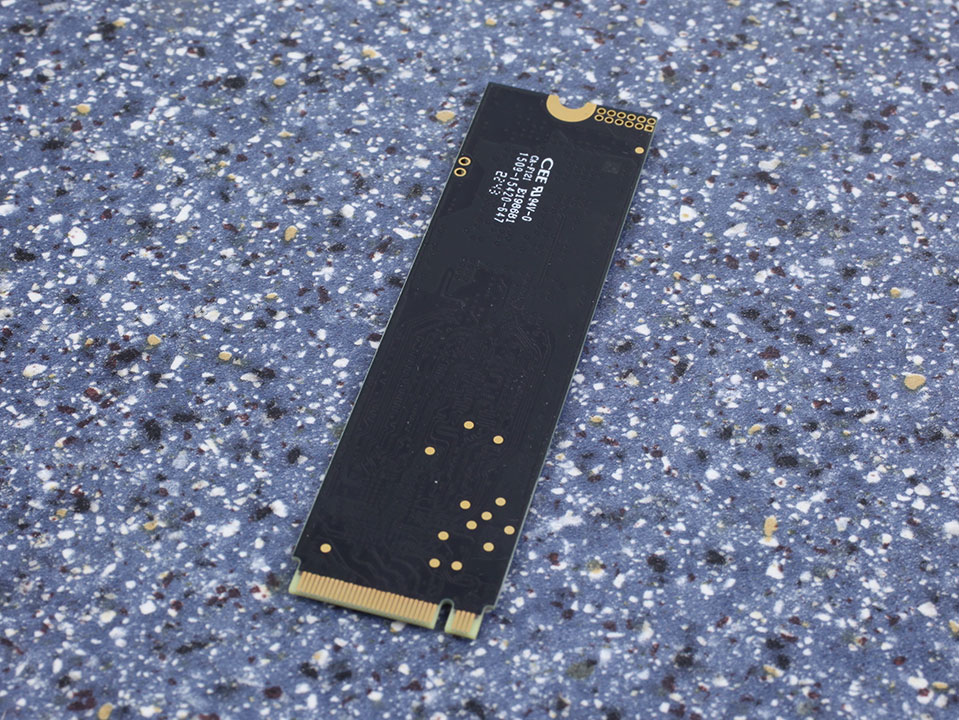
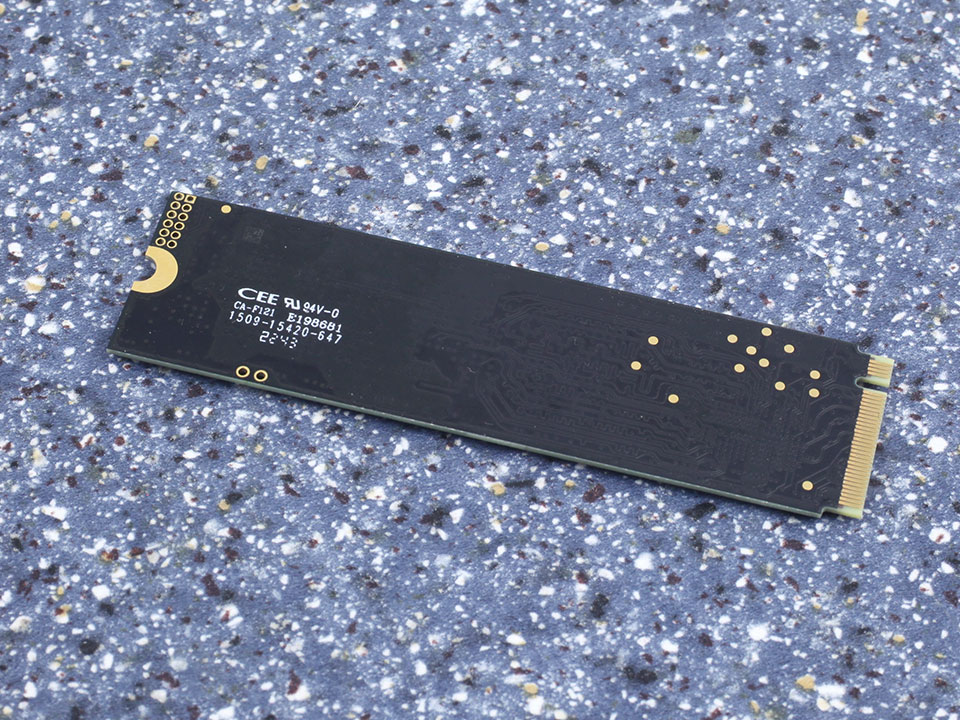
On the PCB you'll find the controller and two flash chips, a DRAM cache is not available.
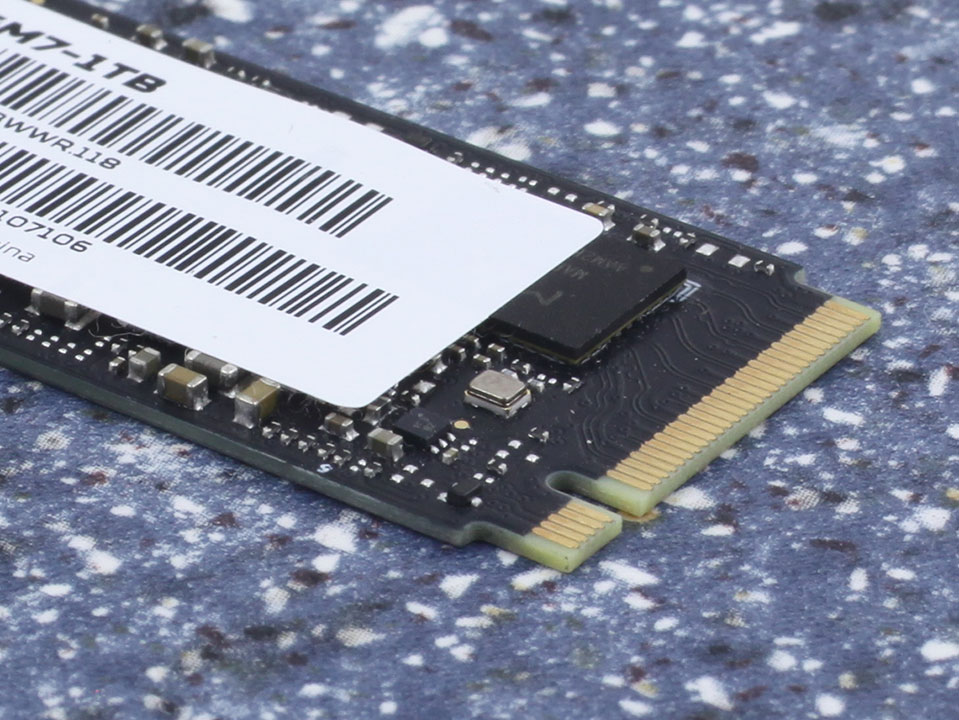
Chip Component Analysis
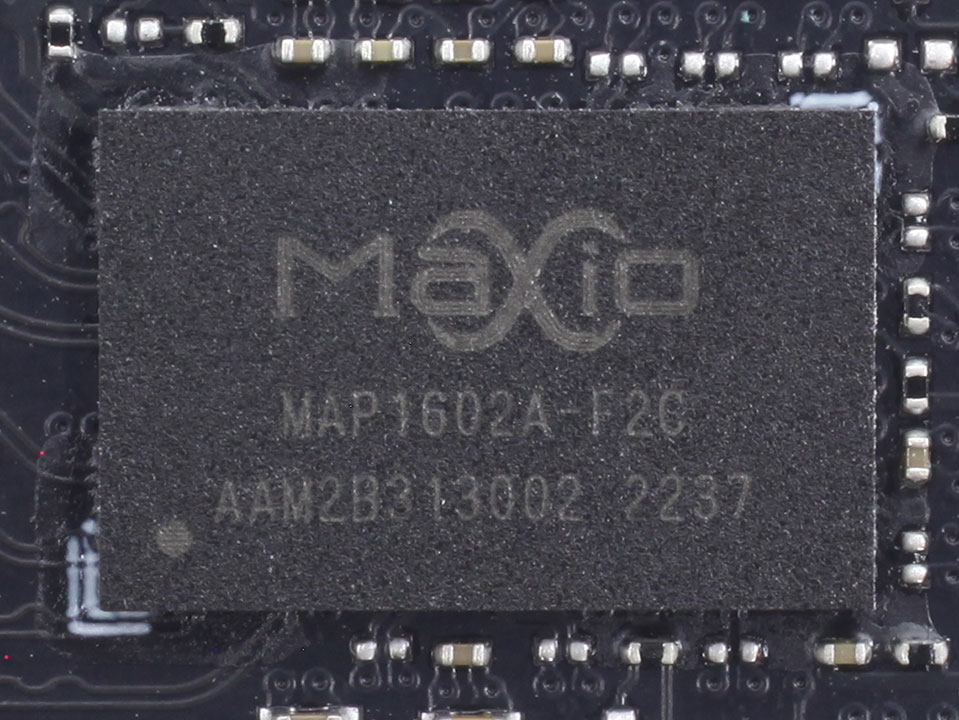
This is the first time we've reviewing a drive with Maxio's MAP1602A controller, actually it's our first Maxio-tech review at all. The controller is produced on TSMC's 12 nanometer node and uses several Arm Cortex R5 CPU cores.
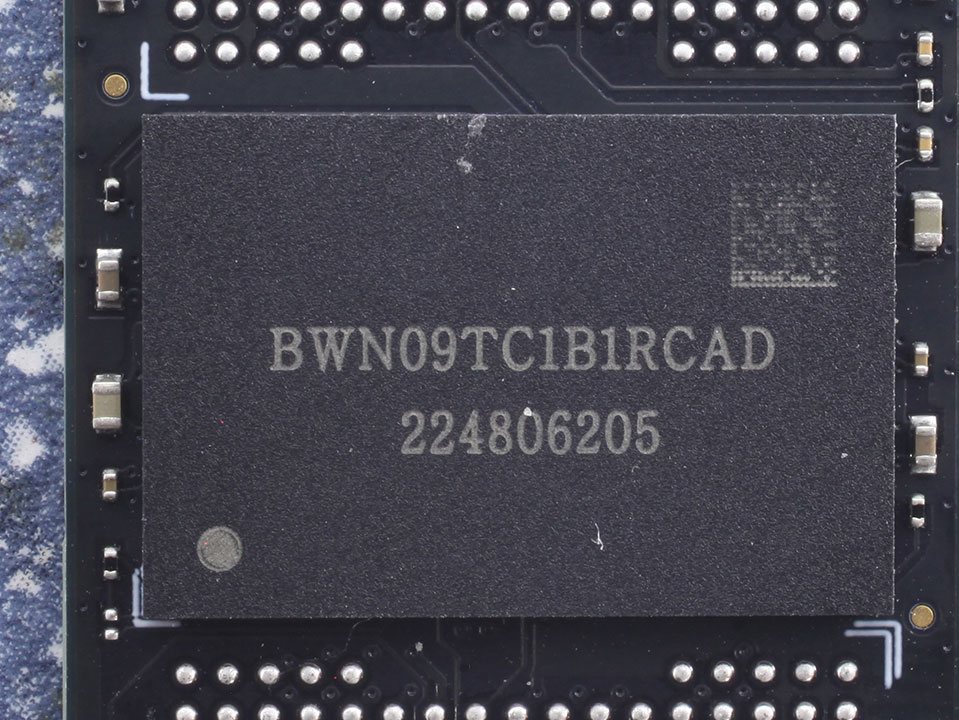
The two flash chips are YMTC 128-layer 3D TLC NAND (not 232-layer). BIWIN buys the wafers in bulk, tests and processes the chips, and packages them with their own branding.
Test Setup
| Test System SSD 2023 | |
|---|---|
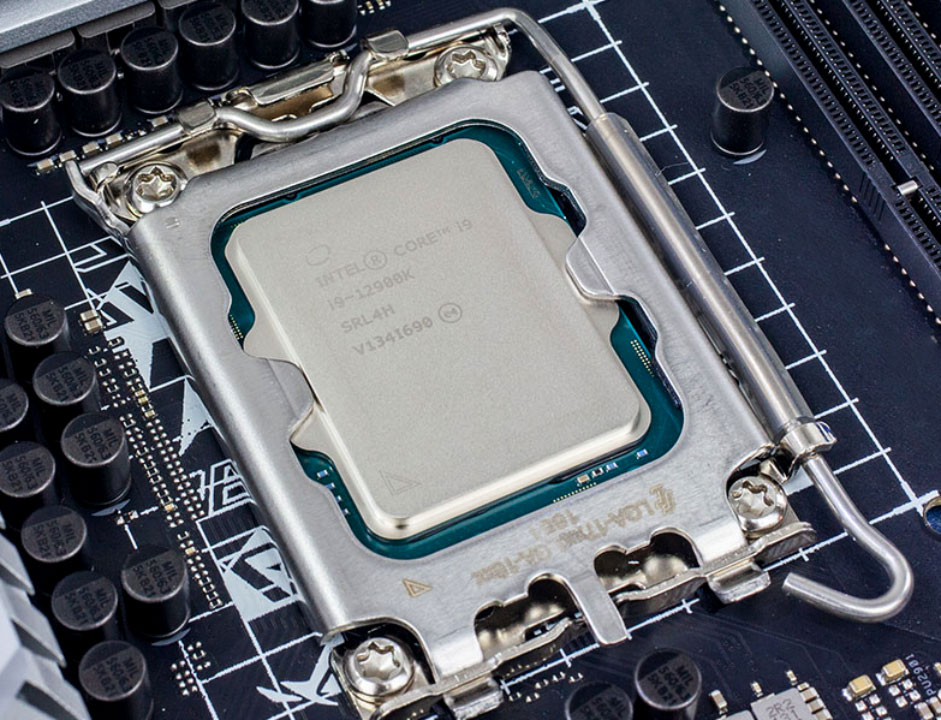
| Processor: | Intel Core i9-12900K Alder Lake 5.2 GHz, 8+8 cores / 24 threads |
| Motherboard: | ASUS ProArt Z690-Creator WIFI BIOS 2204 |
| Memory: | 2x 16 GB DDR5-6000 |
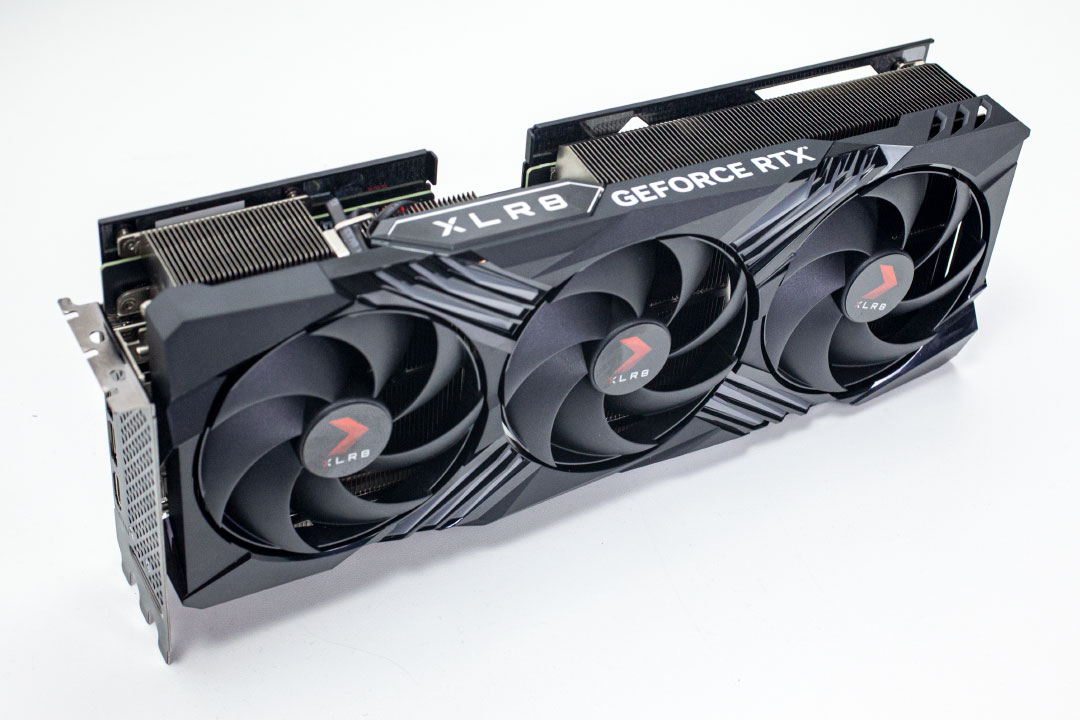
| Graphics: | PNY GeForce RTX 4070 Ti OC |
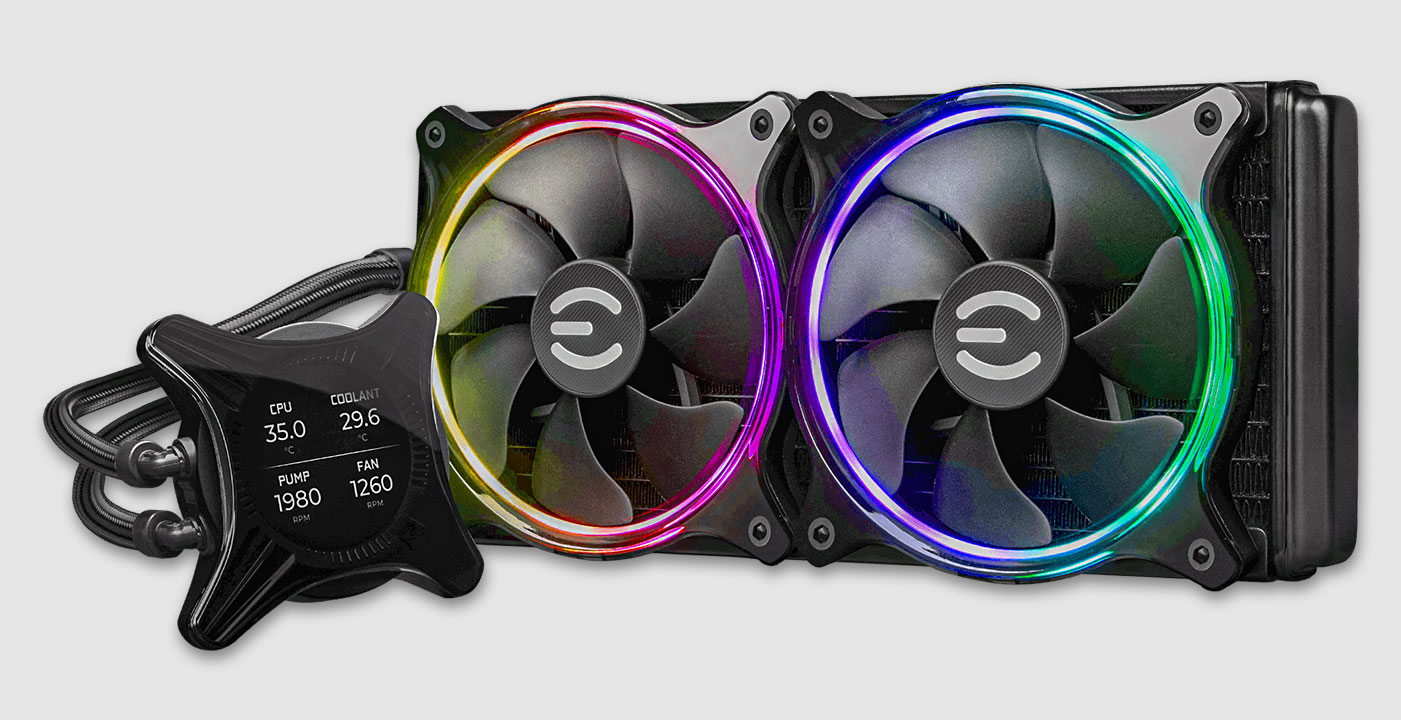
| Cooling: | EVGA CLCx 280 mm AIO |
| Thermal Paste: | Arctic MX-6 |
| Power Supply: | Thermaltake Toughpower GF3 850 W ATX 3.0 / 16-pin 12VHPWR |
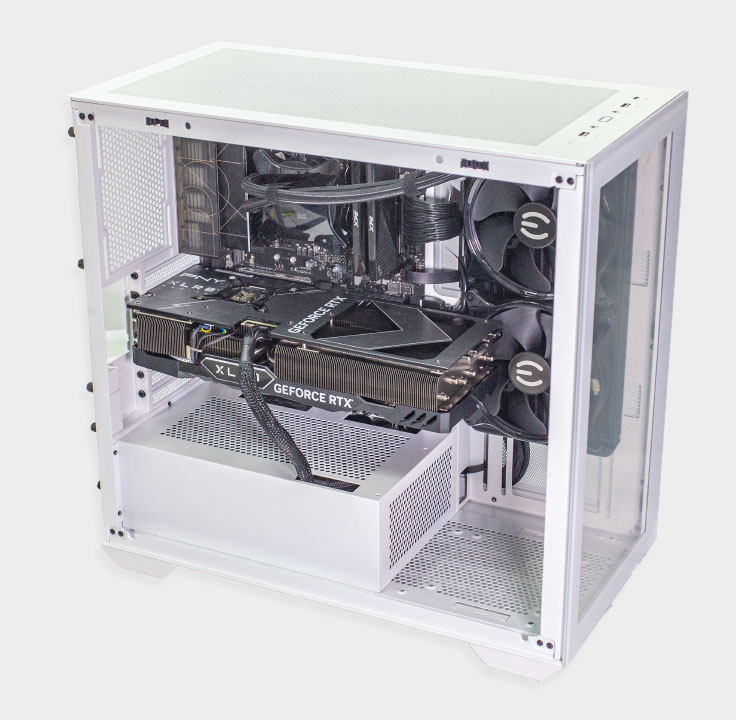
| Case: | darkFlash DLX4000 |
| Operating System: | Windows 11 Professional 64-bit 22H2 VBS enabled (Windows 11 default) |
| Drivers: | NVIDIA: 528.02 WHQL |

Synthetic Testing
- Tests are run with a 20-second-long warm-up time (result recording starts at second 21).
- Between each test, the drive is left idle for 60 seconds, to allow it to flush and reorganize its internal data.
- All write requests contain random, incompressible data.
- Disk cache is flushed between all tests.
- M.2 drives are tested with a fan blowing on them; that is, except for the results investigating uncooled behavior on the thermal testing page.
Real-life Testing
- After initial configuration and installation, a disk image is created; it is used to test every drive.
- Automated updates are disabled for the OS and all programs. This ensures that—for every review—each drive uses the same settings, without interference from previous testing.
- Our disk image consumes around 600 GB—partitions are resized to fill all available space on the drive.
- All drives are filled with random data to 80% of their capacity
- Partitions are properly aligned.
- Disk cache is flushed between all tests.
- In order to minimize random variation, each real-life performance test is run several times, with reboots between tests to minimize the impact of disk cache.
- All application benchmarks run the actual application and do not replay any disk traces.
- Our real-life testing data includes performance numbers for a typical high-performance HDD, using results from a Western Digital WD Black 1 TB 7200 RPM 3.5" SATA. HDDs are significantly slower than SSDs, which is why we're not putting the result in the chart, as that would break the scaling, making the SSDs indistinguishable in comparison. Instead, we've added the HDD performance numbers in the title of each test entry.
Our Patreon Silver Supporters can read articles in single-page format.
Mar 12th, 2025 22:37 EDT
change timezone
Latest GPU Drivers
New Forum Posts
- 5700xt low gpu usage (1)
- Folding Pie and Milestones!! (9417)
- The future of RDNA on Desktop. (117)
- Zen6 is almost here ? (63)
- What local LLM-s you use? (105)
- Nvidia's GPU market share hits 90% in Q4 2024 (gets closer to full monopoly) (898)
- 22" same price, brand, but not type, compare (0)
- aios... don't leak from the fans.... right? (Fan is acculamating droplets) (13)
- How's your old spinner holding up? (45)
- What else can I do to diagnose an artifacting card? (4)
Popular Reviews
- AMD Ryzen 9 9950X3D Review - Great for Gaming and Productivity
- XFX Radeon RX 9070 XT Mercury OC Magnetic Air Review
- Sapphire Radeon RX 9070 XT Nitro+ Review - Beating NVIDIA
- Dough Spectrum Black 32 Review
- ASUS Radeon RX 9070 TUF OC Review
- FSP MP7 Black Review
- AMD Ryzen 7 9800X3D Review - The Best Gaming Processor
- NVIDIA GeForce RTX 5070 Founders Edition Review
- MSI MAG B850 Tomahawk Max Wi-Fi Review
- XPG Starker Air BTF Review
Controversial News Posts
- NVIDIA GeForce RTX 50 Cards Spotted with Missing ROPs, NVIDIA Confirms the Issue, Multiple Vendors Affected (513)
- AMD Radeon RX 9070 and 9070 XT Listed On Amazon - One Buyer Snags a Unit (261)
- AMD RDNA 4 and Radeon RX 9070 Series Unveiled: $549 & $599 (260)
- AMD Mentions Sub-$700 Pricing for Radeon RX 9070 GPU Series, Looks Like NV Minus $50 Again (249)
- NVIDIA Investigates GeForce RTX 50 Series "Blackwell" Black Screen and BSOD Issues (244)
- AMD Radeon RX 9070 and 9070 XT Official Performance Metrics Leaked, +42% 4K Performance Over Radeon RX 7900 GRE (195)
- AMD Radeon RX 9070-series Pricing Leaks Courtesy of MicroCenter (158)
- AMD Radeon RX 9070 XT Reportedly Outperforms RTX 5080 Through Undervolting (101)