 9
9
Glorious Model O 2 Review
Software & Lighting »Sensor and Performance
The Glorious Model O 2 is equipped with the BAMF 2.0, which essentially is a PixArt PAW3395. According to specifications, the 3395 is capable of up to 26,000 CPI, as well as a maximum tracking speed of 650 IPS, which equals 16.51 m/s. Out of the box, four pre-defined CPI steps are available: 400, 800, 1600, and 3200.All testing was done on the latest firmware (1.0.4). As such, results obtained on earlier firmware versions may differ from those presented hereafter.
CPI Accuracy
"CPI" (short for counts per inch) describes the number of counts registered by the mouse if it is moved exactly an inch. There are several factors (firmware, mounting height of the sensor not meeting specifications, mouse feet thickness, mousing surface, among others) which may contribute to nominal CPI not matching actual CPI. It is impossible to always achieve a perfect match, but ideally, nominal and actual CPI should differ as little as possible. In this test, I'm determining whether this is the case or not. However, please keep in mind that said variance will still differ from unit to unit, so your mileage may vary.
I've restricted my testing to the four most common CPI steps, which are 400, 800, 1600, and 3200. As you can see, deviation is consistently negative and fairly large, with 3200 CPI being a negative outlier, which is a below average result overall. In order to account for the measured deviation, adjusted steps of 400, 800, 1650, and 3400 CPI have been used for testing.
Motion Delay
"Motion delay" encompasses all kinds of sensor lag. Any further sources of input delay will not be recorded in this test. The main thing I'll be looking for in this test is sensor smoothing, which describes an averaging of motion data across several capture frames, in order to reduce jitter at higher CPI values, increasing motion delay along with it. The goal here is to have as little smoothing as possible. As there is no way to accurately measure motion delay absolutely without special equipment, it is done by comparison with a control subject that has been determined to have consistent and low motion delay. In this case, the control subject is a Logitech G403, whose PMW3366 sensor has no visible smoothing across the entire CPI range. Note that the G403 is moved first and thus receives a slight head start.

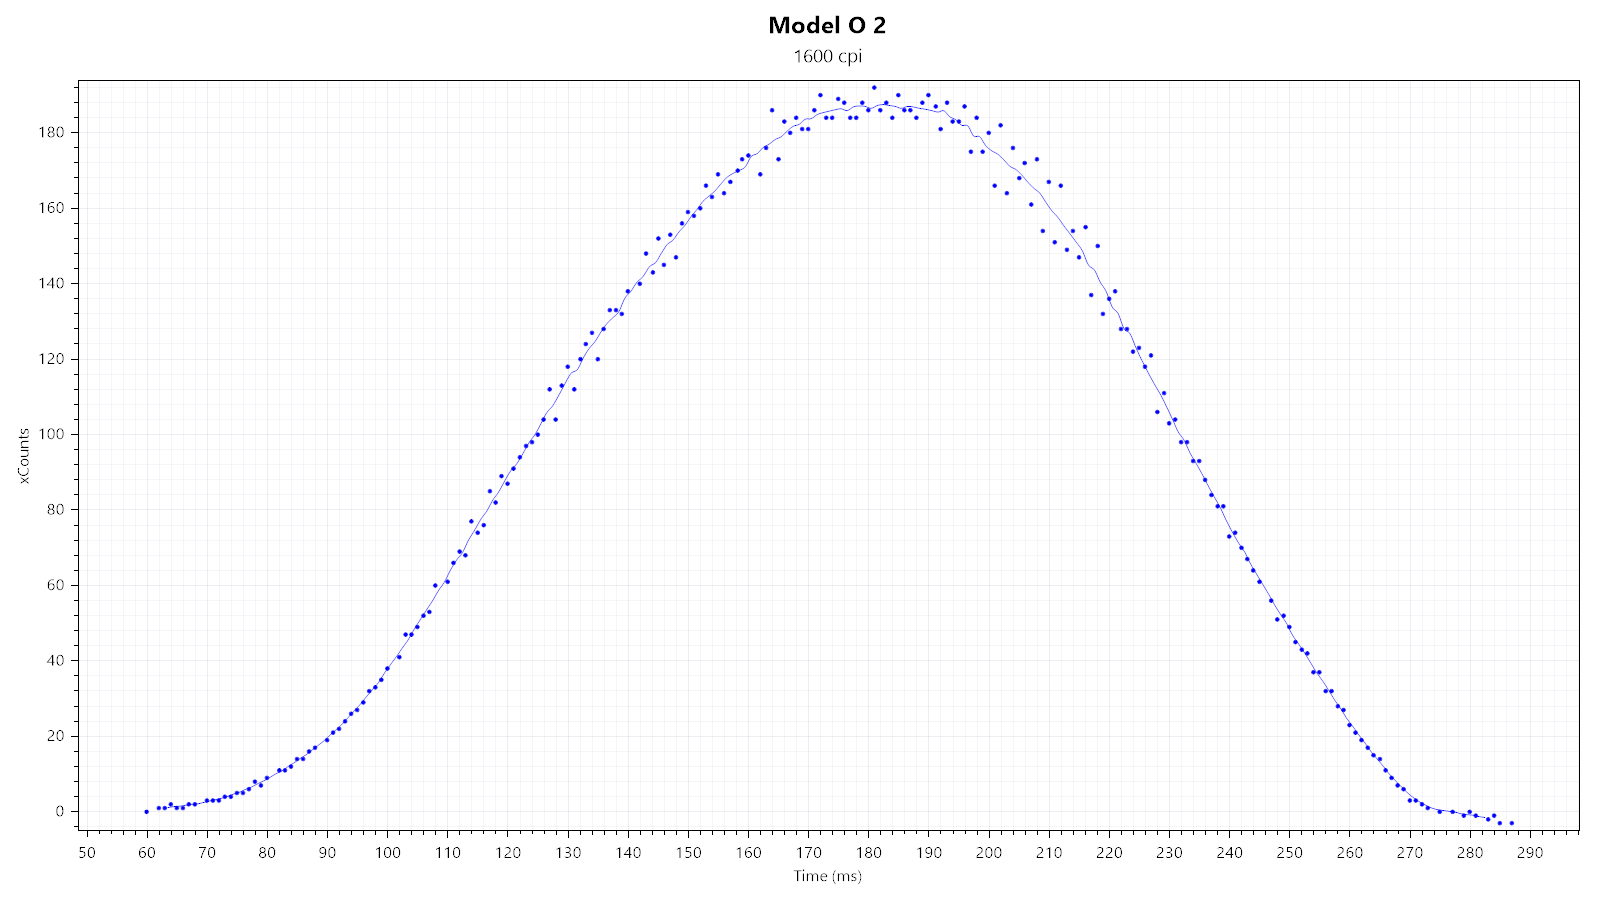
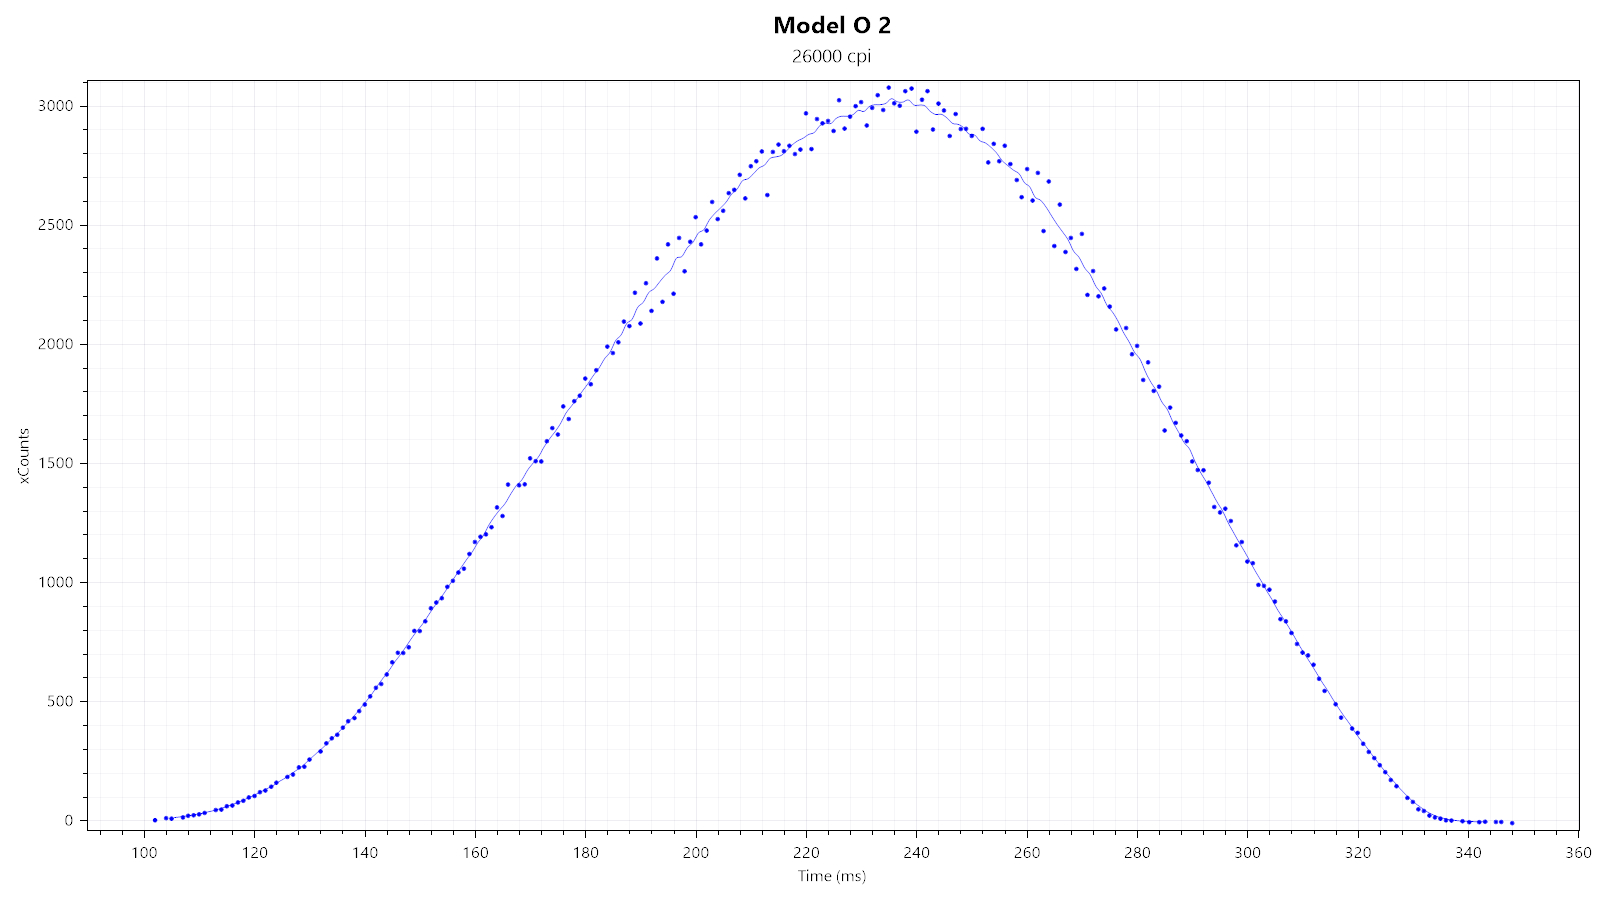
First, I'm looking at two xCounts plots—generated at 1600 and 26,000 CPI—to quickly gauge whether there is any smoothing, which would be indicated by any visible "kinks." As you can see, neither plot shows any, which strongly suggests there not being any smoothing.
Furthermore, the Model O 2 allows enabling MotionSync, which reduces SPI timing jitter.

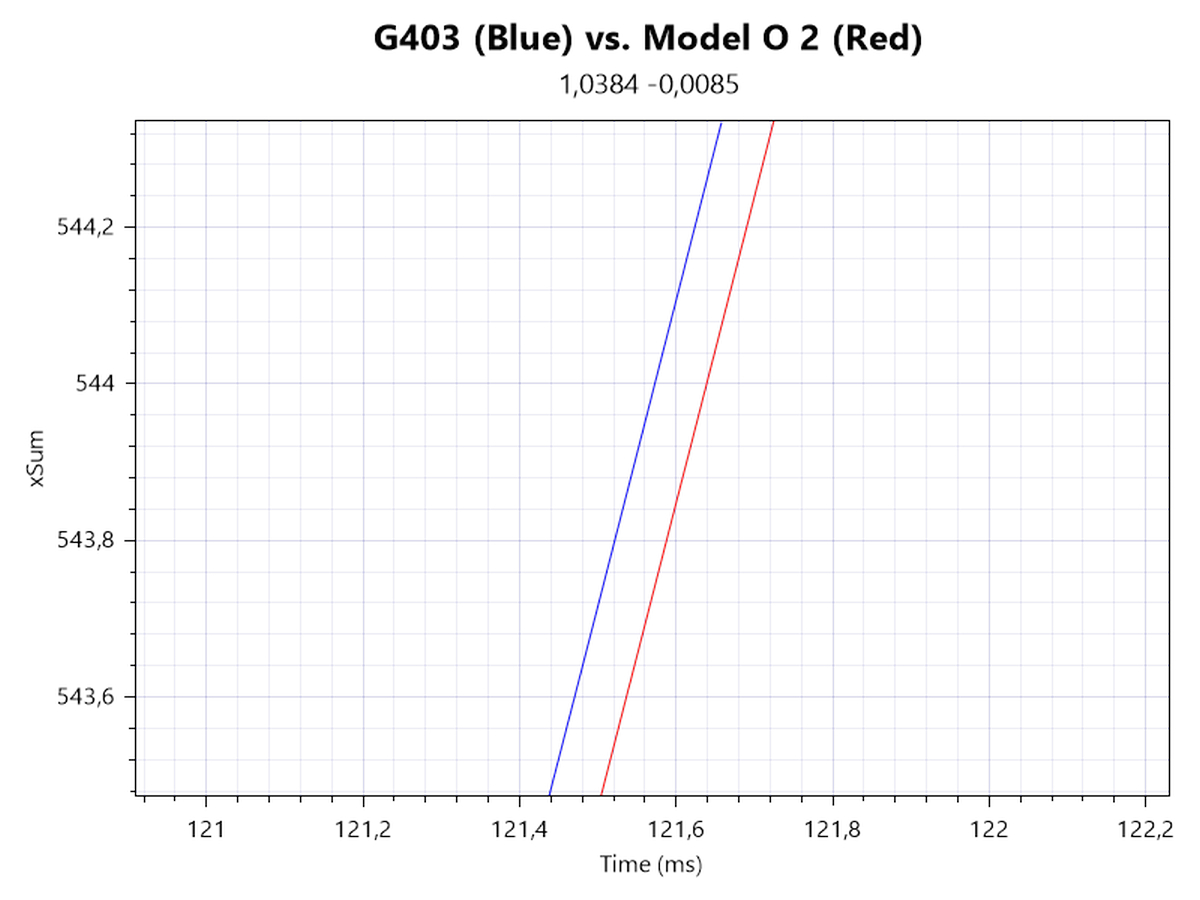
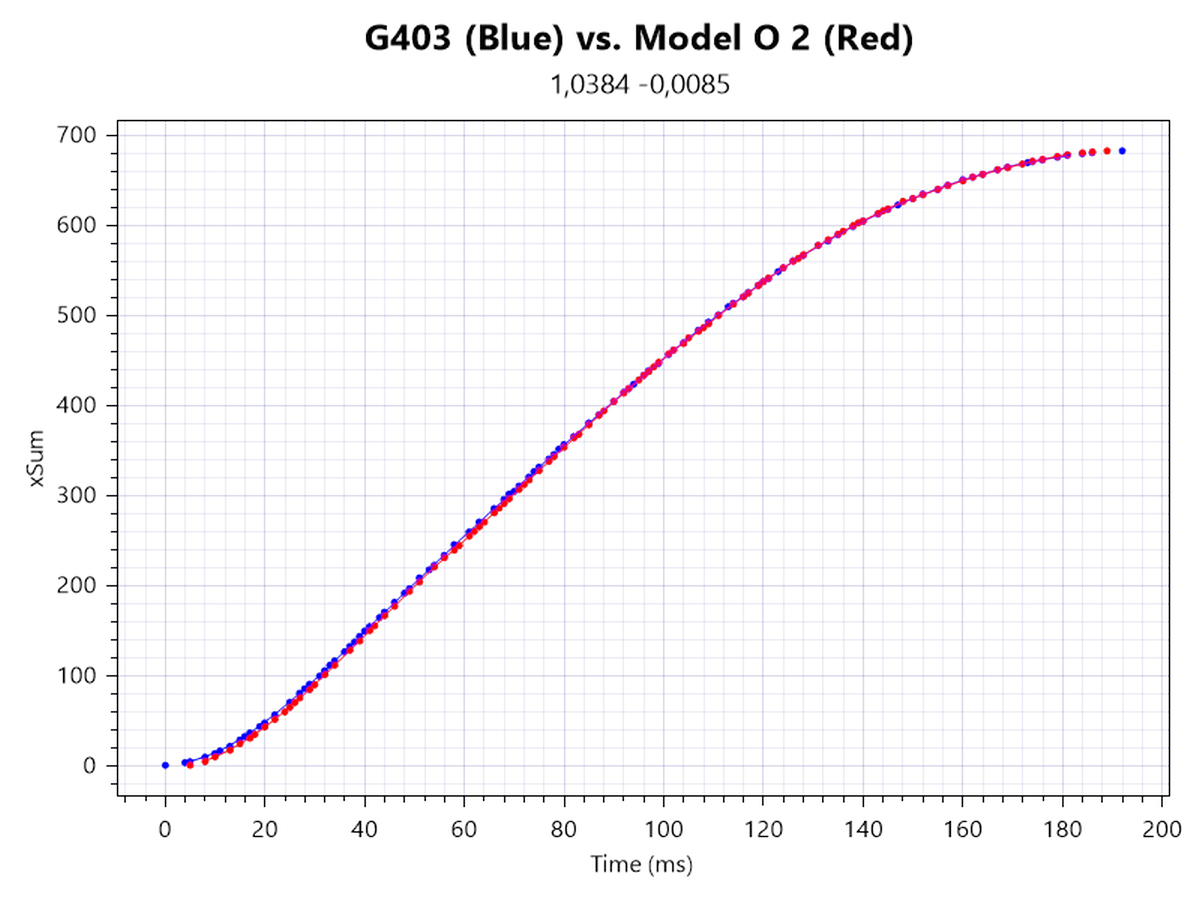

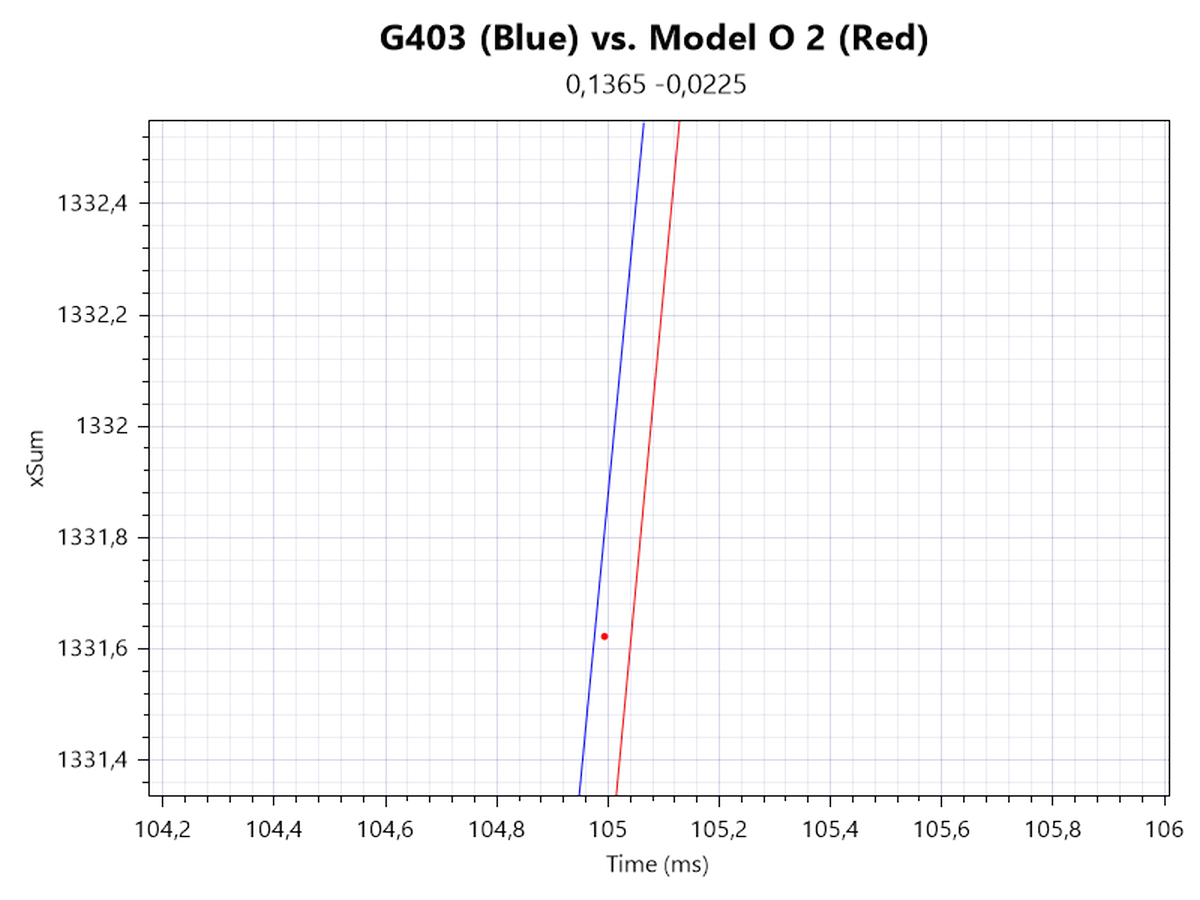
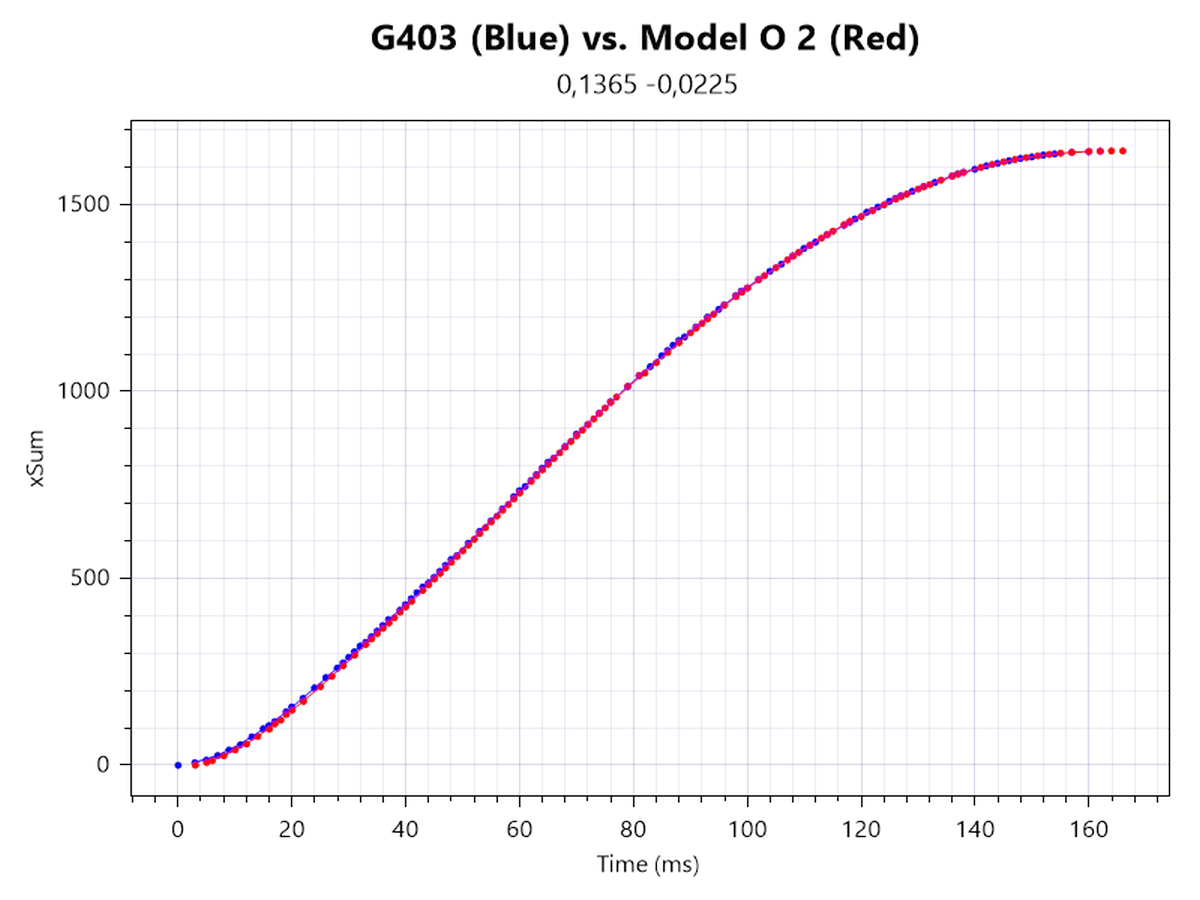
In order to determine motion delay, I'm looking at xSum plots generated at 1600 and 26,000 CPI. The line further to the left denotes the sensor with less motion delay. The first row shows motion delay at the start, end of, and throughout the entire motion at 1600 CPI, whereas the second row shows the same at 26,000 CPI. Due to framerate scaling, motion delay is increased at the onset of motion, resulting in a motion delay of roughly 2 ms at 1600 CPI and 1 ms at 26,000 CPI. Past the onset and throughout the motion, there is no motion delay differential at both 1600 and 26,000 CPI.


Upon enabling MotionSync, motion delay is increased by roughly 1 ms.
Speed-related Accuracy Variance (SRAV)

What people typically mean when they talk about "acceleration" is speed-related accuracy variance (or SRAV). It's not about the mouse having a set amount of inherent positive or negative acceleration, but about the cursor not traveling the same distance if the mouse is moved the same physical distance at different speeds. The easiest way to test this is by comparison with a control subject that is known to have very low SRAV, which in this case is the G403. As you can see from the plot, no displacement between the two cursor paths can be observed, which confirms that SRAV is very low.
Perfect Control Speed
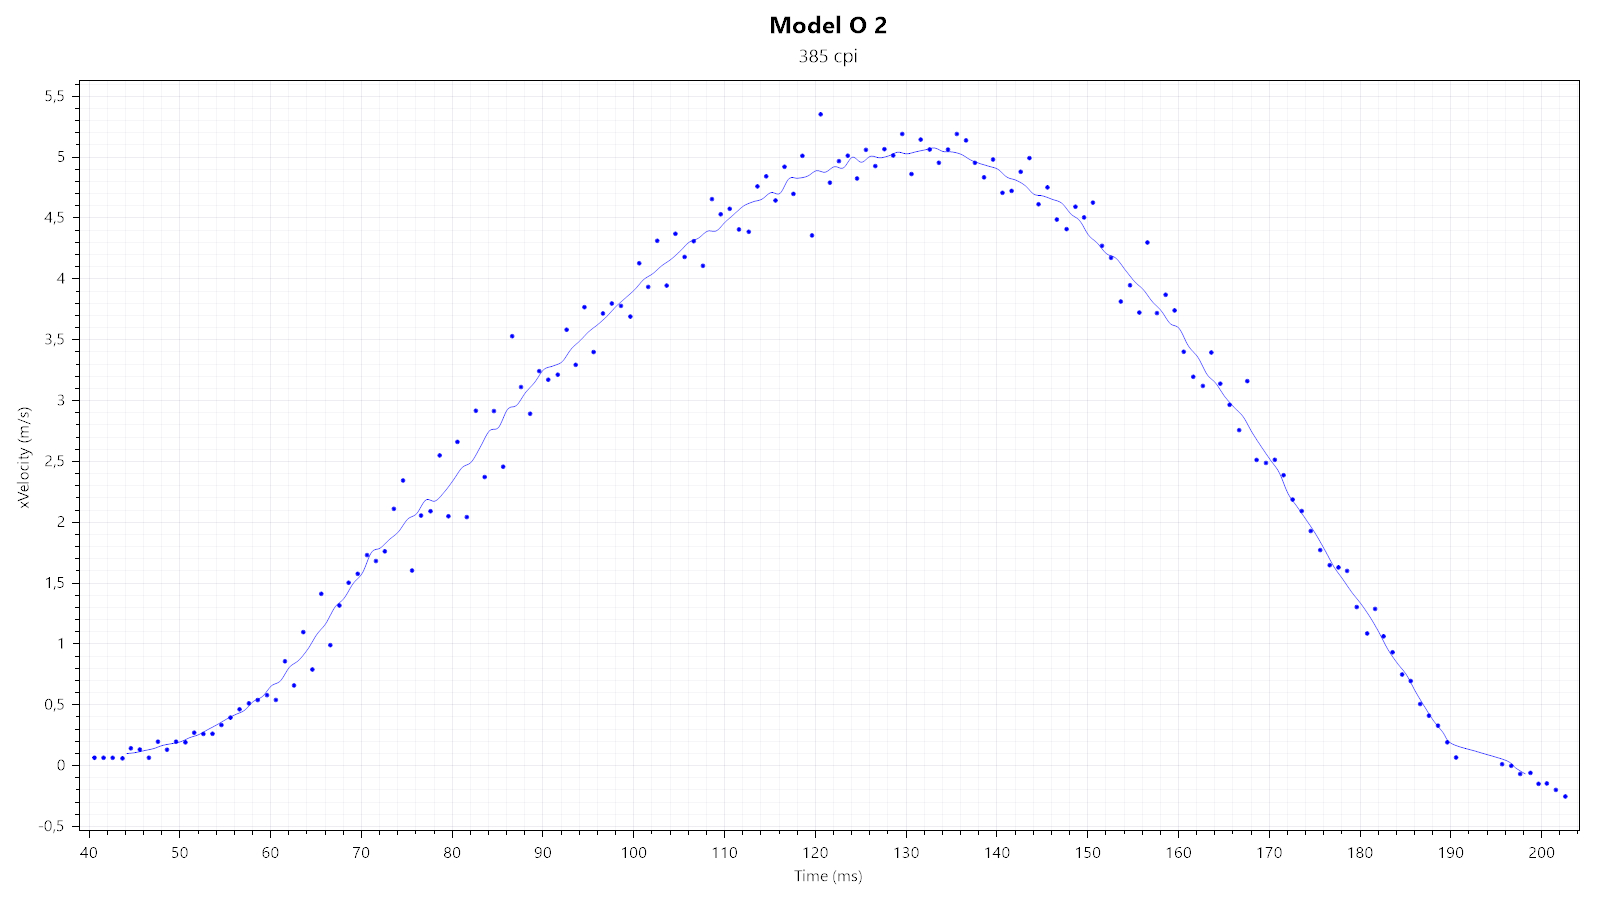
Perfect Control Speed (or PCS for short) is the maximum speed up to which the mouse and its sensor can be moved without the sensor malfunctioning in any way. I've only managed to hit a measly 5 m/s, which is within the proclaimed PCS range and causes no observable sensor malfunction.
Polling Rate Stability


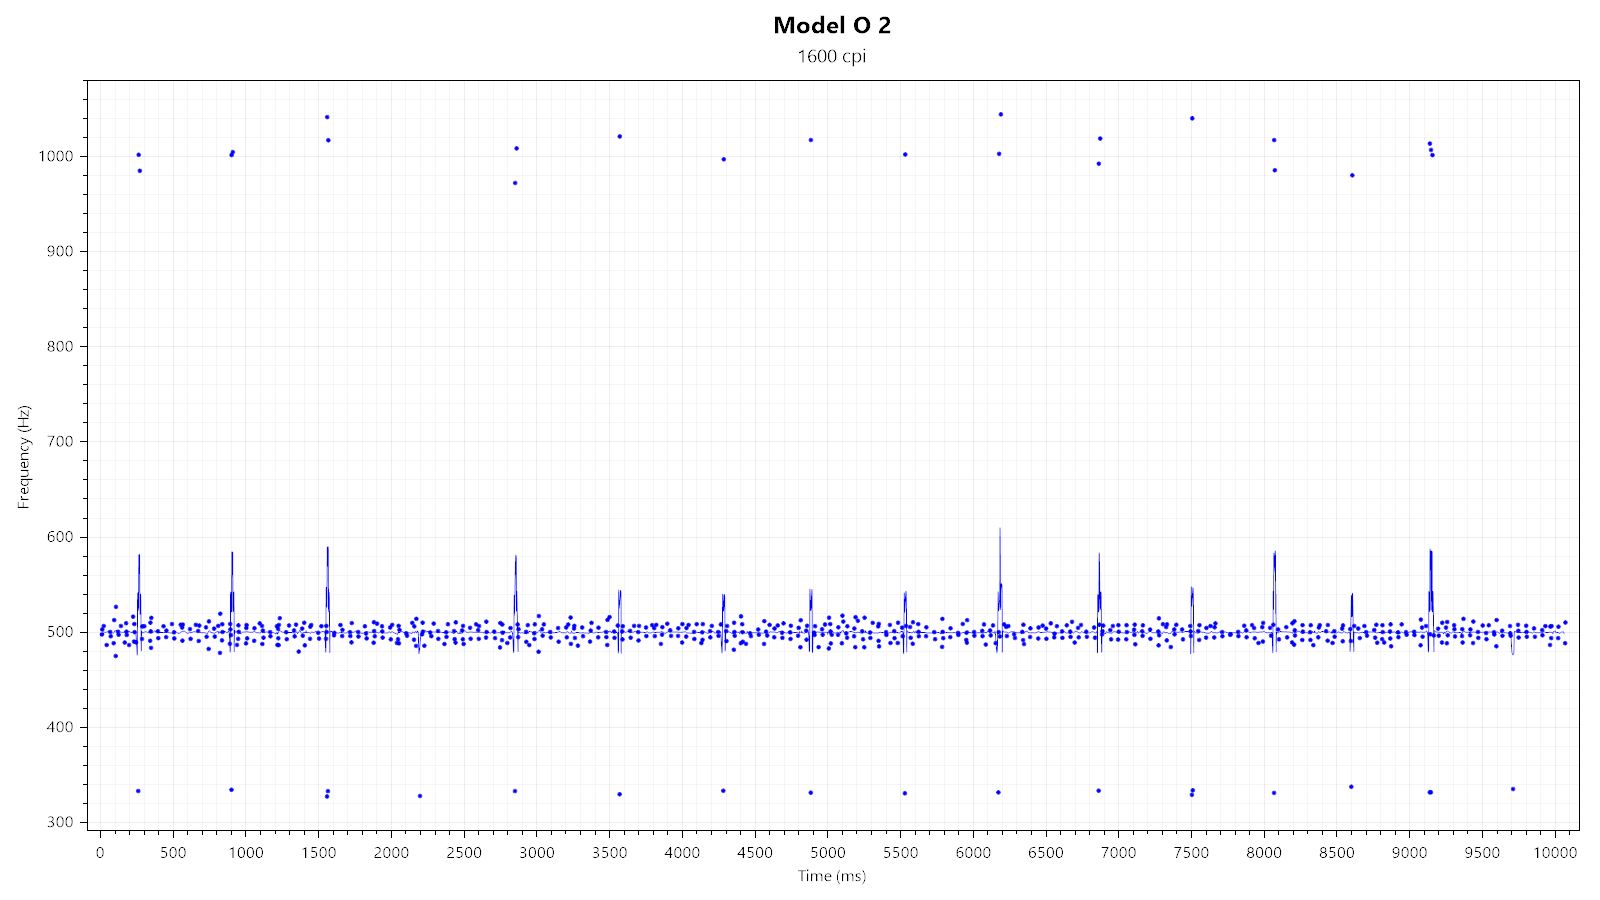
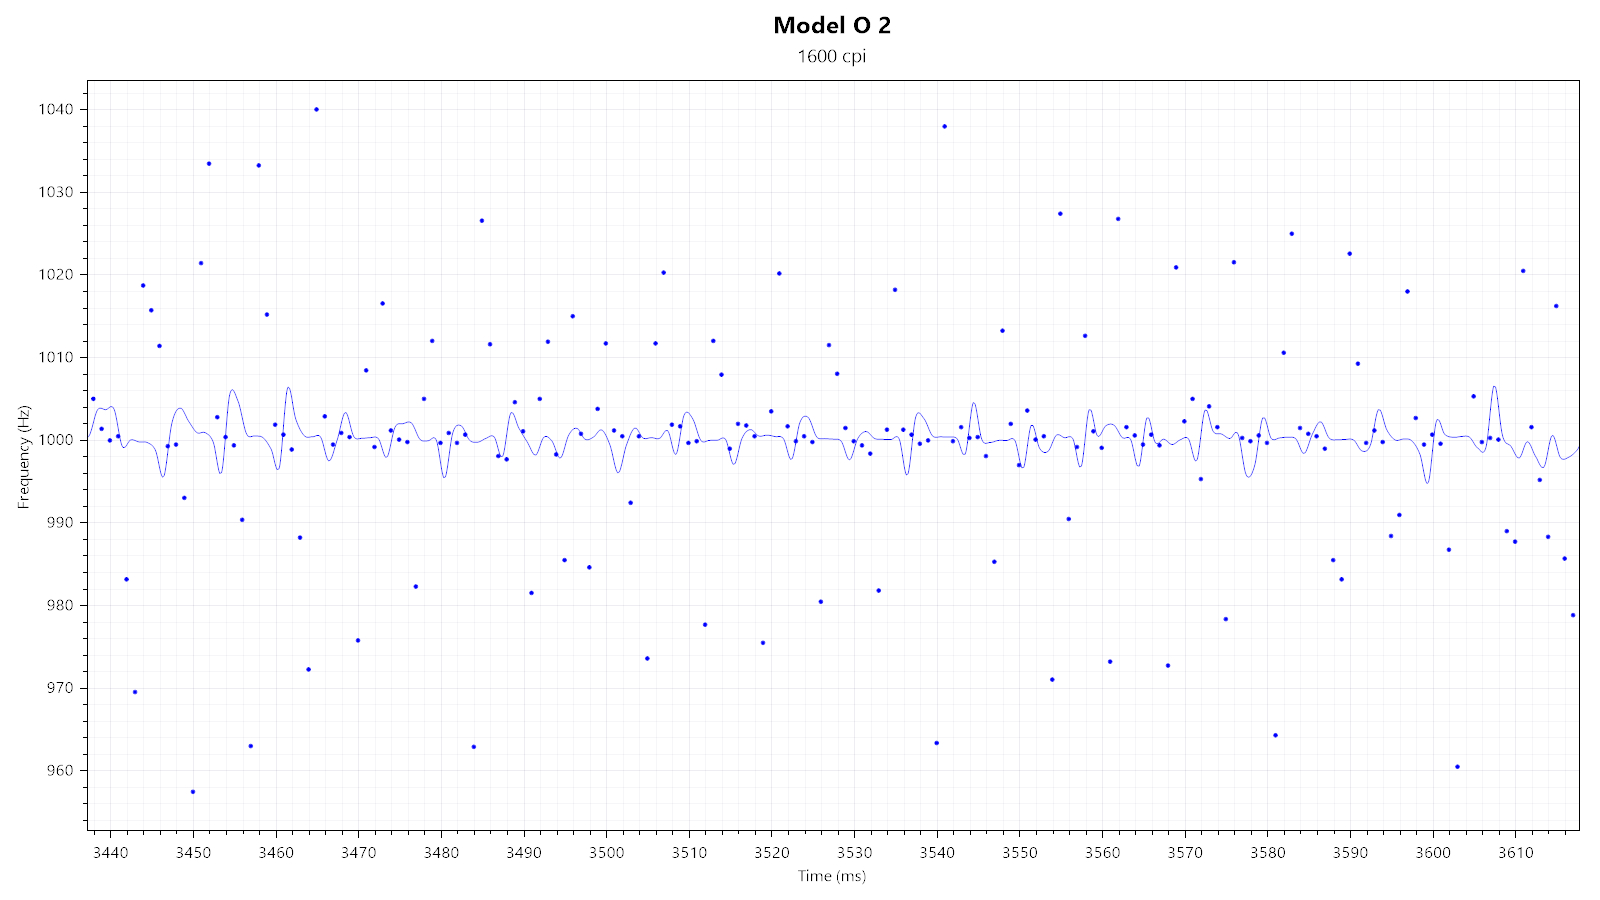
Of the available polling rates (125, 250, 500, and 1000 Hz), only 1000 Hz looks and performs fine, while all the others show periodic outliers. Polling stability is unaffected by any RGB lighting effect.
Paint Test
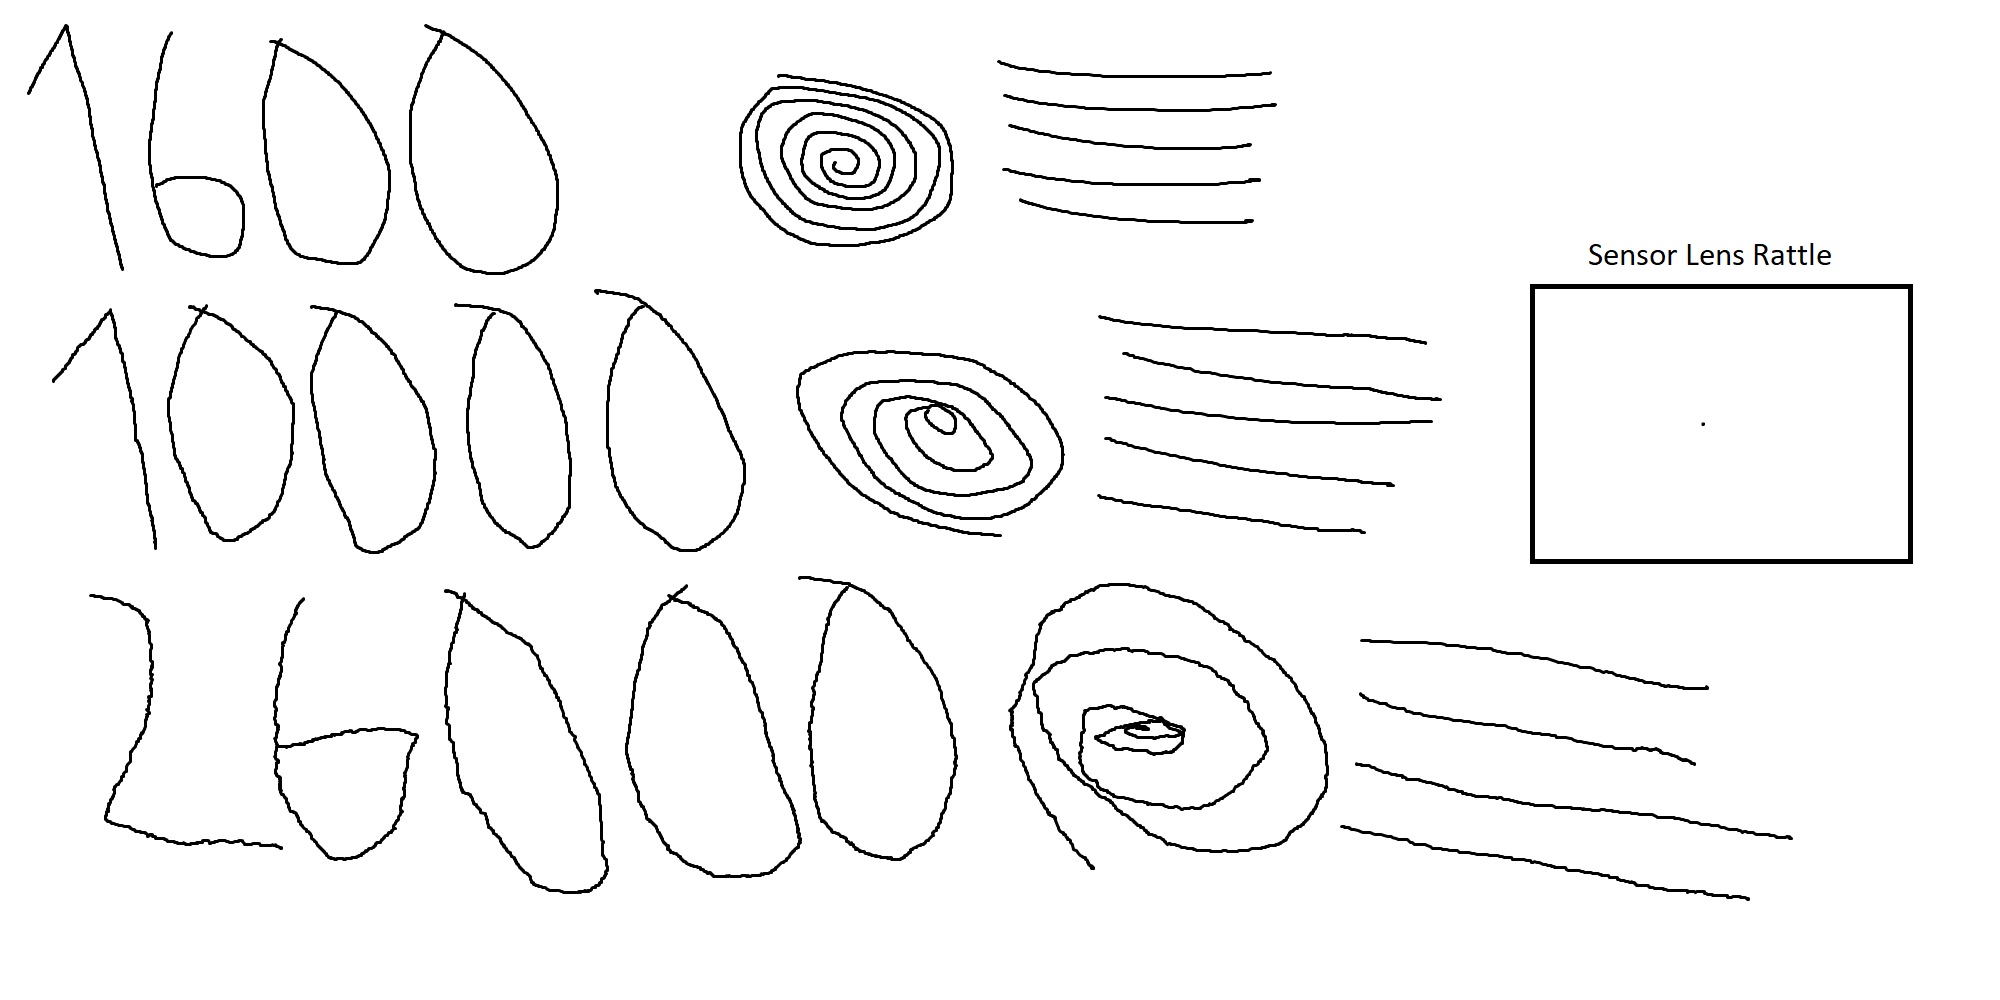
This test is used to indicate any potential issues with angle snapping (non-native straightening of linear motion) and jitter, along with any sensor lens rattle. As you can see, no issues with angle snapping can be observed. There is no jitter visible at 1600 CPI. 10,000 CPI already shows minor to moderate jitter, which is amplified to major levels at 26,000 CPI. This is in line with what to expect from a sensor lacking any smoothing. Lastly, there is no lens movement.
Lift-off Distance
The Model O 2 offers two pre-defined LOD levels. At the "1 mm" setting, the sensor does track at a height of 1 DVD, but not at a height of 2 DVDs (1.2<x<2.4 mm; x=LOD height). Using the "2 mm" setting, the sensor sporadically tracks at a height of 2 DVDs (2.4<x<3.6 mm; x=LOD height). Keep in mind that LOD may vary slightly depending on the mousing surface (pad) it is being used on.Click Latency

In most computer mice, debouncing is required to avoid double clicks, slam-clicks, or other unintended effects of switch bouncing. Debouncing typically adds a delay, which, along with any potential processing delay, shall be referred to as click latency. In order to measure click latency, the mouse has been interfaced with an NVIDIA LDAT (Latency Display Analysis Tool). Many thanks go to NVIDIA for providing an LDAT device. More specifically, the LDAT measures the time between the electrical activation of the left main button and the OS receiving the button-down message. Unless noted otherwise, the values presented in the graph refer to the lowest click latency possible on the mouse in question. If a comparison mouse is capable of both wired and wireless operation, only the result for wireless (2.4 GHz) operation will be listed.
Using a debounce time of 0 ms, click latency has been measured to be 2.6 ms, with standard deviation being 0.44 ms. Using a debounce time of 2 ms, click latency has been measured to be 4.1 ms, with standard deviation being 0.41 ms. Finally, using a debounce time of 10 ms, click latency has been measured to be 14.8 ms, with standard deviation being 0.53 ms.
Apr 18th, 2025 23:48 EDT
change timezone
Latest GPU Drivers
New Forum Posts
- RTX5000 Series Owners Club (182)
- AsRock 9070 XT Taichi BIOS confusion (2)
- Dangerous RAM temps? (4)
- New PC: Instability and unexpected shutdowns when gaming. (6)
- Can Intel recover in DYI market anytime soon? (22)
- Need thoughts on a quiet PC that's great for rendering, video editing and office work... (1)
- 5070ti overclock...what are your settings? (11)
- NVidia 576.02 breaks GPU temperature and rpm sensor read out and use for some applications (6)
- How to relubricate a fan and/or service a troublesome/noisy fan. (256)
- SSD becomes read only and cannot boot, is it dead? (19)
Popular Reviews
- ASUS GeForce RTX 5060 Ti TUF OC 16 GB Review
- NVIDIA GeForce RTX 5060 Ti PCI-Express x8 Scaling
- Palit GeForce RTX 5060 Ti Infinity 3 16 GB Review
- Teevolution Terra Pro Review
- ASUS GeForce RTX 5060 Ti Prime OC 16 GB Review
- MSI GeForce RTX 5060 Ti Gaming OC 16 GB Review
- Zotac GeForce RTX 5060 Ti AMP 16 GB Review
- MSI GeForce RTX 5060 Ti Gaming Trio OC 16 GB Review
- G.SKILL Trident Z5 NEO RGB DDR5-6000 32 GB CL26 Review - AMD EXPO
- ASRock X870E Taichi Lite Review
Controversial News Posts
- NVIDIA GeForce RTX 5060 Ti 16 GB SKU Likely Launching at $499, According to Supply Chain Leak (182)
- NVIDIA Sends MSRP Numbers to Partners: GeForce RTX 5060 Ti 8 GB at $379, RTX 5060 Ti 16 GB at $429 (127)
- Nintendo Confirms That Switch 2 Joy-Cons Will Not Utilize Hall Effect Stick Technology (105)
- NVIDIA Launches GeForce RTX 5060 Series, Beginning with RTX 5060 Ti This Week (103)
- Over 200,000 Sold Radeon RX 9070 and RX 9070 XT GPUs? AMD Says No Number was Given (100)
- Nintendo Switch 2 Launches June 5 at $449.99 with New Hardware and Games (99)
- Sony Increases the PS5 Pricing in EMEA and ANZ by Around 25 Percent (85)
- NVIDIA PhysX and Flow Made Fully Open-Source (77)