 42
42
WD Blue SN580 1 TB Review - Incredible Price/Performance
(42 Comments) »Introduction
Western Digital (or simply WD) is the world's largest manufacturer of storage solutions, mostly known for their wide range of hard disk offerings. With their acquisition of SanDisk in 2016, WD became one of the largest manufacturers for flash storage, too.

In this review we're testing Western Digital's new WD Blue SN580 budget SSD. As the name suggests, the SN580 is the successor to the SN570 that we reviewed in late 2021.
Internally, the WD Blue SN580 uses a SanDisk 20-82-10082 controller paired with 112-layer 3D TLC flash from Toshiba, also known as BiCS5. These are the same flash chips as on the SN570, the controller is a newer model that we haven't seen before, but it seems very similar to the controller of the WD Black SN770. A DRAM cache is not available, definitely to reduce manufacturing cost. To connect with the rest of the system, the PCI-Express 4.0 interface is used.
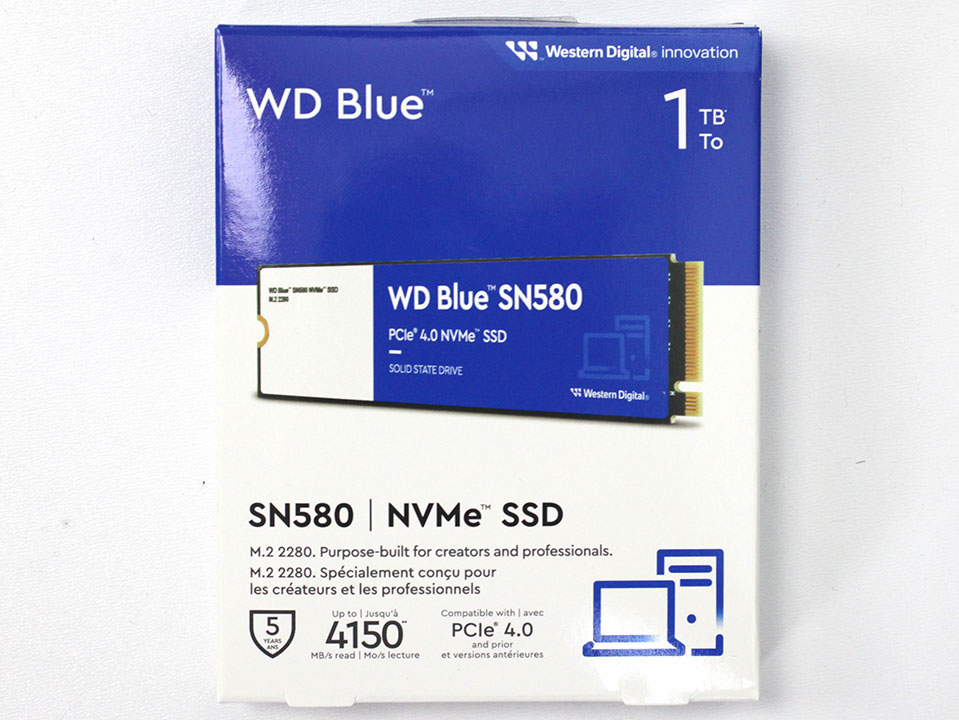
The WD Blue SN580 is available in capacities of 250 GB ($30), 500 GB ($27), 1 TB ($46) and 2 TB ($93). Endurance for these models is set to 150 TBW, 300 TBW, 600 TBW and 900 TBW, respectively. WD includes a five-year warranty with the SN580.
| Specifications: WD Blue SN580 1 TB SSD | |
|---|---|
| Brand: | Western Digital (WD) |
| Model: | WDS100T3B0E |
| Capacity: | 1000 GB (931 GB usable) 24 GB additional overprovisioning |
| Controller: | SanDisk 20-82-10082-A1 |
| Flash: | Kioxia/Toshiba 112-layer 3D TLC BiCS5 001396 Rebranded as SanDisk |
| DRAM: | N/A, but 200 MB Host-Memory-Buffer (HMB) |
| Endurance: | 600 TBW |
| Form Factor: | M.2 2280 |
| Interface: | PCIe Gen 4 x4, NVMe 1.4 |
| Device ID: | WD Blue SN580 1TB |
| Firmware: | 281010WD |
| Warranty: | Five years |
| Price at Time of Review: | $45 / $45 per TB |
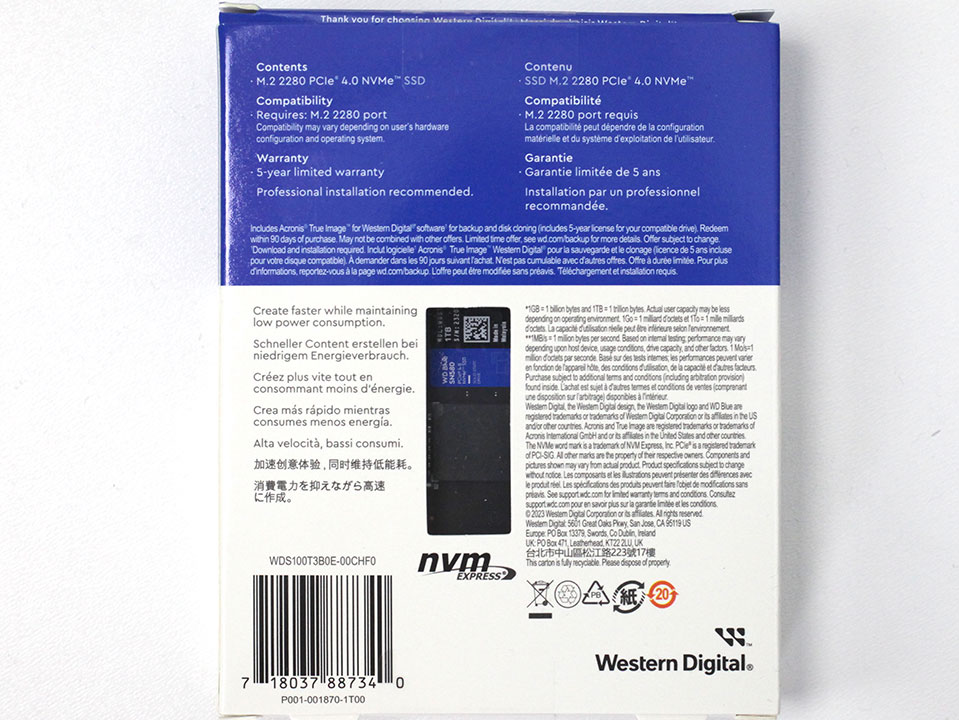
Packaging
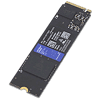
The Drive
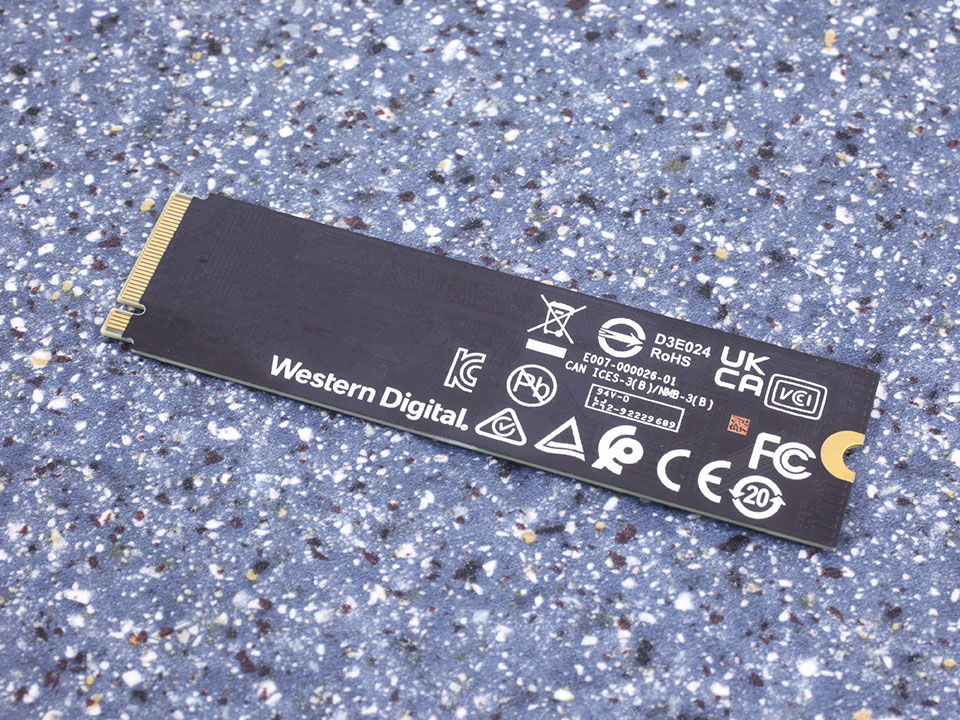
The drive is designed for the M.2 2280 form factor, which makes it 22 mm wide and 80 mm long.

PCI-Express 4.0 x4 is used as the host interface to the rest of the system, which doubles the theoretical bandwidth compared to PCIe 3.0 x4.
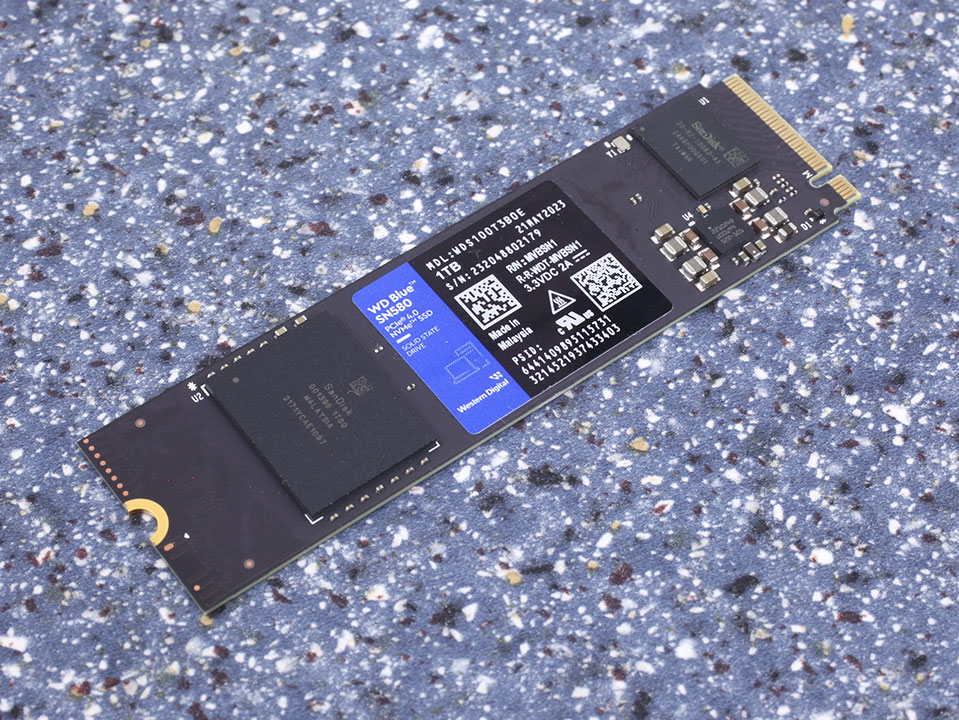
Chip Component Analysis
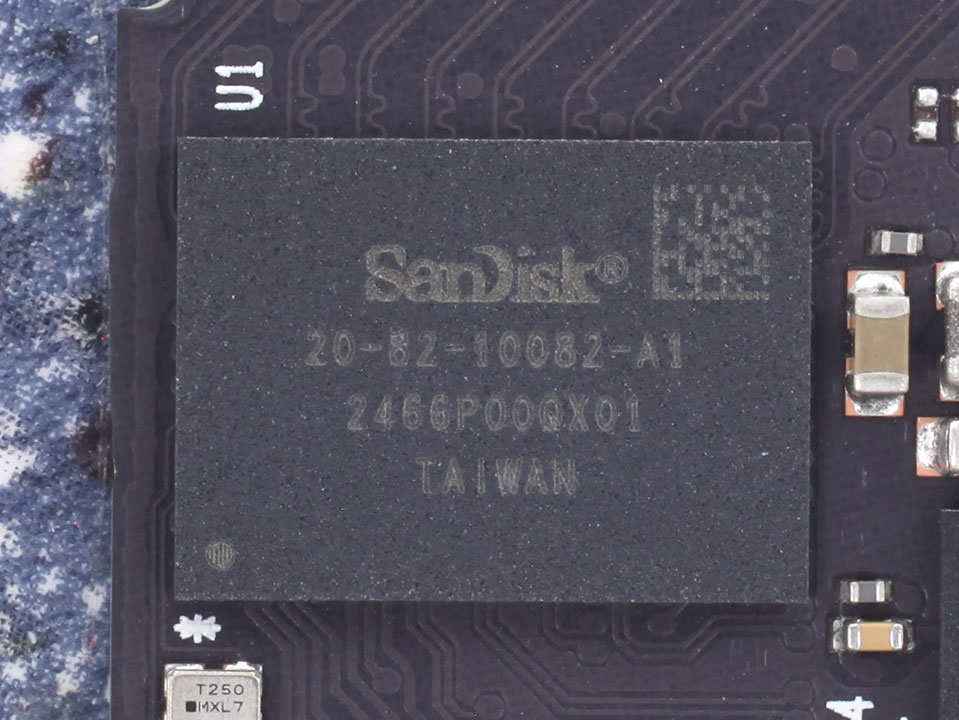
Almost nothing is known about this SanDisk 20-82-10082-A1 SSD controller. It is a four-channel design, which obviously supports TLC and DRAM-less operation.
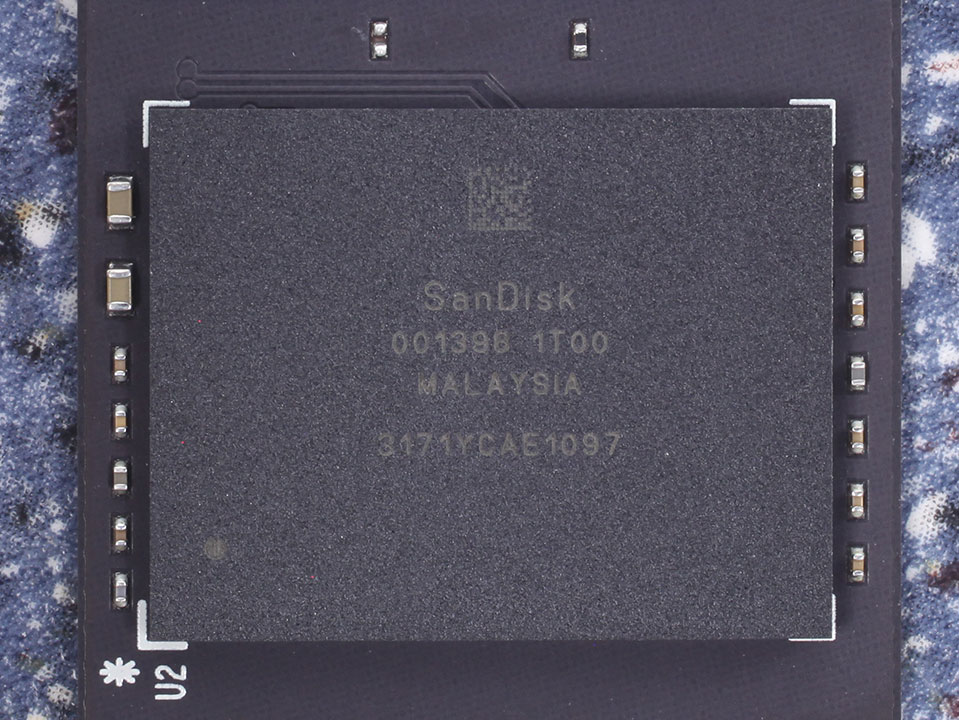
The single flash chip is Toshiba's BiCS5 112-layer TLC NAND with a capacity of 8 Tbit, or 1 TB.
Test Setup
| Test System SSD 2023 | |
|---|---|
| Processor: | Intel Core i9-12900K Alder Lake 5.2 GHz, 8+8 cores / 24 threads |
| Motherboard: | ASUS ProArt Z690-Creator WIFI BIOS 2204 |
| Memory: | 2x 16 GB DDR5-6000 |
| Graphics: | PNY GeForce RTX 4070 Ti OC |
| Cooling: | EVGA CLCx 280 mm AIO |
| Thermal Paste: | Arctic MX-6 |
| Power Supply: | Thermaltake Toughpower GF3 850 W ATX 3.0 / 16-pin 12VHPWR |
| Case: | darkFlash DLX4000 |
| Operating System: | Windows 11 Professional 64-bit 22H2 VBS enabled (Windows 11 default) |
| Drivers: | NVIDIA: 528.02 WHQL |


Synthetic Testing
- Tests are run with a 20-second-long warm-up time (result recording starts at second 21).
- Between each test, the drive is left idle for 60 seconds, to allow it to flush and reorganize its internal data.
- All write requests contain random, incompressible data.
- Disk cache is flushed between all tests.
- M.2 drives are tested with a fan blowing on them; that is, except for the results investigating uncooled behavior on the thermal testing page.
Real-life Testing
- After initial configuration and installation, a disk image is created; it is used to test every drive.
- Automated updates are disabled for the OS and all programs. This ensures that—for every review—each drive uses the same settings, without interference from previous testing.
- Our disk image consumes around 600 GB—partitions are resized to fill all available space on the drive.
- All drives are filled with random data to 80% of their capacity
- Partitions are properly aligned.
- Disk cache is flushed between all tests.
- In order to minimize random variation, each real-life performance test is run several times, with reboots between tests to minimize the impact of disk cache.
- All application benchmarks run the actual application and do not replay any disk traces.
- Our real-life testing data includes performance numbers for a typical high-performance HDD, using results from a Western Digital WD Black 1 TB 7200 RPM 3.5" SATA. HDDs are significantly slower than SSDs, which is why we're not putting the result in the chart, as that would break the scaling, making the SSDs indistinguishable in comparison. Instead, we've added the HDD performance numbers in the title of each test entry.
Our Patreon Silver Supporters can read articles in single-page format.
Mar 13th, 2025 06:22 EDT
change timezone
Latest GPU Drivers
New Forum Posts
- The TPU UK Clubhouse (25880)
- Free Games Thread (4553)
- 3D Printer Club (451)
- How's your old spinner holding up? (48)
- I'm looking for a good tool to make the 3D scanning of my mini-pc using the photogrammetry and my Kinect 2. (87)
- Missing nvidia control panel after using nvcleanstall with latest drivers (4)
- Zen6 is almost here ? (67)
- Core i7 12700k or Ryzen 7 7700? (13)
- Post your Old CDs & FDs, from back in the day thread. (72)
- HOW TO ADD NVMe M.2 SSD SUPPORT TO OLD MOTHERBOARDS WITH AMI BIOS LEGACY SUPPORT? (7)
Popular Reviews
- AMD Ryzen 9 9950X3D Review - Great for Gaming and Productivity
- Sapphire Radeon RX 9070 XT Nitro+ Review - Beating NVIDIA
- XFX Radeon RX 9070 XT Mercury OC Magnetic Air Review
- Dough Spectrum Black 32 Review
- FSP MP7 Black Review
- ASUS Radeon RX 9070 TUF OC Review
- ASUS GeForce RTX 5090 TUF Review
- AMD Ryzen 7 9800X3D Review - The Best Gaming Processor
- NVIDIA GeForce RTX 5070 Founders Edition Review
- MSI MAG B850 Tomahawk Max Wi-Fi Review
Controversial News Posts
- NVIDIA GeForce RTX 50 Cards Spotted with Missing ROPs, NVIDIA Confirms the Issue, Multiple Vendors Affected (513)
- AMD Radeon RX 9070 and 9070 XT Listed On Amazon - One Buyer Snags a Unit (261)
- AMD RDNA 4 and Radeon RX 9070 Series Unveiled: $549 & $599 (260)
- AMD Mentions Sub-$700 Pricing for Radeon RX 9070 GPU Series, Looks Like NV Minus $50 Again (249)
- NVIDIA Investigates GeForce RTX 50 Series "Blackwell" Black Screen and BSOD Issues (244)
- AMD Radeon RX 9070 and 9070 XT Official Performance Metrics Leaked, +42% 4K Performance Over Radeon RX 7900 GRE (195)
- AMD Radeon RX 9070-series Pricing Leaks Courtesy of MicroCenter (158)
- AMD Radeon RX 9070 XT Reportedly Outperforms RTX 5080 Through Undervolting (102)