- Joined
- Oct 9, 2007
- Messages
- 47,306 (7.52/day)
- Location
- Hyderabad, India
| System Name | RBMK-1000 |
|---|---|
| Processor | AMD Ryzen 7 5700G |
| Motherboard | ASUS ROG Strix B450-E Gaming |
| Cooling | DeepCool Gammax L240 V2 |
| Memory | 2x 8GB G.Skill Sniper X |
| Video Card(s) | Palit GeForce RTX 2080 SUPER GameRock |
| Storage | Western Digital Black NVMe 512GB |
| Display(s) | BenQ 1440p 60 Hz 27-inch |
| Case | Corsair Carbide 100R |
| Audio Device(s) | ASUS SupremeFX S1220A |
| Power Supply | Cooler Master MWE Gold 650W |
| Mouse | ASUS ROG Strix Impact |
| Keyboard | Gamdias Hermes E2 |
| Software | Windows 11 Pro |
CodeXL is now part of the GPUOpen initiative. You can find all of CodeXL's source code (barring a few parts that are IP-confidential) on the CodeXL GitHub project. Version 2.0 is also available in pre-built binary form, like previous versions. We believe that by adopting the open-source model and sharing the CodeXL source base with the world we can help developers make better use of CodeXL and make CodeXL a better tool.
To encourage 3rd party contribution and adoption, CodeXL is no longer branded as an AMD product. AMD will still continue development of this tool and upload new CodeXL versions and features to GPUOpen.


Frame Analysis Mode
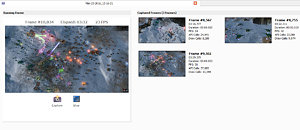
A new mode has been introduced into CodeXL 2.0 - Frame Analysis Mode.
This new component, currently released in Beta stage, is aimed towards developers focused on game development. With it, you can capture a render frame from a Microsoft DirectX 12 application, and view its render timeline and CPU and GPU execution block details.
A new sample application has been added, to enable experimentation with the new mode.
Debug Mode
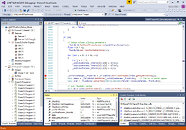
Host code debugging is now supported in the Visual Studio extension (32-bit native C/C++ code only) and Linux version of CodeXL.
This new feature upgrades CodeXL from an API-level debugger to a full-fledged debugger on the host (CPU) side - including source code breakpoints, application stepping, locals and watch expression evaluation, while retaining the OpenCL kernel debugging capabilities in the same debug session!
Analyze Mode
Analyze Mode now features support for Vulkan GLSL shaders, including ISA generation and performance statistics.
Also new in this version is support for GLSL programs (both OpenGL and Vulkan shaders). Combine your shaders to be linked in a complete program, providing more accurate ISA and performance statistics.
OpenGL and DirectX shader binaries can now be exported for comparison or inclusion in applications.
Profile Mode
CodeXL 2.0's Power Profiling mode includes the long-awaited feature of attributing samples to specific processes, allowing you to not only know when power is used by the system, but also by whom!
Cross-platform (Windows-to-Linux and Linux-to-Windows) Remote GPU profiling is now supported in the GPU Profiler.
Visual Studio 2015 extension
The CodeXL Visual Studio extension now supports Visual Studio 2015.
Heterogeneous System Architecture (HSA)
CodeXL HSA Profiler and HSAIL Kernel Debugger now support the Boltzmann initiative driver, on AMD Radeon R9 Fury, Fury X and Fury Nano GPUs (codenamed "Fiji"), and 6th Generation AMD A-series APU processors (codenamed "Carrizo").
Bug Fixes
As with every release, we included many bug fixes. Check the release notes for a complete list.
Download and Support
CodeXL is available for download from the GPUOpen CodeXL page. Please use the CodeXL Issues Page to provide feedback about CodeXL and for support requests.
View at TechPowerUp Main Site
To encourage 3rd party contribution and adoption, CodeXL is no longer branded as an AMD product. AMD will still continue development of this tool and upload new CodeXL versions and features to GPUOpen.


Frame Analysis Mode
A new mode has been introduced into CodeXL 2.0 - Frame Analysis Mode.
This new component, currently released in Beta stage, is aimed towards developers focused on game development. With it, you can capture a render frame from a Microsoft DirectX 12 application, and view its render timeline and CPU and GPU execution block details.
A new sample application has been added, to enable experimentation with the new mode.
Debug Mode
Host code debugging is now supported in the Visual Studio extension (32-bit native C/C++ code only) and Linux version of CodeXL.
This new feature upgrades CodeXL from an API-level debugger to a full-fledged debugger on the host (CPU) side - including source code breakpoints, application stepping, locals and watch expression evaluation, while retaining the OpenCL kernel debugging capabilities in the same debug session!
Analyze Mode
Analyze Mode now features support for Vulkan GLSL shaders, including ISA generation and performance statistics.
Also new in this version is support for GLSL programs (both OpenGL and Vulkan shaders). Combine your shaders to be linked in a complete program, providing more accurate ISA and performance statistics.
OpenGL and DirectX shader binaries can now be exported for comparison or inclusion in applications.
Profile Mode
CodeXL 2.0's Power Profiling mode includes the long-awaited feature of attributing samples to specific processes, allowing you to not only know when power is used by the system, but also by whom!
Cross-platform (Windows-to-Linux and Linux-to-Windows) Remote GPU profiling is now supported in the GPU Profiler.
Visual Studio 2015 extension
The CodeXL Visual Studio extension now supports Visual Studio 2015.
Heterogeneous System Architecture (HSA)
CodeXL HSA Profiler and HSAIL Kernel Debugger now support the Boltzmann initiative driver, on AMD Radeon R9 Fury, Fury X and Fury Nano GPUs (codenamed "Fiji"), and 6th Generation AMD A-series APU processors (codenamed "Carrizo").
Bug Fixes
As with every release, we included many bug fixes. Check the release notes for a complete list.
Download and Support
CodeXL is available for download from the GPUOpen CodeXL page. Please use the CodeXL Issues Page to provide feedback about CodeXL and for support requests.
View at TechPowerUp Main Site


