 3
3
Kolink Continuum 1200 W Review
Efficiency, Temperatures & Noise »Test Setup

All measurements were performed using two Chroma 6314A mainframes equipped with the following electronic loads: six 63123A [350 W each], one 63102A [100 W x2], and one 63101A [200 W]. The aforementioned equipment is able to deliver 2500 W of load, and all loads are controlled by a custom-made software. The AC source is a Chroma 6530 capable of delivering up to 3 kW of power. We also used a Keysight DSOX3024A oscilloscope, Rigol DS2072A oscilloscope kindly sponsored by Batronix, Picoscope 3424 oscilloscope, Picotech TC-08 thermocouple data logger, two Fluke multimeters (models 289 and 175), a Keithley 2015 THD 6.5 digit bench DMM, and a lab-grade N4L PPA1530 3-phase power analyzer along with a Yokogawa WT210 power meter. We also included a wooden box, which, along with some heating elements, was used as a hot box. Finally, we had at our disposal three more oscilloscopes (Rigol VS5042, Stingray DS1M12, and a second Picoscope 3424), and a Class 1 Bruel & Kjaer 2250-L G4 Sound Analyzer equipped with a type 4189 microphone that features a 16.6-140 dBA-weighted dynamic range. You will find more details about our equipment and the review methodology we follow in this article. We also conduct all of our tests at 40 °C - 45 °C ambient to simulate the environment seen inside a typical system more accurately, with 40 °C - 45 °C being derived from a standard ambient assumption of 23 °C and 17 °C - 22 °C being added for the typical temperature rise within a system.
To control the Chroma 6530 source, we use a GPIB-USB controller, which avoids its very picky Serial port. This controller was kindly provided by Prologix.
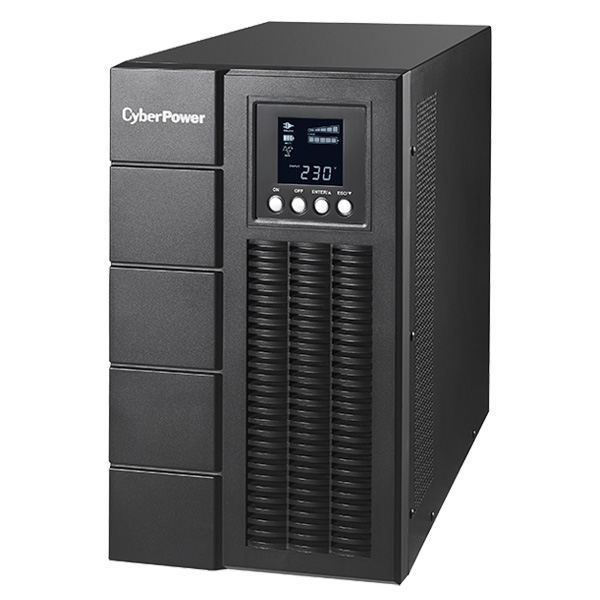
We use an OLS3000E online UPS with a capacity of 3000VA/2700W to protect our very expensive Chroma AC source.
OLS3000E kindly provided by: |
Primary Rails Load Regulation
The following charts show the voltage values of the main rails, recorded over a range from 60 W to the maximum specified load, and the deviation (in percent) for the same load range.


5VSB Regulation
The following chart shows how the 5VSB rail deals with the load we throw at it.

Hold-up Time
Hold-up time is a very important PSU characteristic and represents the amount of time, usually measured in milliseconds, a PSU can maintain its output regulations as defined by the ATX spec without input power. In other words, it is the amount of time the system can continue to run without shutting down or rebooting during a power interruption. The ATX specification sets the minimum hold-up time to 17 ms with the maximum continuous output load.According to the ATX spec, the PWR_OK is a "power good" signal. This signal should be asserted as high, at 5V, by the power supply to indicate that the +12V, 5V, and 3.3V outputs are within the regulation thresholds and that sufficient mains energy is stored by the APFC converter to guarantee continuous power operation within spec for at least 17 ms. Conversely, PWR_OK should be de-asserted to a low state, 0V, when any of the +12V, 5V, or 3.3V output voltages fall below their under-voltage threshold or when mains power has been removed for a sufficiently long time, such that the power supply's operation cannot be guaranteed. The AC loss to PWR_OK minimum hold-up time is supposed to at least be 16 ms, which is less than the hold-up time described in the paragraph above since the ATX specification also sets a PWR_OK inactive to DC loss delay which should be more than 1 ms. This means that the AC loss to PWR_OK hold-up time should always be lower than the overall hold-up time to ensures that the power supply never continues to send a power good signal while any of the +12V, 5V, and 3.3V rails are out of spec.
In the following screenshots, the blue line is the mains signal, the green line is the "Power Good" signal, and the yellow line represents the +12V rail.
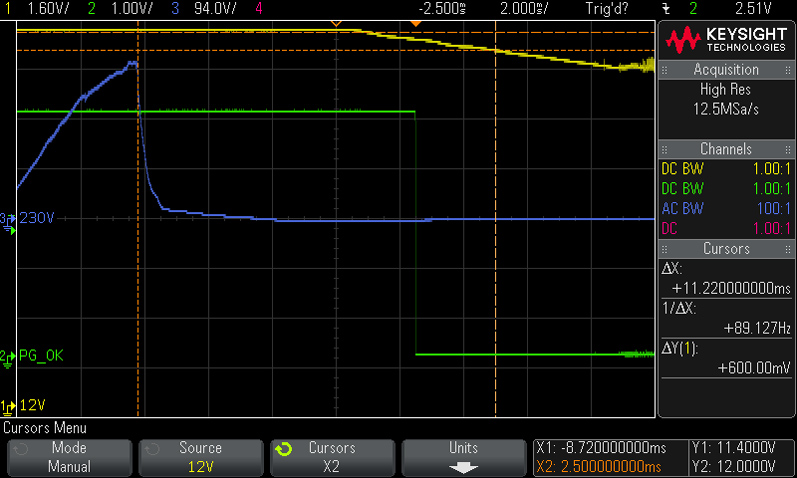
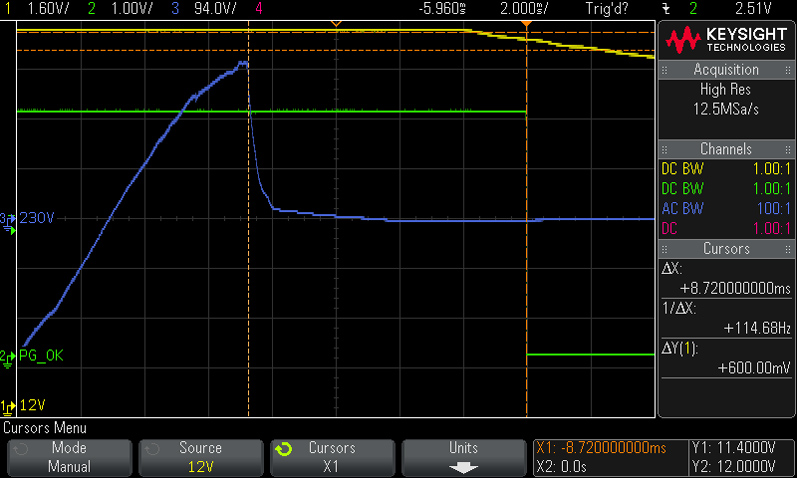
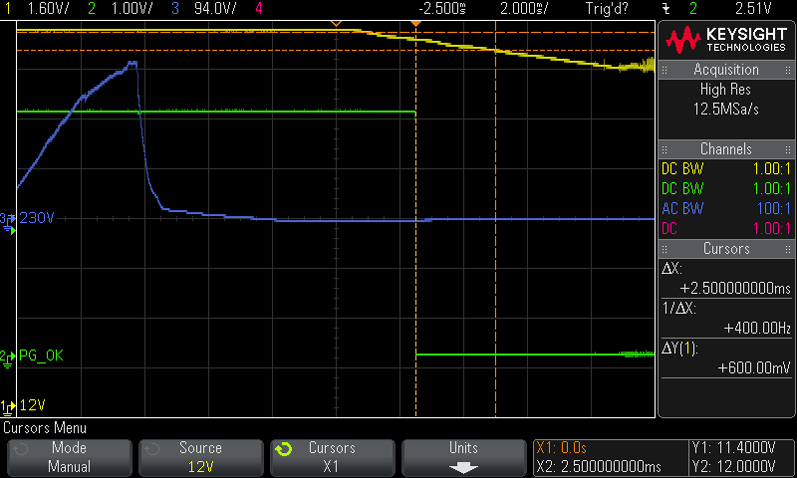


Hold-up time might be quite low, but the power ok signal is at least accurate.
Inrush Current
Inrush current or switch-on surge refers to the maximum, instantaneous input current drawn by an electrical device when it is first turned on. Because of the charging current of the APFC capacitor(s), PSUs produce large inrush current right as they are turned on. Large inrush current can cause the tripping of circuit breakers and fuses and may also damage switches, relays, and bridge rectifiers; as a result, the lower the inrush current of a PSU right as it is turned on, the better.
The absence of proper inrush-current protection leads to very high currents during the unit's start-up phase, especially when the bulk caps are discharged. If the bulk caps had the proper capacity to meet this PSU's needs, inrush current would also be significantly higher.
Load Regulation and Efficiency Measurements
The first set of tests revealed the stability of the voltage rails and the unit's efficiency. The applied load was equal to (approximately) 10%-110% of the maximum load the PSU can handle, in 10% steps.We conducted two additional tests. In the first test, we stressed the two minor rails (5V and 3.3V) with a high load while the load at +12V was only 0.10 A. This test reveals whether the PSU is Haswell ready or not. In the second test, we dialed the maximum load the +12V rail could handle while the load on the minor rails was minimal.
| Load Regulation & Efficiency Testing Data - Kolink KL-C1200PL | ||||||||||
|---|---|---|---|---|---|---|---|---|---|---|
| Test | 12 V | 5 V | 3.3 V | 5VSB | Power (DC/AC) | Efficiency | Fan Speed | Fan Noise | Temp (In/Out) | PF/AC Volts |
| 10% Load | 7.946A | 1.944A | 1.955A | 0.975A | 119.772W | 89.707% | 975 RPM | 35.1 dB(A) | 39.88°C | 0.866 |
| 12.359V | 5.142V | 3.373V | 5.105V | 133.514W | 41.88°C | 230.26V | ||||
| 20% Load | 16.921A | 2.922A | 2.937A | 1.176A | 239.664W | 92.878% | 1020 RPM | 36.4 dB(A) | 39.95°C | 0.917 |
| 12.339V | 5.133V | 3.367V | 5.093V | 258.041W | 42.37°C | 230.27V | ||||
| 30% Load | 26.275A | 3.415A | 3.451A | 1.376A | 359.828W | 93.573% | 1070 RPM | 37.3 dB(A) | 40.39°C | 0.940 |
| 12.321V | 5.127V | 3.360V | 5.079V | 384.541W | 43.25°C | 230.27V | ||||
| 40% Load | 35.638A | 3.902A | 3.932A | 1.576A | 479.569W | 93.708% | 1110 RPM | 37.7 dB(A) | 40.65°C | 0.951 |
| 12.302V | 5.119V | 3.355V | 5.066V | 511.770W | 43.96°C | 230.28V | ||||
| 50% Load | 44.703A | 4.892A | 4.929A | 1.781A | 599.544W | 93.498% | 1135 RPM | 39.8 dB(A) | 41.03°C | 0.957 |
| 12.282V | 5.111V | 3.347V | 5.054V | 641.237W | 44.96°C | 230.28V | ||||
| 60% Load | 53.786A | 5.875A | 5.925A | 1.981A | 719.328W | 93.175% | 1220 RPM | 41.7 dB(A) | 42.03°C | 0.963 |
| 12.263V | 5.102V | 3.340V | 5.041V | 772.015W | 46.48°C | 230.28V | ||||
| 70% Load | 62.908A | 6.871A | 6.929A | 2.185A | 839.214W | 92.769% | 1280 RPM | 42.9 dB(A) | 43.00°C | 0.966 |
| 12.242V | 5.095V | 3.334V | 5.028V | 904.627W | 47.98°C | 230.27V | ||||
| 80% Load | 72.056A | 7.869A | 7.933A | 2.391A | 959.069W | 92.274% | 1345 RPM | 44.7 dB(A) | 43.41°C | 0.970 |
| 12.222V | 5.087V | 3.326V | 5.013V | 1039.368W | 49.27°C | 230.28V | ||||
| 90% Load | 81.664A | 8.371A | 8.465A | 2.396A | 1078.999W | 91.787% | 1500 RPM | 46.7 dB(A) | 44.16°C | 0.973 |
| 12.201V | 5.080V | 3.319V | 5.007V | 1175.544W | 50.74°C | 230.28V | ||||
| 100% Load | 91.076A | 8.879A | 8.966A | 3.012A | 1198.841W | 91.254% | 1520 RPM | 47.5 dB(A) | 44.46°C | 0.974 |
| 12.178V | 5.072V | 3.312V | 4.976V | 1313.735W | 52.57°C | 230.28V | ||||
| 110% Load | 101.070A | 8.887A | 8.981A | 3.015A | 1318.708W | 90.741% | 1520 RPM | 47.5 dB(A) | 45.32°C | 0.975 |
| 12.160V | 5.065V | 3.307V | 4.970V | 1453.273W | 54.19°C | 230.28V | ||||
| Crossload 1 | 0.098A | 16.026A | 16.006A | 0.003A | 136.932W | 84.318% | 1300 RPM | 42.6 dB(A) | 43.08°C | 0.882 |
| 12.357V | 5.117V | 3.355V | 5.161V | 162.399W | 48.14°C | 230.29V | ||||
| Crossload 2 | 99.938A | 1.002A | 1.003A | 1.002A | 1229.938W | 91.437% | 1520 RPM | 47.5 dB(A) | 45.27°C | 0.974 |
| 12.172V | 5.086V | 3.324V | 5.052V | 1345.115W | 53.39°C | 230.29V | ||||
Apr 17th, 2025 01:41 EDT
change timezone
Latest GPU Drivers
New Forum Posts
- Need advice RAM for Asus Maximus hero z890 + core ultra 7 265k (33)
- Advice for DDR5 CU-DIMM 2 x 24gb 8400mhz (32)
- How to relubricate a fan and/or service a troublesome/noisy fan. (241)
- EVGA 3070ti hotspot is too high 107.7° (10)
- Windows 11 fresh install to do list (37)
- Will you buy a RTX 5090? (479)
- 5070 Ti power limit questions (42)
- 3DMARK "LEGENDARY" (298)
- Help needed OC on Intel 285k (0)
- Technical Issues - TPU Main Site & Forum (2025) (99)
Popular Reviews
- G.SKILL Trident Z5 NEO RGB DDR5-6000 32 GB CL26 Review - AMD EXPO
- ASUS GeForce RTX 5060 Ti TUF OC 16 GB Review
- ASUS GeForce RTX 5080 TUF OC Review
- NVIDIA GeForce RTX 5060 Ti PCI-Express x8 Scaling
- DAREU A950 Wing Review
- Palit GeForce RTX 5060 Ti Infinity 3 16 GB Review
- The Last Of Us Part 2 Performance Benchmark Review - 30 GPUs Compared
- ASUS GeForce RTX 5060 Ti Prime OC 16 GB Review
- Zotac GeForce RTX 5060 Ti AMP 16 GB Review
- Sapphire Radeon RX 9070 XT Pulse Review
Controversial News Posts
- NVIDIA GeForce RTX 5060 Ti 16 GB SKU Likely Launching at $499, According to Supply Chain Leak (182)
- NVIDIA Sends MSRP Numbers to Partners: GeForce RTX 5060 Ti 8 GB at $379, RTX 5060 Ti 16 GB at $429 (127)
- Nintendo Confirms That Switch 2 Joy-Cons Will Not Utilize Hall Effect Stick Technology (105)
- Over 200,000 Sold Radeon RX 9070 and RX 9070 XT GPUs? AMD Says No Number was Given (100)
- Nintendo Switch 2 Launches June 5 at $449.99 with New Hardware and Games (99)
- NVIDIA Launches GeForce RTX 5060 Series, Beginning with RTX 5060 Ti This Week (92)
- Sony Increases the PS5 Pricing in EMEA and ANZ by Around 25 Percent (85)
- NVIDIA PhysX and Flow Made Fully Open-Source (77)