 8
8
MSI MPG Z690 Carbon WiFi Review
Value & Conclusion »Power Consumption and Temperatures

The MSI MPG Z690 Carbon WiFi uses a single heatsink that spans across both VRM sections. It also has multiple layers of fins for better thermal dissipation with minimum airflow. Paired with 75 A power stages, the power delivery system is on the weaker side for a heavy overclock. For normal everyday use, the smaller heatsink and weaker power stages compared to the higher-end of the spectrum are not disconcerting.
| Intel Core i7-12700K Stock CPU | |
|---|---|
| CPU Voltage: | 0.577–1.280 V |
| DRAM Voltage: | 1.35 V |
| Idle Power: | 11–22 W |
| Load Power: | 220 W |
| Intel Core i7-12700K 4 GHz (P) / 3.6 GHz (E) CPU | |
| CPU Voltage: | 1.35 V |
| DRAM Voltage: | 1.35 V |
| Idle Power: | 50 W |
| Load Power: | 288 W |
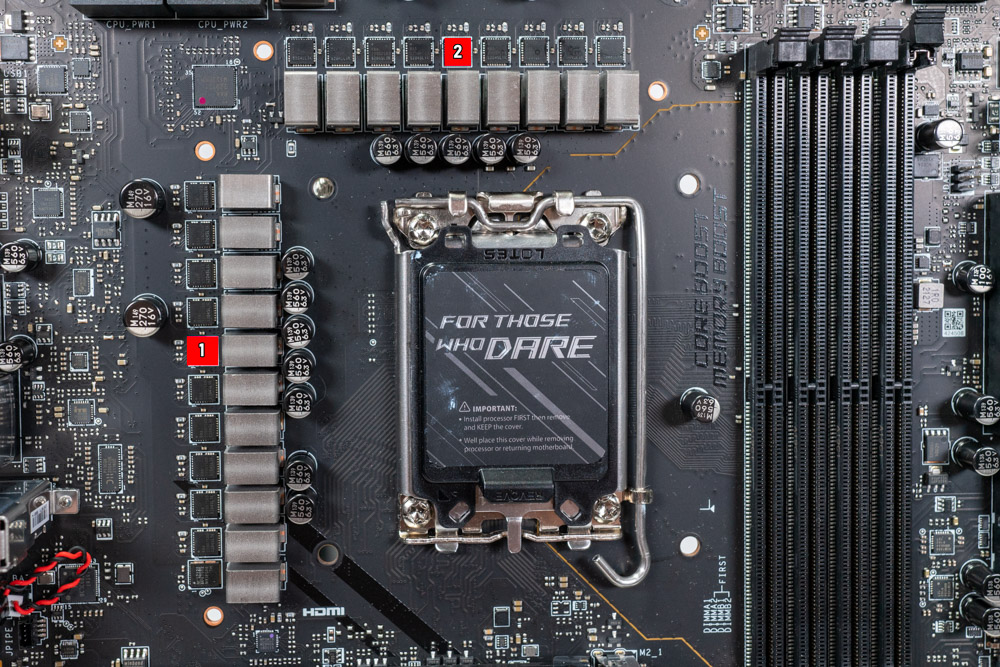
For temperature measurement, I use a Reed SD-947 4 channel Data Logging Thermometer paired with four Omega Engineering SA1 Self Adhesive Thermocouple probes. One probe directly touches the chipset and two are placed on select power stages. The last probe actively logs the ambient temperature.
For the MSI MPG Z690 Carbon WiFi, one probe is placed along each bank of power stages. A probe is left out to log the ambient temperature. All temperatures are presented as Delta-T normalized to 20°C, which is the measured temperature minus the ambient temperature plus 20°C. The end result accounts for variation in ambient temperature, including changes over the course of a test, while presenting the data as if the ambient were a steady 20°C for easy presentation. Additionally, there is direct airflow over the VRM for the first five minutes, after which the fan is removed. This gives an idea of what to expect with and without moderate case airflow.
Prime95 is used for maximum power consumption over a 30 minute period. For testing, I used an Intel Core i7-12700K set to 4.0 GHz and locked at 1.35 V. The clock speed was lowered to keep it below 300 watts for core temperature control. Temperatures are logged every second, and the two probes are then averaged for a cleaner presentation before subtracting the ambient to calculate the Delta-T. The results are charted below.

I split this into two tests, which I will probably continue to do time allowing. First off, you can see in the chart that Prime95 is brutal on the VRM during the torture test. It is fairly unrealistic for everyday use as Cinebench R20 only consumes 250 watts at 5.0 GHz as opposed to nearly 300 watts with Prime95 at 4.0 GHz. The AIDA64 system stability test comes in third place with 210 watts consumed, also overclocked to 5.0 GHz.
The MSI MPG Z690 Carbon WiFi in part did poorly in the VRM torture test because of the smaller VRM heatsink. However, the 75 A power stages did not help the situation. With a fan directly on the VRM section for the first 5 minutes, neither probe area plateaued and only continuously rose. Once the fan was removed after 5 minutes, temperatures quickly rose until the torture test was over, reaching upwards of 95°C by the end.

These shockingly high temperatures during the torture test prompted me to see what a stock CPU running Prime95 would look like. After all, Prime95 had drawn a lot of current. I was curious how well this motherboard's VRM would hold up under a practical use case. The results clearly show that the VRM is designed around moderate use instead of an all-core overclock. Those looking to overclock one or two cores with an offset should not be concerned. Those who want to run a daily 5+ GHz all-core overclock may need to reconsidering depending on the applications used.
Feb 6th, 2025 19:16 EST
change timezone
Latest GPU Drivers
New Forum Posts
- Should I make a thermal maintenance on my GPU? (9)
- TECHPOWERUP HWBOT Contest Submissions List (60)
- AM4 and Combining Different RAM? (16)
- RTX 2070 Super build (56)
- anyone use thermalright 360 AIO? (8)
- Post your Monster Hunter Wilds benchmark scores (44)
- i5-14600k owners can you test 65w pl1 and 100w pl2? (11)
- Free Games Thread (4428)
- Optane / 3DXPoint - legacy and fate (5)
- I just got Primo Cache yesterday and it looks promising! (11)
Popular Reviews
- Kingdom Come Deliverance II Performance Benchmark Review - 35 GPUs Tested
- Spider-Man 2 Performance Benchmark Review - 35 GPUs Tested
- Corsair Frame 4000D Review
- Formovie Cinema Edge 4K UST Laser Projector Review
- NVIDIA GeForce RTX 5080 Founders Edition Review
- Gigabyte GeForce RTX 5080 Gaming OC Review
- MSI GeForce RTX 5080 Vanguard SOC Review
- Dan Clark Audio NOIRE X Closed-Back Headphones Review
- AMD Ryzen 7 9800X3D Review - The Best Gaming Processor
- Marvel's Spider-Man 2 Handheld Performance Review
Controversial News Posts
- NVIDIA 2025 International CES Keynote: Liveblog (470)
- AMD Radeon 9070 XT Rumored to Outpace RTX 5070 Ti by Almost 15% (285)
- AMD is Taking Time with Radeon RX 9000 to Optimize Software and FSR 4 (256)
- AMD Denies Radeon RX 9070 XT $899 USD Starting Price Point Rumors (239)
- Edward Snowden Lashes Out at NVIDIA Over GeForce RTX 50 Pricing And Value (235)
- AMD Radeon RX 9070 XT & RX 9070 Custom Models In Stock at European Stores (226)
- New Leak Reveals NVIDIA RTX 5080 Is Slower Than RTX 4090 (215)
- AMD's Radeon RX 9070 Launch Faces Pricing Hurdles (175)