 11
11
Super Flower Leadex III 850 W Review
Cross Load Tests »Test Setup

Primary Rails Load Regulation
The following charts show the voltage values of the main rails, recorded over a range from 60 W to the maximum specified load, and the deviation (in percent) for the same load range. Tight load regulation is important in a power supply because it allows for consistent voltage levels despite changes in the load.


5VSB Regulation


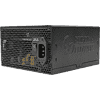
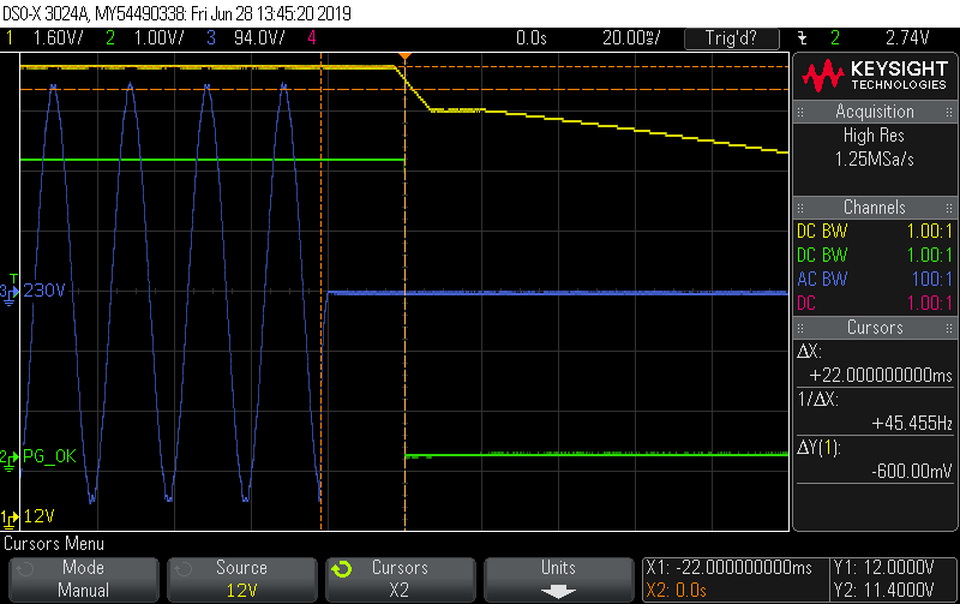
Hold-up Time
Hold-up time represents the amount of time, usually measured in milliseconds, a PSU can maintain output regulations as defined by the ATX specification without input power. Hold-up time is the amount of time the system can continue to run without shutting down or rebooting during a power interruption. In the following screenshots, the blue line is the mains signal and the green line is the "Power Good" signal, while the yellow line represents the +12V rail.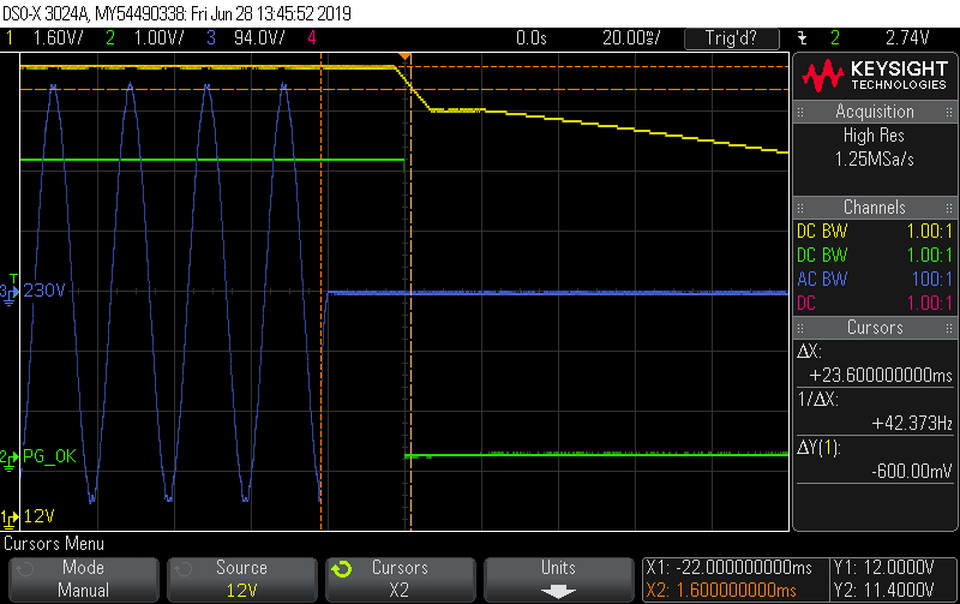


Inrush Current
Inrush current, or switch-on surge, refers to the maximum instantaneous input current drawn by an electrical device when it is first turned on. Large enough inrush current can cause the tripping of circuit breakers and fuses and may also damage switches, relays, and bridge rectifiers. As a result, the lower the inrush current of a PSU right as it is turned on, the better.
10-110% Load Testing
These tests reveal the PSU's load regulation and efficiency levels under high ambient temperatures. They also show how the fan speed profile behaves under tough operating conditions.| Load Regulation & Efficiency Testing Data - Super Flower SF-850F14HG | ||||||||||
|---|---|---|---|---|---|---|---|---|---|---|
| Test | 12 V | 5 V | 3.3 V | 5VSB | Power (DC/AC) | Efficiency | Fan Speed | PSU Noise | Temp (In/Out) | PF/AC Volts |
| 10% Load | 5.206A | 1.996A | 1.995A | 0.987A | 84.951W | 87.953% | 0 RPM | <6.0 dB(A) | 43.33°C | 0.732 |
| 12.167V | 5.013V | 3.309V | 5.068V | 96.587W | 40.03°C | 230.28V | ||||
| 20% Load | 11.399A | 2.998A | 2.998A | 1.187A | 169.465W | 90.763% | 0 RPM | <6.0 dB(A) | 44.48°C | 0.890 |
| 12.155V | 5.005V | 3.303V | 5.056V | 186.712W | 40.74°C | 230.28V | ||||
| 30% Load | 17.996A | 3.501A | 3.485A | 1.388A | 254.546W | 91.904% | 0 RPM | <6.0 dB(A) | 45.41°C | 0.939 |
| 12.144V | 5.001V | 3.298V | 5.044V | 276.970W | 41.32°C | 230.28V | ||||
| 40% Load | 24.611A | 4.003A | 4.009A | 1.590A | 339.758W | 92.411% | 0 RPM | <6.0 dB(A) | 46.57°C | 0.954 |
| 12.131V | 4.996V | 3.293V | 5.032V | 367.658W | 41.60°C | 230.28V | ||||
| 50% Load | 30.919A | 5.013A | 5.021A | 1.794A | 425.070W | 92.335% | 0 RPM | <6.0 dB(A) | 47.58°C | 0.967 |
| 12.114V | 4.989V | 3.287V | 5.019V | 460.355W | 42.02°C | 230.28V | ||||
| 60% Load | 37.158A | 6.024A | 6.035A | 1.999A | 509.584W | 91.960% | 0 RPM | <6.0 dB(A) | 48.87°C | 0.974 |
| 12.104V | 4.983V | 3.281V | 5.005V | 554.137W | 42.91°C | 230.27V | ||||
| 70% Load | 43.467A | 7.030A | 7.046A | 2.203A | 594.895W | 91.388% | 898 RPM | 18.5 dB(A) | 43.35°C | 0.980 |
| 12.096V | 4.980V | 3.279V | 4.995V | 650.953W | 49.73°C | 230.28V | ||||
| 80% Load | 49.737A | 8.042A | 8.064A | 2.409A | 680.238W | 90.939% | 1017 RPM | 22.3 dB(A) | 43.79°C | 0.983 |
| 12.100V | 4.975V | 3.274V | 4.985V | 748.016W | 50.81°C | 230.28V | ||||
| 90% Load | 56.390A | 8.550A | 8.560A | 2.410A | 765.172W | 90.329% | 1418 RPM | 32.6 dB(A) | 44.96°C | 0.985 |
| 12.106V | 4.972V | 3.271V | 4.981V | 847.099W | 52.39°C | 230.27V | ||||
| 100% Load | 62.805A | 9.062A | 9.094A | 3.027A | 849.983W | 89.749% | 1792 RPM | 40.4 dB(A) | 45.76°C | 0.987 |
| 12.105V | 4.968V | 3.266V | 4.958V | 947.067W | 53.72°C | 230.28V | ||||
| 110% Load | 69.813A | 9.068A | 9.103A | 3.030A | 934.750W | 89.188% | 2052 RPM | 44.2 dB(A) | 46.65°C | 0.989 |
| 12.104V | 4.965V | 3.263V | 4.953V | 1048.066W | 54.96°C | 230.28V | ||||
| Crossload 1 | 0.145A | 12.002A | 12.000A | 0.000A | 101.045W | 84.287% | 0 RPM | 0 dB(A) | 47.88°C | 0.793 |
| 12.132V | 4.983V | 3.290V | 5.082V | 119.882W | 42.56°C | 230.29V | ||||
| Crossload 2 | 70.882A | 1.002A | 1.002A | 1.000A | 870.904W | 90.115% | 1837 RPM | 40.0 dB(A) | 45.52°C | 0.988 |
| 12.099V | 4.985V | 3.275V | 5.026V | 966.431W | 53.19°C | 230.28V | ||||
Light Load Testing
In the following tests, we measure the PSU's efficiency at loads significantly lower than 10 percent of its maximum capacity (the lowest load the 80 PLUS standard measures). This is important for representing when a PC is idle with the power-saving features turned on.| Efficiency at Low Loads - Super Flower SF-850F14HG | |||||||||
|---|---|---|---|---|---|---|---|---|---|
| Test # | 12 V | 5 V | 3.3 V | 5 VSB | Power (DC/AC) | Efficiency | Fan Speed | PSU Noise | PF/AC Volts |
| 1 | 1.193A | 0.500A | 0.485A | 0.196A | 19.638W | 71.729% | 0 RPM | <6.0 dB(A) | 0.381 |
| 12.173V | 5.019V | 3.314V | 5.097V | 27.378W | 230.27V | ||||
| 2 | 2.443A | 0.998A | 0.998A | 0.393A | 40.045W | 81.571% | 0 RPM | <6.0 dB(A) | 0.525 |
| 12.171V | 5.016V | 3.312V | 5.090V | 49.092W | 230.27V | ||||
| 3 | 3.629A | 1.497A | 1.482A | 0.591A | 59.570W | 85.531% | 0 RPM | <6.0 dB(A) | 0.631 |
| 12.168V | 5.013V | 3.310V | 5.082V | 69.647W | 230.28V | ||||
| 4 | 4.879A | 1.996A | 1.997A | 0.789A | 79.960W | 87.586% | 0 RPM | <6.0 dB(A) | 0.714 |
| 12.164V | 5.011V | 3.308V | 5.075V | 91.293W | 230.28V | ||||
Efficiency
Using the results we gathered so far, we plotted a chart showing the PSU's efficiency at low loads, as well as loads ranging from 10 to 110 percent of its maximum-rated capacity.


Under light loads, the Super Flower unit takes the lead, but it scores last with normal loads.
5VSB Efficiency
| 5VSB Efficiency Super Flower SF-850F14HG | ||||
|---|---|---|---|---|
| Test # | 5VSB | Power (DC/AC) | Efficiency | PF/AC Volts |
| 1 | 0.100A | 0.511W | 69.241% | 0.016 |
| 5.105V | 0.738W | 230.32V | ||
| 2 | 0.250A | 1.276W | 74.576% | 0.037 |
| 5.101V | 1.711W | 230.32V | ||
| 3 | 0.550A | 2.802W | 77.190% | 0.077 |
| 5.093V | 3.630W | 230.32V | ||
| 4 | 1.000A | 5.080W | 78.613% | 0.130 |
| 5.079V | 6.462W | 230.32V | ||
| 5 | 1.500A | 7.598W | 79.502% | 0.181 |
| 5.064V | 9.557W | 230.32V | ||
| 6 | 3.001A | 15.055W | 80.246% | 0.285 |
| 5.017V | 18.761W | 230.32V | ||
The 5VSB rail is very efficient.
Power Consumption in Idle and Standby
| Idle / Standby Super Flower SF-850F14HG | ||||||
|---|---|---|---|---|---|---|
| Mode | 12 V | 5 V | 3.3 V | 5VSB | Power (AC) | PF/AC Volts |
| Idle | 12.225V | 5.026V | 3.320V | 5.104V | 5.668W | 0.113 |
| 230.3V | ||||||
| Standby | 0.085W | 0.002 | ||||
| 230.3V | ||||||
Fan RPM, Delta Temperature and Output Noise
The following results were obtained at 38–45 °C ambient.

The following results were obtained at 30–32 °C ambient. The semi-passive operation was set to Mode 0.


The following results were obtained at 30–32 °C ambient. The semi-passive operation was set to Mode 1.


Jan 22nd, 2025 01:50 EST
change timezone
Latest GPU Drivers
New Forum Posts
- 9800x 3d vs 12900k - Battle of the Century (472)
- FAN control software (8)
- TPU's Nostalgic Hardware Club (19806)
- The coffee and tea appreciation thread (99)
- Anime Nation (12956)
- RDNA4 Prediction Time!!! (4)
- What's your latest tech purchase? (22940)
- RDNA4 (RX 9070XT / 9070) launch announced for (delayed to) March 2025 (221)
- Upgrading CPU Cooler for 12600k (16)
- Your PC ATM (35197)
Popular Reviews
- NVIDIA GeForce RTX 5090 Founders Edition Unboxing
- NZXT C1500 Review
- Montech Heritage Pro Review - The Leather Case
- Fosi Audio K7 Gaming Desktop DAC/Headphone Amplifier Review
- NVIDIA GeForce RTX 50 Technical Deep Dive
- ASRock Arc B570 Challenger OC Review
- AMD Ryzen 7 9800X3D Review - The Best Gaming Processor
- be quiet! Light Loop 360 mm AIO Review
- PowerColor Alphyn AH10 Review
- Pwnage StormBreaker Max CF Review
Controversial News Posts
- NVIDIA 2025 International CES Keynote: Liveblog (468)
- AMD Debuts Radeon RX 9070 XT and RX 9070 Powered by RDNA 4, and FSR 4 (349)
- AMD Radeon RX 9070 XT & RX 9070 Custom Models In Stock at European Stores (226)
- NVIDIA GeForce RTX 5090 Features 575 W TDP, RTX 5080 Carries 360 W TDP (217)
- AMD Radeon RX 9070 XT Alleged Benchmark Leaks, Underwhelming Performance (204)
- AMD's Radeon RX 9070 Launch Faces Pricing Hurdles (173)
- Potential RTX 5090 and RTX 5080 Pricing in China Leaks (173)
- AMD Radeon RX 9070 XT Tested in Cyberpunk 2077 and Black Myth: Wukong (169)