 91
91
Denuvo Performance Cost & FPS Loss Tested
Conclusion »Performance Testing
For testing, I used my VGA review test system with the same specs, drivers, and settings as in our Devil May Cry 5 Performance Analysis article.I paid very close attention to achieving high accuracy during testing. For example, graphics cards are always heated up properly before the test run to ensure Boost Clock (which is tied to temperature) doesn't play a role in the performance results. Also, since two installations of the game are used (on the same SSD), prior to every measured test run, I did a non-measured warmup run, which prepares disk cache and ensures results do not get skewed due to random disk latency. Still, it's impossible to reach perfect accuracy as some random variation between runs is to be expected.
NVIDA RTX 2080 Ti Performance

The first round of results is for the GeForce RTX 2080 Ti, to minimize the GPU performance bottleneck and ensure the system drives as many frames per second as possible.
We begin with our default CPU speed of 4.8 GHz and scale downward to 1.00 GHz to ideally show if the performance gap widens as the CPU gets slower. At 4.8 GHz, there is virtually no difference between "Denuvo on" and "Denuvo off" (252.8 FPS vs 252.0 FPS = 0.32%). Expecting much bigger differences, I dialed down CPU frequency in several steps for both "Denuvo on" and "Denuvo off", all the way down to 1.00 GHz.
At around 3.50 GHz, we begin to see some noteworthy performance differences that, surprisingly, stay fairly constant (around 3-4%). I would have expected that with significantly less CPU performance available, the impact of Denuvo would become much bigger, but that's not the case.
In contrast, take a look at how much the frame rate tanks; we're talking over 100 FPS lost due to the processor getting weaker and weaker (from CPU frequency adjustments), yet the performance hit caused by Denuvo doesn't get bigger.
Another interesting observation is that Denuvo's performance cost isn't correlated to higher framerates either. This is strong evidence that the Denuvo checks are not executed for each frame the game renders. Rather, it looks like the checks are executed on a timer or tied to a part of the engine that's running at a fixed speed, like physics or AI.

Next, I wanted to test the impact on higher resolutions, where the game is more GPU-bound. At 1440p, we see the same results as on the 1080p chart. In GPU-bound scenarios, the performance loss is close to zero—only when the bottleneck moves to the CPU do the FPS values begin to differ by around 3% in this test, too.

Moving on to 4K, the results match the previous tests, except that the GPU bottleneck shifts on to the CPU much later, which is as expected because the GPU is having a much harder time churning out those high-res frames.
AMD Radeon RX 580 & Radeon VII

Not everybody uses a super-high-end GeForce RTX 2080 Ti, so I wanted to get some data on a more mid-range card. For this test, I picked the Radeon RX 580, which is one of the most popular cards on the market and comes at very affordable pricing. Also, it's a card from AMD, so the other camp gets tested, too. Beyond that, we have seen some anecdotal evidence that AMD's driver requires more CPU time than its NVIDIA counterpart, which could make it more susceptible to performance losses caused by Denuvo.
However, the results look nearly identical to the 4K RTX 2080 Ti chart, which isn't that surprising if you think about it. The RX 580 setup will be GPU limited most of the time, even at 1080p, because the GPU's performance is lower. Performance differences match the RTX 2080 Ti results, too, with around 3% at the 1.00 GHz data point, which is the only one that's CPU limited—there's close to no difference when GPU limited.

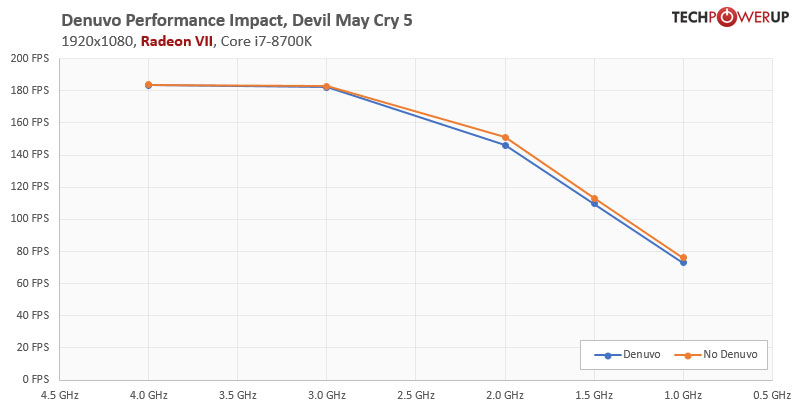
Since the RX 580 didn't give us any new insights, and I still was curious about the driver CPU usage, I did another test run, this time with AMD's Radeon VII flagship product because it will definitely give us a much higher framerate, which could reveal some potential issues.
Here again, no surprises, but this test run confirms once more: negligible performance loss when GPU-bound, 3-4% when CPU-bound.
Various CPU Core and Thread Counts

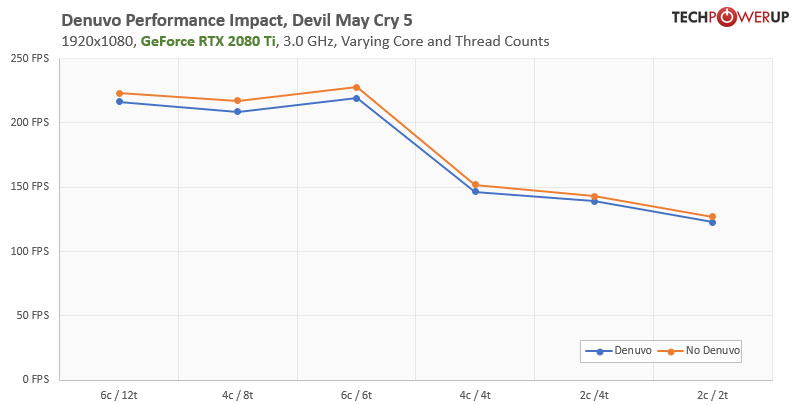
Last but not least, I wanted to look at CPU core counts. The Core i7-8700K I'm using has 6 cores and 12 threads—hardly a typical entry-level configuration for daily use. For all following tests, I've reduced the CPU clock to 3.00 GHz to match lower-end CPUs not only in terms of core configuration, but also in clock speed.
- Starting with the native 6c / 12t configuration sets a baseline (2.96% difference).
- Next, we move on to 4c / 8t, which is an extremely common scenario, as it's the configuration of highly popular CPUs, like the Core i7-7700K from early 2017, Core i7-4790K, or Core i7-2700K (4.07% difference).
- The next test result is for 6c / 6t, which matches the i7-8700K, i5-8400, i7-7800X, i7-6850K, i7-6800K, and other famous six-core SKUs (3.88%).
- Diving further into the lower end of the performance spectrum, testing at 4c / 4t represents the typical "quad-core" processor, which is seen by many as the entry level requirement into serious gaming. Popular SKUs are the i5-7600K, i3-8350K, i7-4670K, i7-3570K, i5-6500K, i7-2600 and many more. Here we see a 3.76% difference.
- For science, we added test results with two cores and four threads, which matches entry-level CPUs like the Pentium Gold G5400, i3-7100, i3-4160, i5-660 and many more from half a decade ago (2.73% difference).
- Last but not least, I wanted to see what happens with a CPU that has just two cores, which of course is completely overwhelmed with the modern game. This data point represents the most basic Atoms, Celerons, and Pentiums that really nobody uses anymore. Still, with 3.75%, the performance loss because of Denuvo isn't increasing.
Apr 9th, 2025 03:31 EDT
change timezone
Latest GPU Drivers
New Forum Posts
- 9070XT or 7900XT or 7900XTX (165)
- (Some of) What I'd like to See From a Final Fantasy IX Remake (3)
- ThrottleStop - 14900HX, 4090RTX MSI laptop (9)
- V/F Points not being respected consistantly (3)
- "The system hibernated due to a critical thermal event" - at 54c?! (2)
- Post your cooling. (209)
- PSA: if your 5070 Ti freezes up (even the mouse cursor won't move) with Furmark. Try turning off Gsync to fix it! (1)
- issue with restart after changing throttlestop settings (5)
- Stock PSU with Razer Core X with adapter to 12VHPWR (6)
- Cache Ratio stuck at 600hz lower than Turbo Cores with Ring Down Bin on (1)
Popular Reviews
- The Last Of Us Part 2 Performance Benchmark Review - 30 GPUs Compared
- MCHOSE L7 Pro Review
- UPERFECT UStation Delta Max Review - Two Screens In One
- PowerColor Radeon RX 9070 Hellhound Review
- Sapphire Radeon RX 9070 XT Pulse Review
- Upcoming Hardware Launches 2025 (Updated Apr 2025)
- Sapphire Radeon RX 9070 XT Nitro+ Review - Beating NVIDIA
- ASUS Prime X870-P Wi-Fi Review
- AMD Ryzen 7 9800X3D Review - The Best Gaming Processor
- Acer Predator GM9000 2 TB Review
Controversial News Posts
- NVIDIA GeForce RTX 5060 Ti 16 GB SKU Likely Launching at $499, According to Supply Chain Leak (164)
- MSI Doesn't Plan Radeon RX 9000 Series GPUs, Skips AMD RDNA 4 Generation Entirely (146)
- Microsoft Introduces Copilot for Gaming (124)
- AMD Radeon RX 9070 XT Reportedly Outperforms RTX 5080 Through Undervolting (119)
- NVIDIA Reportedly Prepares GeForce RTX 5060 and RTX 5060 Ti Unveil Tomorrow (115)
- Over 200,000 Sold Radeon RX 9070 and RX 9070 XT GPUs? AMD Says No Number was Given (100)
- Nintendo Switch 2 Launches June 5 at $449.99 with New Hardware and Games (98)
- NVIDIA GeForce RTX 5050, RTX 5060, and RTX 5060 Ti Specifications Leak (97)