 12
12
Glorious Model I Gaming Mouse Review
Software & Lighting »Sensor and Performance
The Glorious Model I is equipped with the BAMF, which is based on the PixArt PAW3370 sensor. According to specifications, the 3370 is capable of up to 19,000 CPI, as well as a maximum tracking speed of 400 IPS, which equals 10.16 m/s. Out of the box, four pre-defined CPI steps are available: 400, 800, 1600, and 3200.All testing was done on the latest firmware. As such, results obtained on earlier firmware versions may differ from those presented hereafter.
CPI Accuracy
"CPI" (short for counts per inch) describes the number of counts registered by the mouse if it is moved exactly an inch. There are several factors (firmware, mounting height of the sensor not meeting specifications, mouse feet thickness, mousing surface, among others) which may contribute to nominal CPI not matching actual CPI. It is impossible to always achieve a perfect match, but ideally, nominal and actual CPI should differ as little as possible. In this test, I'm determining whether this is the case or not. However, please keep in mind that said variance will still differ from unit to unit, so your mileage may vary.
I've restricted my testing to the four most common CPI steps, which are 400, 800, 1600, and 3200. As you can see, deviation is exclusively positive, highly consistent, and somewhat high, which is an average result overall. In order to account for the measured deviation, adjusted steps of 400, 800, 1550, and 3050 CPI have been used for testing.
Motion Delay
"Motion delay" encompasses all kinds of sensor lag. Any further sources of input delay will not be recorded in this test. The main thing I'll be looking for in this test is sensor smoothing, which describes an averaging of motion data across several capture frames in order to reduce jitter at higher CPI values, increasing motion delay along with it. The goal here is to have as little smoothing as possible. As there is no way to accurately measure motion delay absolutely, it can only be done by comparison with a control subject that has been determined to have the lowest possible motion delay. In this case, the control subject is a G403, whose 3366 has no visible smoothing across the entire CPI range. Note that the Model I is moved first and thus receives a slight head start.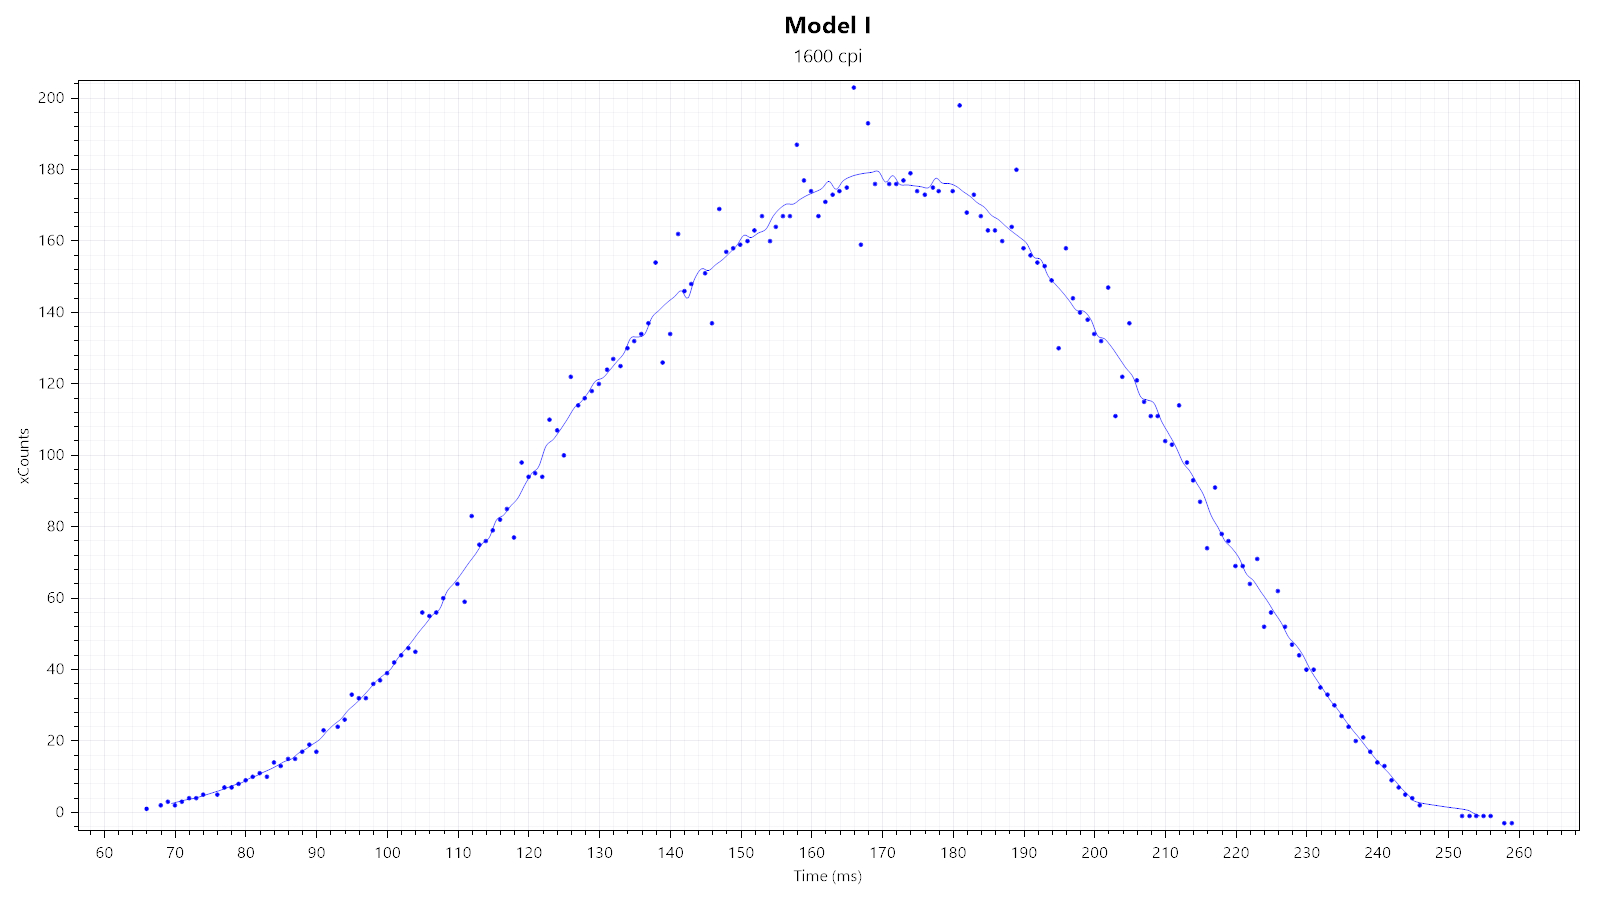
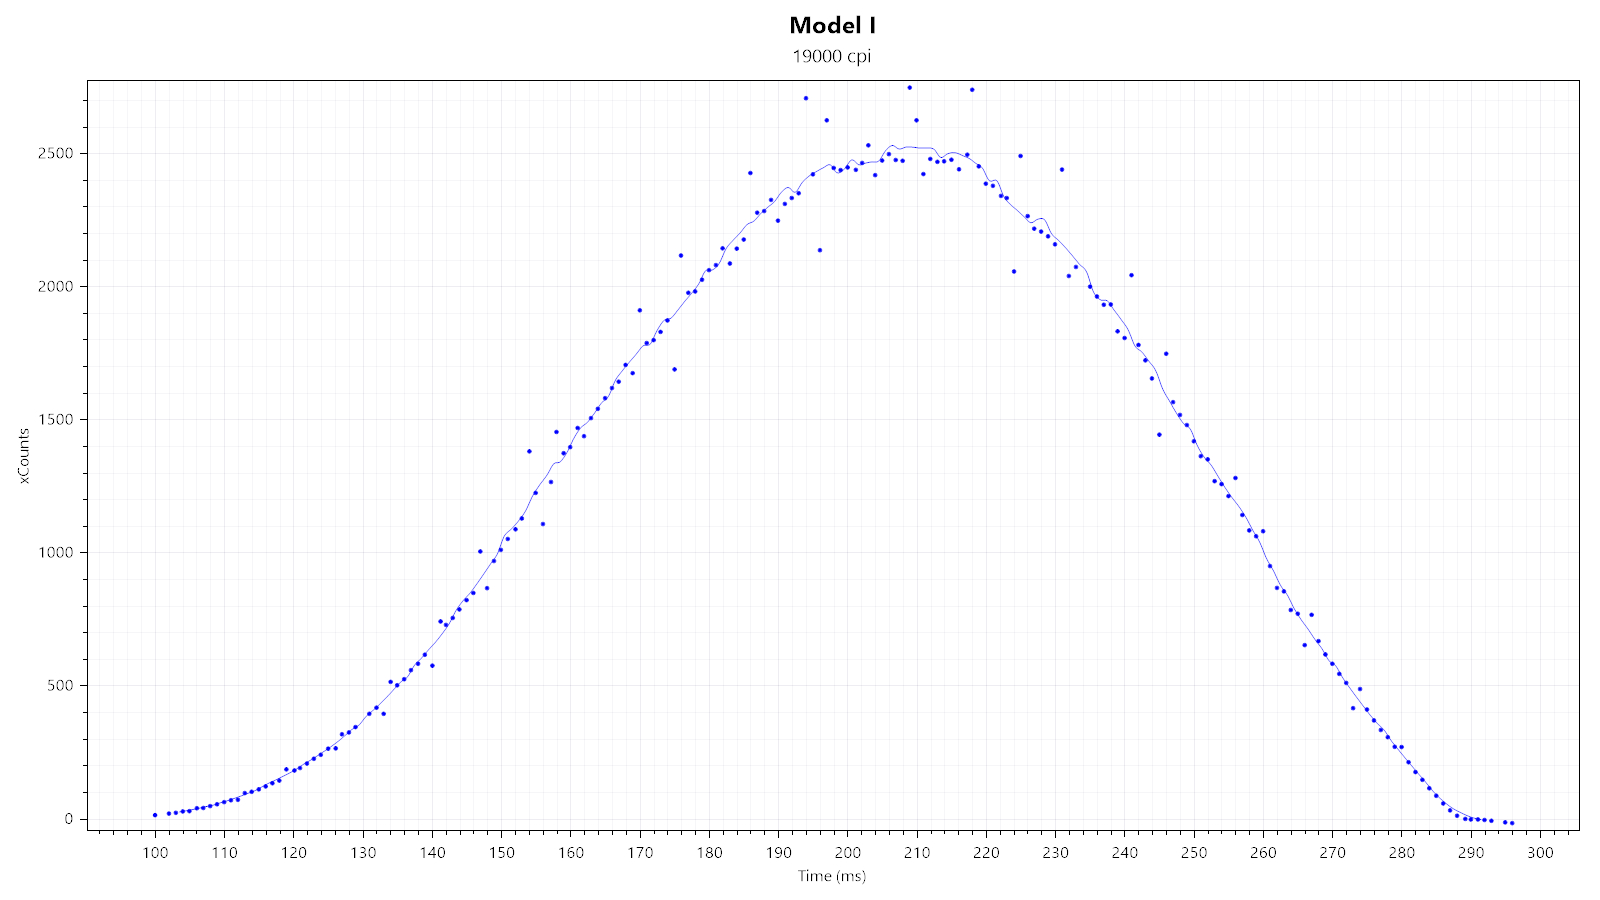
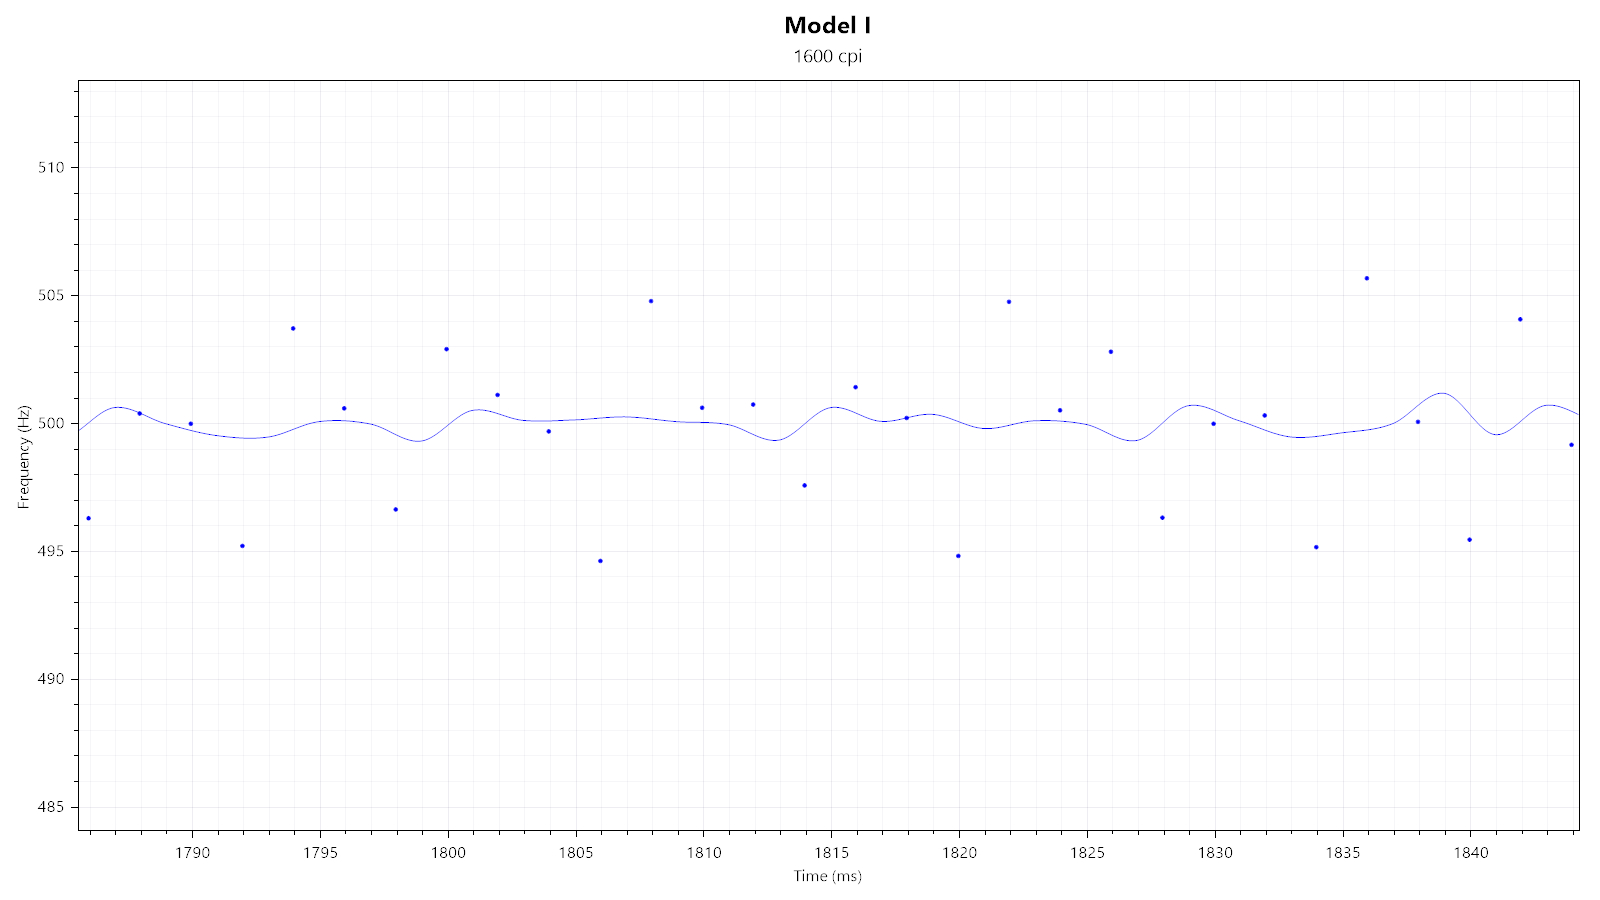
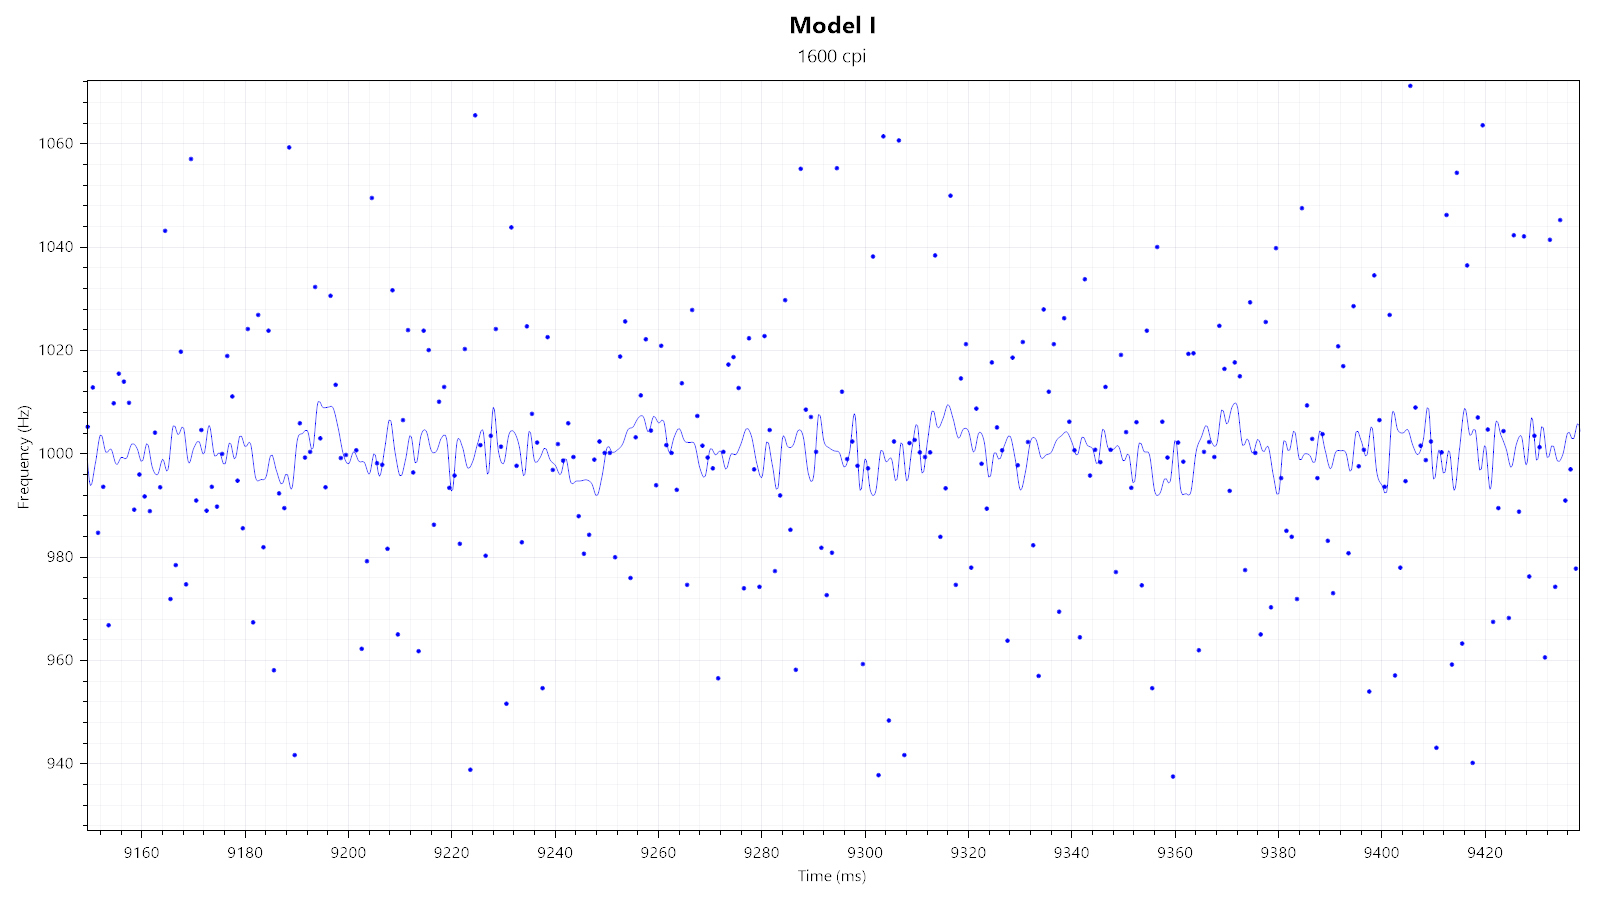
First, I'm looking at two xCounts plots—generated at 1600 and 19,000 CPI—to quickly gauge whether there is any smoothing, which would be indicated by any visible "kinks." As you can see, no such kinks are visible in either plot, which strongly suggests there not being any smoothing.
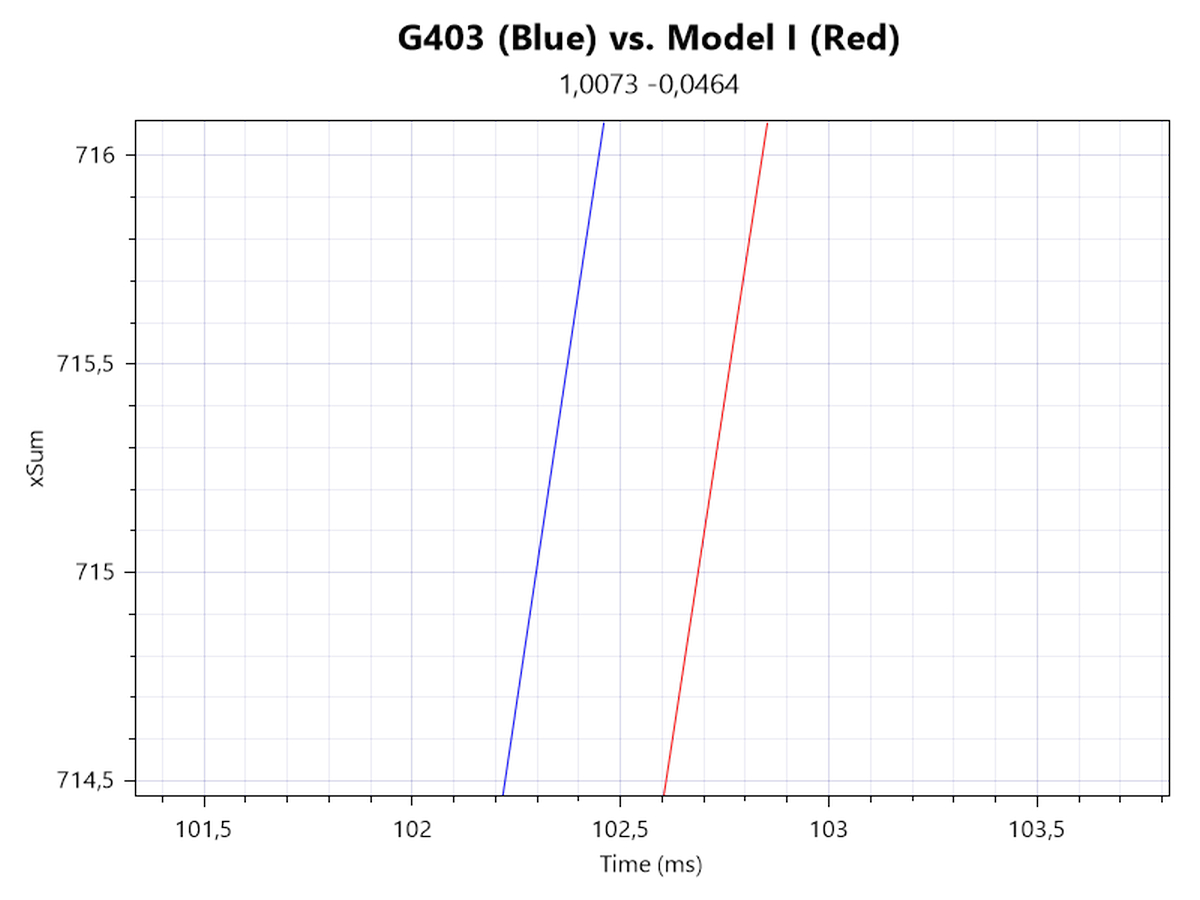
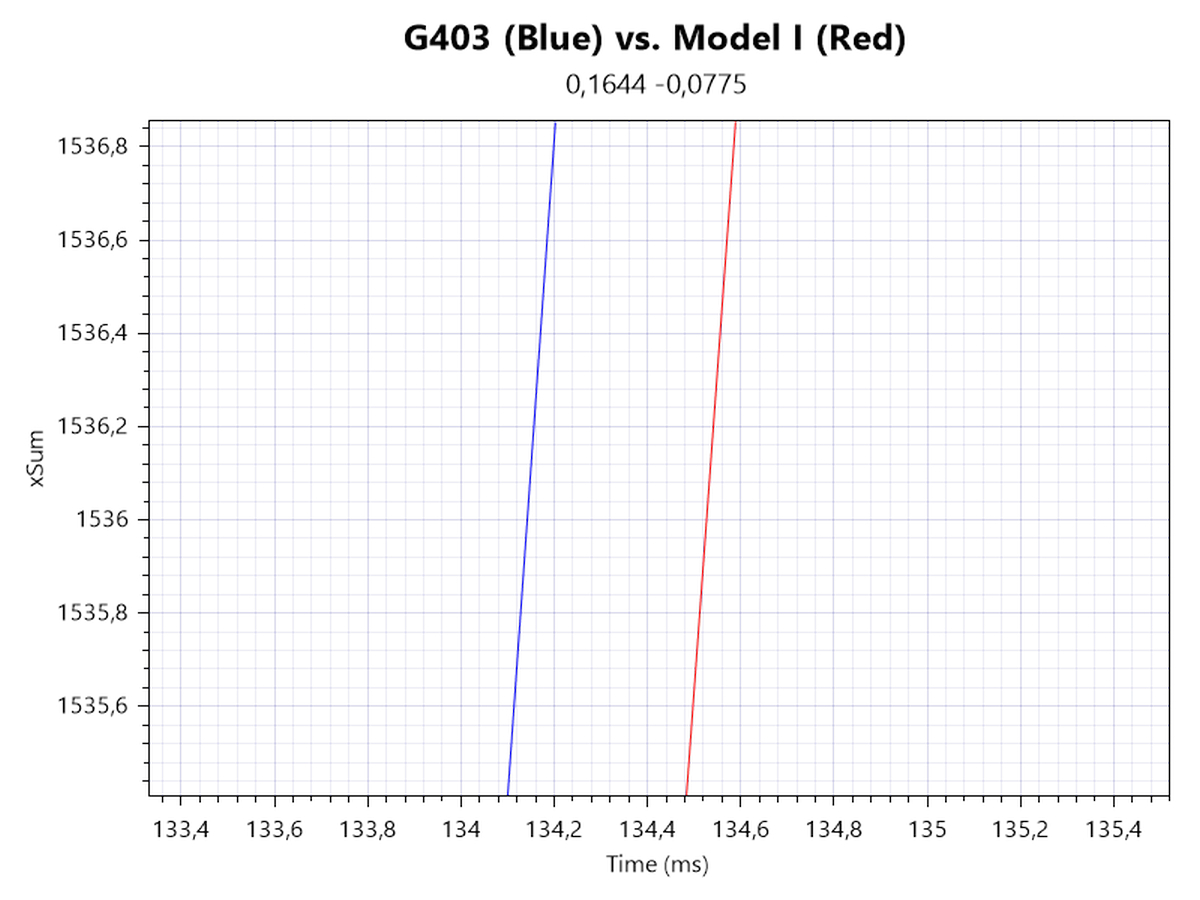
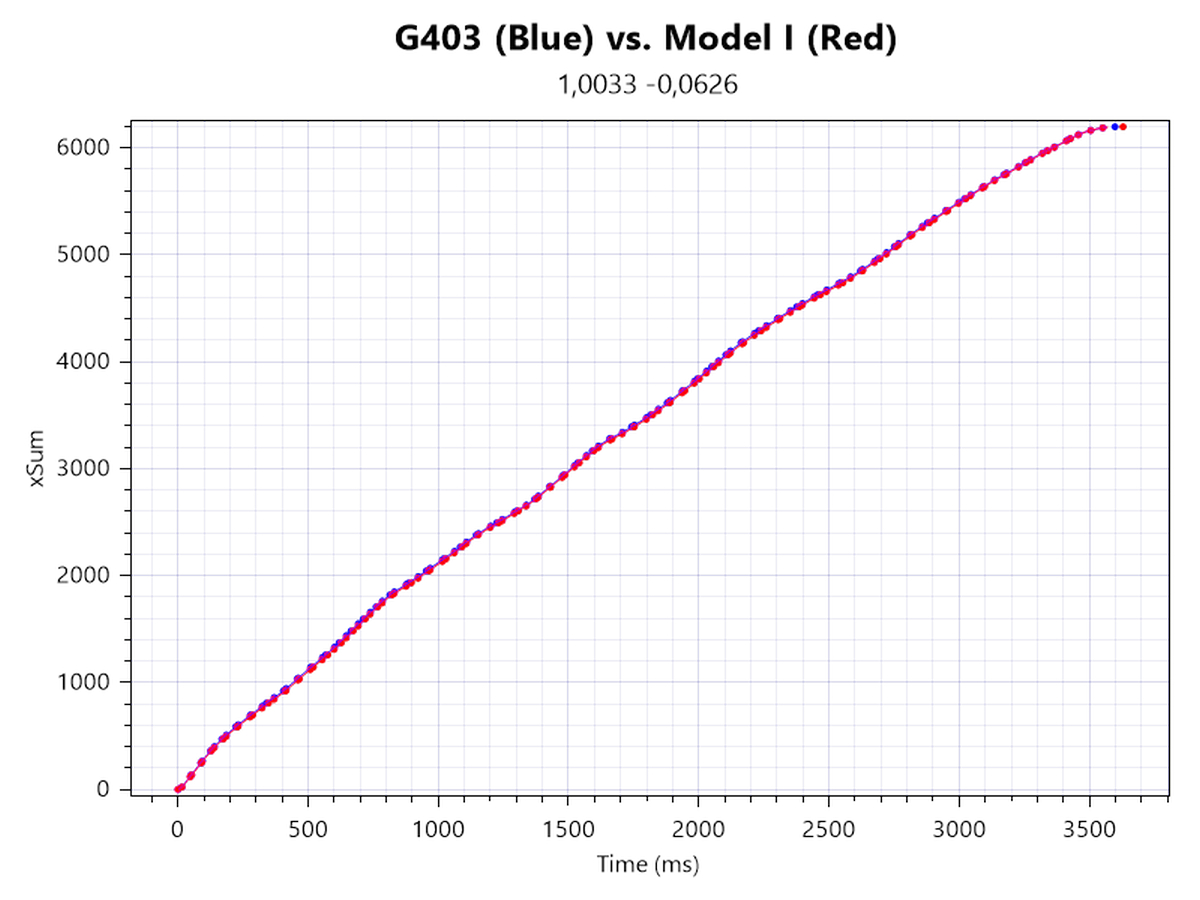
In order to determine motion delay, I'm looking at xSum plots generated at 1600 and 19,000 CPI. The line further to the left denotes the sensor with less motion delay. Neither 1600 nor 19,000 CPI show any motion delay differential, which confirms that there is no smoothing across the entire CPI range.
Speed-related Accuracy Variance (SRAV)
What people typically mean when they talk about "acceleration" is speed-related accuracy variance (or short SRAV). It's not about the mouse having a set amount of inherent positive or negative acceleration, but about the cursor not traveling the same distance if the mouse is moved the same physical distance at different speeds. The easiest way to test this is by comparison with a control subject that is known to have very low SRAV, which in this case is the G403. As you can see from the plot, no displacement between the two cursor paths can be observed, which confirms that SRAV is very low.
Perfect Control Speed
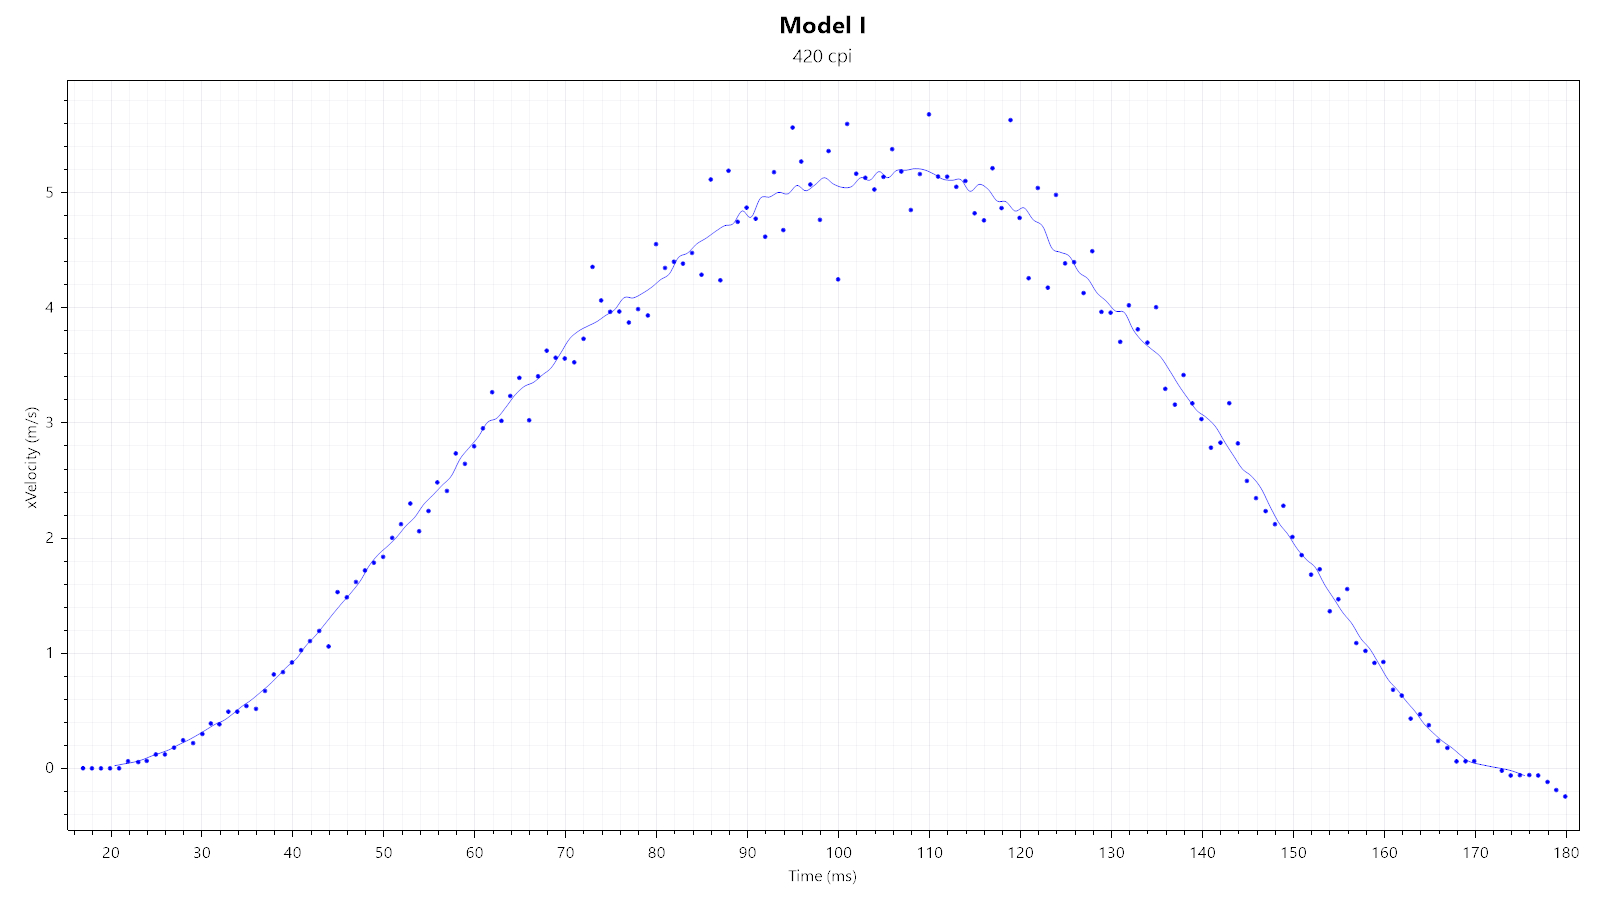
Perfect Control Speed (or PCS for short) is the maximum speed up to which the mouse and its sensor can be moved without the sensor malfunctioning in any way. I've only managed to hit a measly 5 m/s, which is within the proclaimed PCS range and causes no observable sensor malfunction.
Polling Rate Stability
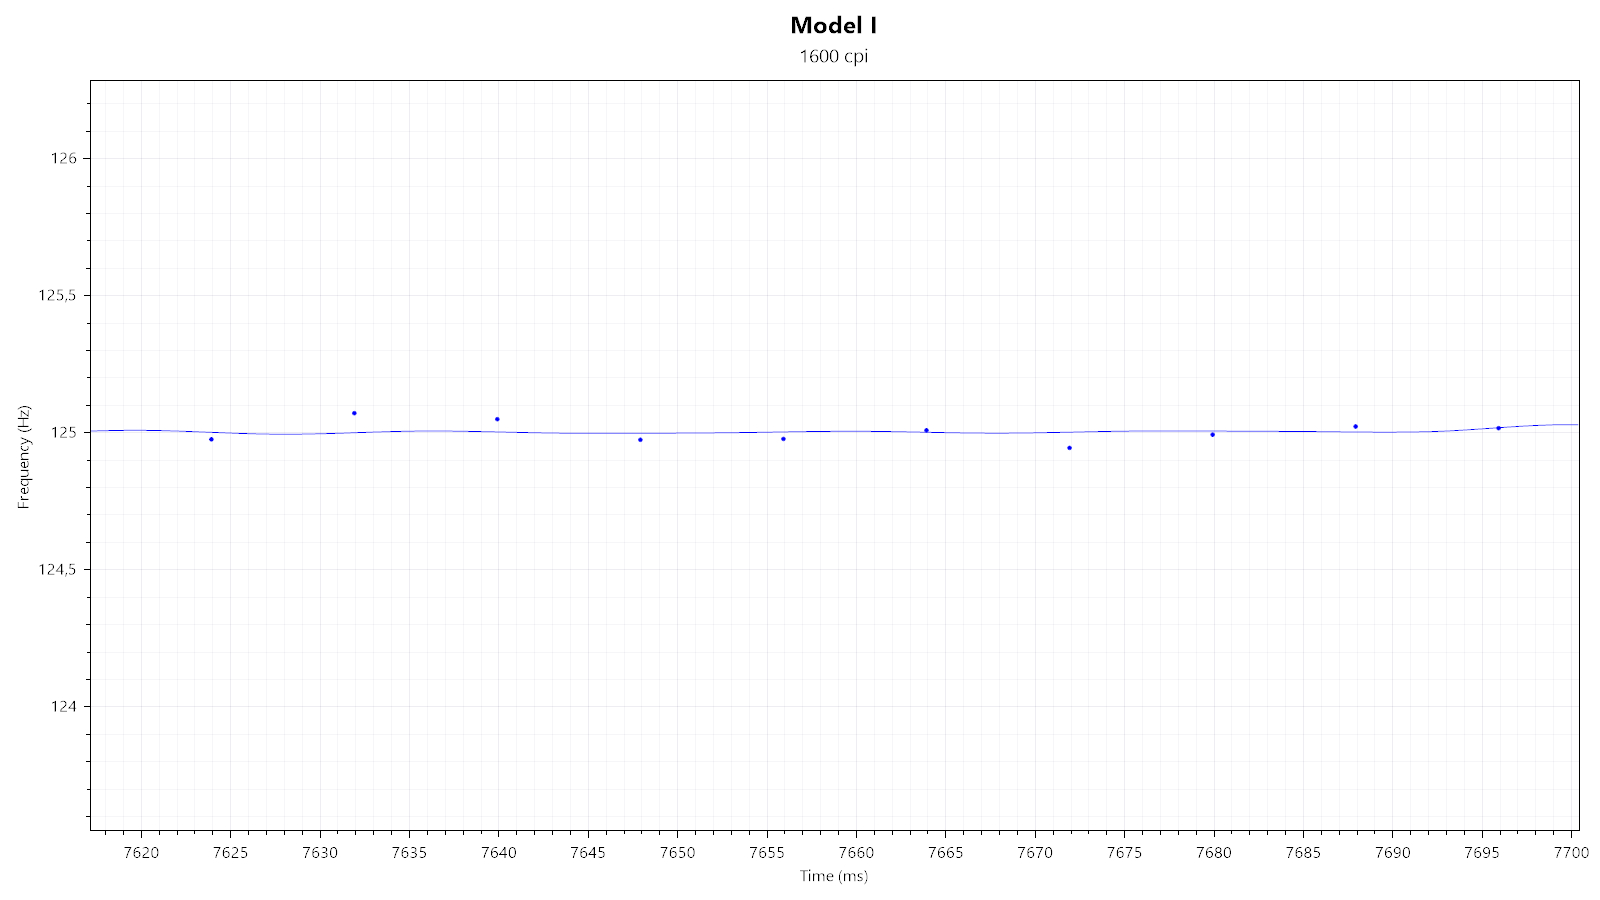
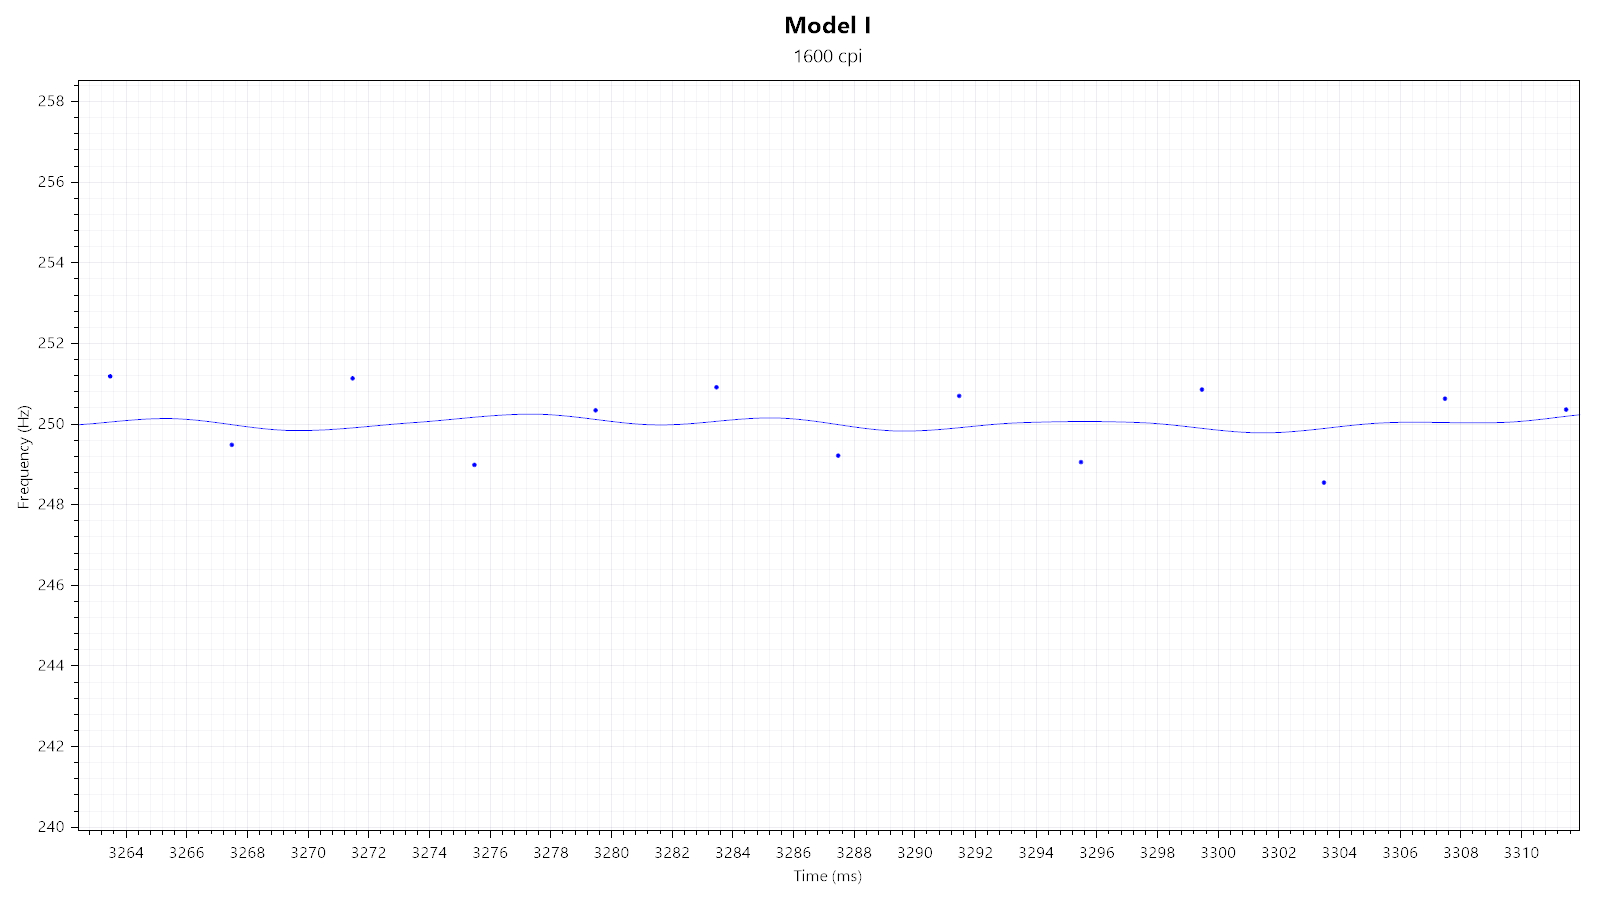
All of the four available polling rates (125, 250, 500, and 1000 Hz) look and perform fine. Polling stability is unaffected by any RGB lighting effect.
Paint Test
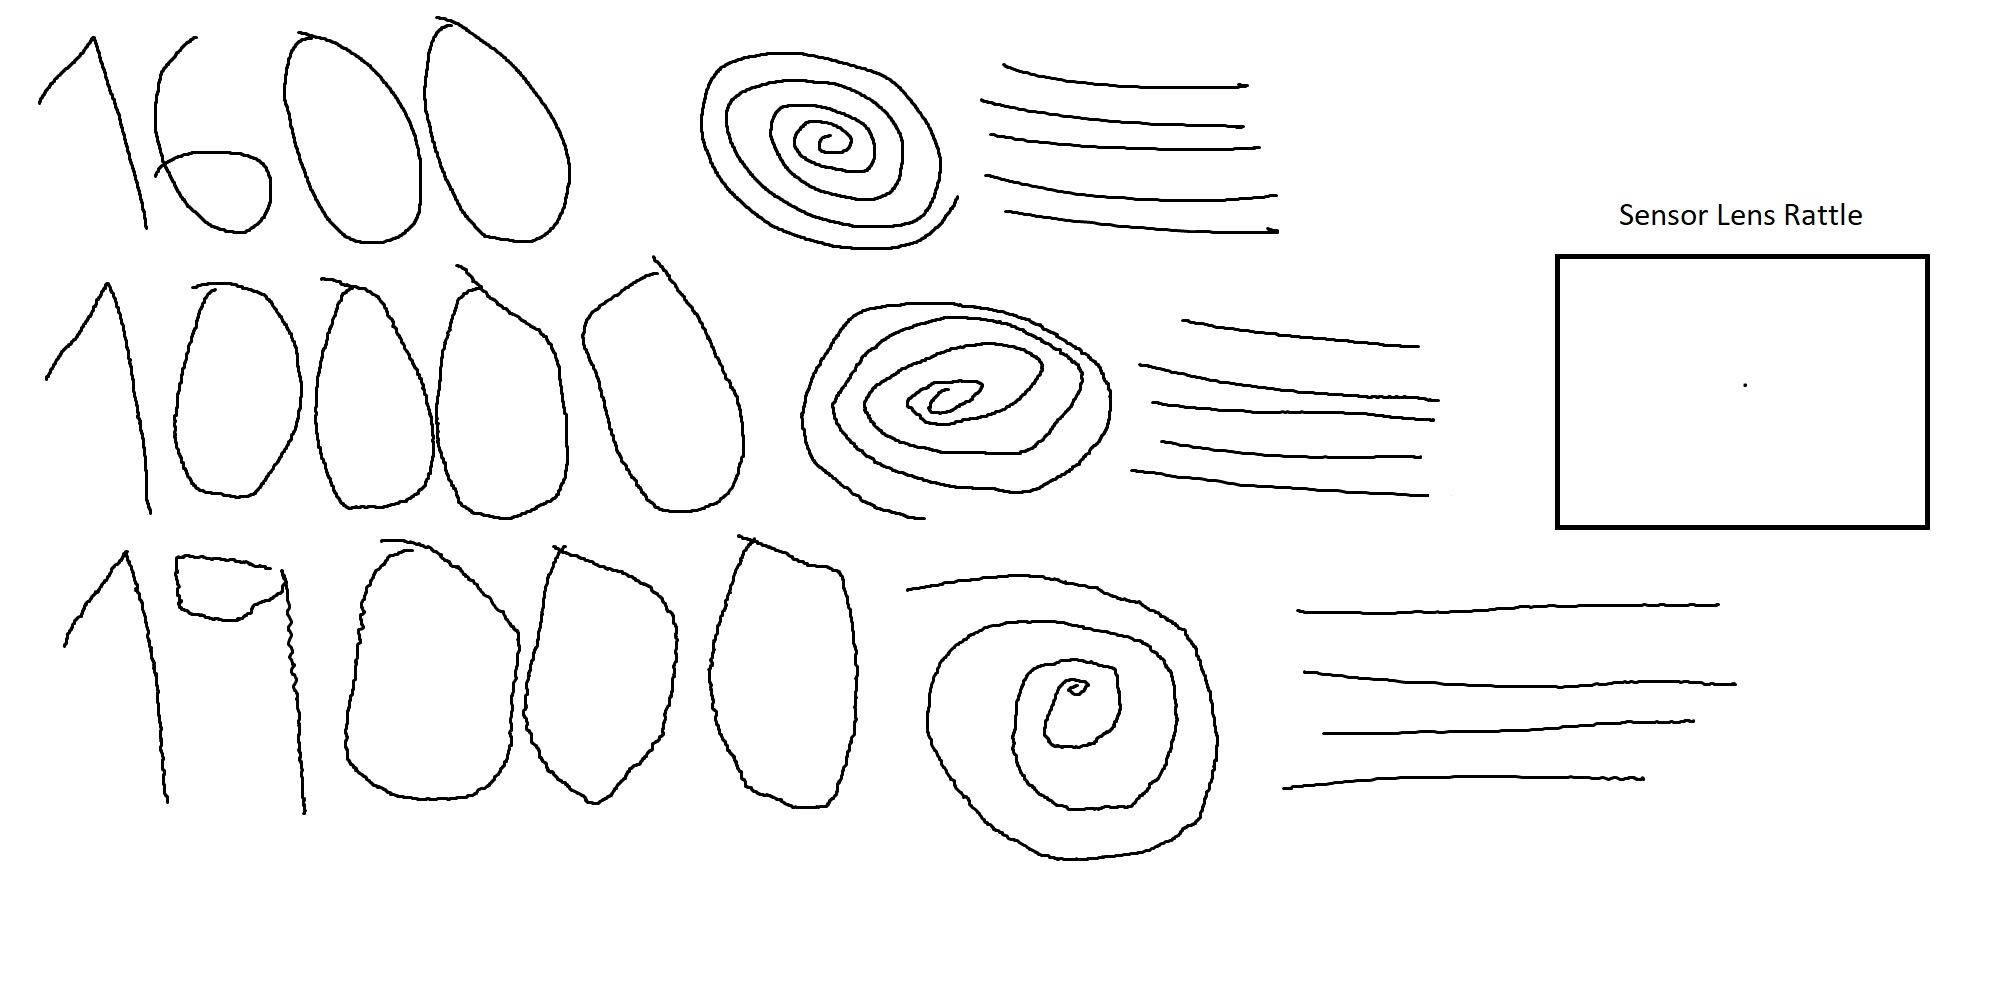
This test is used to indicate any potential issues with angle snapping (non-native straightening of linear motion) and jitter, along with any sensor lens rattle. As you can see, no issues with angle snapping can be observed. No jitter is visible at 1600 CPI. 10,000 CPI shows moderate jitter, which is amplified to major levels at 19,000 CPI. This is in line with what to expect from a sensor lacking smoothing entirely. Lastly, there is no lens movement.
Lift-off Distance
The Model I offers two pre-defined LOD levels to choose from. At the default "1 mm" setting, the sensor does not track at a height of 1 DVD (<1.2 mm). Using the "2 mm" setting, the sensor does track at a height of 1 DVD (1.2 mm<x<2.4 mm, with x being LOD height), but not at a height of 2 DVDs. Keep in mind that LOD may vary slightly depending on the mousing surface (pad) it is being used on.Click Latency

In most computer mice, mechanical switches are being used for the main buttons, which require debouncing in order to avoid unintended double clicks. Debouncing typically adds a delay (along with any potential processing delay), which shall be referred to as click latency. As there is no way to measure said delay directly outside of using a USB analyzer, it has to be done by comparing it to a control subject, which in this case is the ASUS ROG Chakram Core. The test setup involves wiring the NO pin of one of the main button switches of the test subject to one of the control subject, and qsxcv's program is used to measure the relative delay between them. Doing so is only possible if the devices in question are plugged into the PC through a wired connection. The Zaunkoenig M2K has been posited as the baseline for being within 0.1 ms of the possible minimum click latency of a high-speed device and within 0.2 ms of a hypothetical absolute minimum. As such, the resulting values may be considered quasi-absolute.
Click latency can be changed within the software by adjusting the debounce time setting. Using the 0 ms setting, click latency has been measured to be roughly +1.3 ms, with standard deviation being 0.50 ms. Using the 2 ms setting, click latency has been measured to be roughly +3.3 ms, with standard deviation being 0.56 ms. Using the default 10 ms setting, click latency has been measured to be roughly +11.3 ms, with standard deviation being 0.61 ms.
Feb 6th, 2025 11:02 EST
change timezone
Latest GPU Drivers
New Forum Posts
- AMD on a Gsync Monitor? (4)
- Post your Monster Hunter Wilds benchmark scores (16)
- What are you playing? (22786)
- Get a new motherboard now even though I won't be using it for some years? (48)
- TOXIC AMD Radeon™ RX 6900 XT (35)
- TPU's Nostalgic Hardware Club (19931)
- Where are the Video Cards? (19)
- Wow YouTube is a Hog (74)
- Optane / 3DXPoint - legacy and fate (1)
- 140mm Fan Question (37)
Popular Reviews
- Spider-Man 2 Performance Benchmark Review - 35 GPUs Tested
- Kingdom Come Deliverance II Performance Benchmark Review - 35 GPUs Tested
- Corsair Frame 4000D Review
- NVIDIA GeForce RTX 5080 Founders Edition Review
- Gigabyte GeForce RTX 5080 Gaming OC Review
- MSI GeForce RTX 5080 Vanguard SOC Review
- Formovie Cinema Edge 4K UST Laser Projector Review
- AMD Ryzen 7 9800X3D Review - The Best Gaming Processor
- ASUS GeForce RTX 5080 Astral OC Review
- Dan Clark Audio NOIRE X Closed-Back Headphones Review
Controversial News Posts
- NVIDIA 2025 International CES Keynote: Liveblog (470)
- AMD Debuts Radeon RX 9070 XT and RX 9070 Powered by RDNA 4, and FSR 4 (349)
- AMD Radeon 9070 XT Rumored to Outpace RTX 5070 Ti by Almost 15% (285)
- AMD is Taking Time with Radeon RX 9000 to Optimize Software and FSR 4 (256)
- AMD Denies Radeon RX 9070 XT $899 USD Starting Price Point Rumors (239)
- Edward Snowden Lashes Out at NVIDIA Over GeForce RTX 50 Pricing And Value (235)
- AMD Radeon RX 9070 XT & RX 9070 Custom Models In Stock at European Stores (226)
- New Leak Reveals NVIDIA RTX 5080 Is Slower Than RTX 4090 (215)