 19
19
Pichau Gaming Nidus 500 W Review
Cross Load Tests »Test Setup

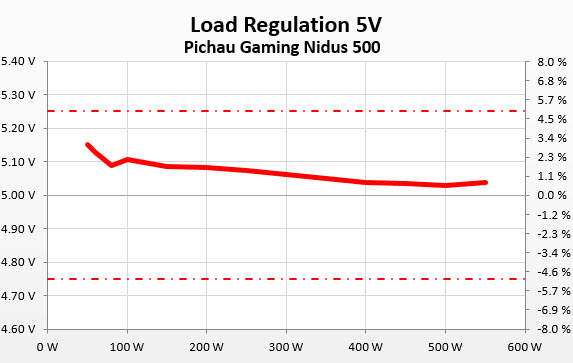
Primary Rails Load Regulation
The following charts show the voltage values of the main rails, recorded over a range from 60 W to the maximum specified load, and the deviation (in percent) for the same load range. Tight load regulation is an important characteristic for every power supply since it allows for constant voltage levels despite changes in load.


5VSB Regulation


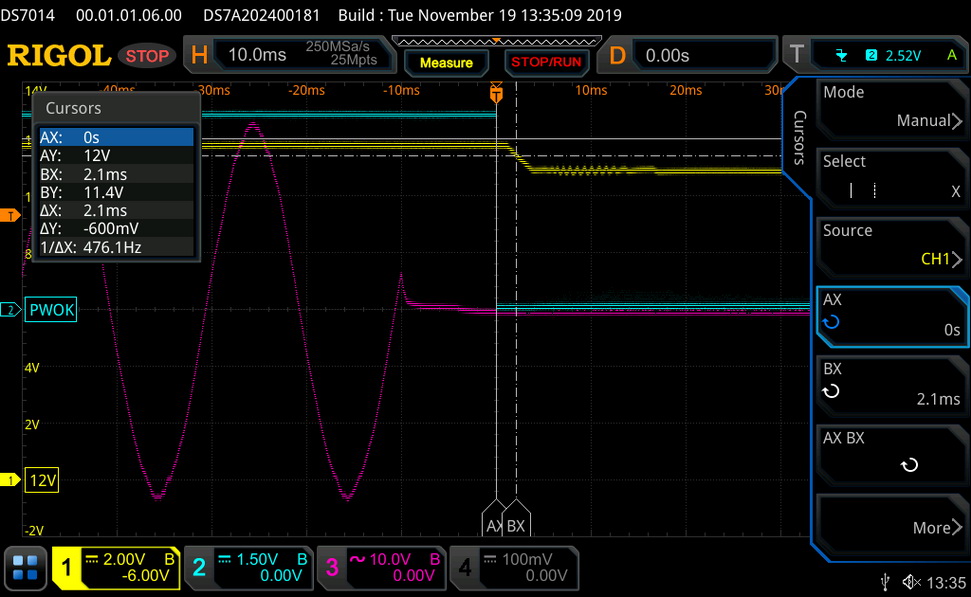
Hold-up Time
Hold-up time represents the amount of time, usually measured in milliseconds, a PSU can maintain output regulations as defined by the ATX specification without input power. Hold-up time is the amount of time the system can continue to run without shutting down or rebooting during a power interruption. In the following screenshots, the blue line is the mains signal and the green line is the "Power Good" signal, while the yellow line represents the +12V rail.


Inrush Current
Inrush current, or switch-on surge, refers to the maximum instantaneous input current drawn by an electrical device when it is first turned on. Large enough inrush current can cause the tripping of circuit breakers and fuses and may also damage switches, relays, and bridge rectifiers. As a result, the lower the inrush current of a PSU right as it is turned on, the better.
10-110% Load Testing
These tests reveal the PSU's load regulation and efficiency levels at high ambient temperatures. They also show how the fan-speed profile behaves under tough operating conditions.| Load Regulation & Efficiency Testing Data - Pichau Gaming Nidus 500 | ||||||||||
|---|---|---|---|---|---|---|---|---|---|---|
| Test | 12 V | 5 V | 3.3 V | 5VSB | Power (DC/AC) | Efficiency | Fan Speed | PSU Noise | Temp (In/Out) | PF/AC Volts |
| 10% Load | 2.372A | 1.962A | 1.946A | 0.988A | 49.994W | 81.706% | 714 RPM | 15.1 dB(A) | 30.05°C | 0.872 |
| 11.970V | 5.098V | 3.391V | 5.060V | 61.188W | 36.20°C | 230.34V | ||||
| 20% Load | 5.777A | 2.949A | 2.924A | 1.188A | 100.016W | 86.739% | 716 RPM | 15.1 dB(A) | 30.80°C | 0.938 |
| 11.965V | 5.088V | 3.383V | 5.049V | 115.307W | 37.57°C | 230.34V | ||||
| 30% Load | 9.542A | 3.442A | 3.422A | 1.390A | 149.968W | 88.357% | 719 RPM | 15.1 dB(A) | 31.14°C | 0.961 |
| 11.938V | 5.085V | 3.375V | 5.038V | 169.729W | 38.66°C | 230.34V | ||||
| 40% Load | 13.326A | 3.936A | 3.917A | 1.592A | 200.009W | 88.598% | 722 RPM | 15.1 dB(A) | 31.32°C | 0.971 |
| 11.917V | 5.082V | 3.369V | 5.028V | 225.748W | 39.55°C | 230.34V | ||||
| 50% Load | 16.763A | 4.930A | 4.911A | 1.795A | 250.038W | 88.710% | 724 RPM | 15.1 dB(A) | 32.01°C | 0.979 |
| 11.903V | 5.073V | 3.359V | 5.015V | 281.859W | 41.09°C | 230.34V | ||||
| 60% Load | 20.209A | 5.929A | 5.910A | 1.999A | 299.989W | 88.237% | 870 RPM | 19.4 dB(A) | 32.59°C | 0.983 |
| 11.885V | 5.061V | 3.350V | 5.003V | 339.981W | 42.25°C | 230.34V | ||||
| 70% Load | 23.633A | 6.933A | 6.915A | 2.205A | 350.060W | 87.635% | 1129 RPM | 26.3 dB(A) | 33.46°C | 0.983 |
| 11.888V | 5.049V | 3.341V | 4.990V | 399.453W | 43.86°C | 230.33V | ||||
| 80% Load | 27.075A | 7.944A | 7.920A | 2.411A | 399.973W | 86.880% | 1369 RPM | 32.0 dB(A) | 33.51°C | 0.984 |
| 11.877V | 5.037V | 3.332V | 4.977V | 460.375W | 44.44°C | 230.33V | ||||
| 90% Load | 31.000A | 8.445A | 8.419A | 2.415A | 449.656W | 86.162% | 1764 RPM | 38.8 dB(A) | 34.20°C | 0.986 |
| 11.844V | 5.033V | 3.324V | 4.970V | 521.874W | 45.78°C | 230.32V | ||||
| 100% Load | 34.955A | 8.950A | 8.957A | 2.521A | 499.998W | 85.334% | 1764 RPM | 38.8 dB(A) | 34.90°C | 0.988 |
| 11.809V | 5.029V | 3.316V | 4.960V | 585.928W | 47.12°C | 230.32V | ||||
| 110% Load | 39.366A | 8.936A | 8.976A | 2.524A | 549.598W | 84.535% | 1761 RPM | 38.8 dB(A) | 35.69°C | 0.990 |
| 11.746V | 5.037V | 3.308V | 4.953V | 650.143W | 49.22°C | 230.32V | ||||
| Crossload 1 | 0.116A | 13.000A | 12.999A | 0.000A | 108.337W | 79.979% | 820 RPM | 17.7 dB(A) | 31.80°C | 0.949 |
| 12.651V | 4.863V | 3.358V | 5.047V | 135.457W | 41.43°C | 230.33V | ||||
| Crossload 2 | 38.007A | 0.999A | 1.000A | 1.000A | 443.114W | 86.412% | 1703 RPM | 38.2 dB(A) | 34.49°C | 0.986 |
| 11.302V | 5.213V | 3.340V | 5.011V | 512.795W | 47.04°C | 230.33V | ||||
I did not to heavily stress the PSU in these tests for two reasons: It is a budget unit, and had it failed, obtaining another one would have been a problem. Once all tests are finished, though, I will fully stress it for our protection features evaluation, as that is also where most PSUs die if their platforms are not good enough or the protections are wrongly configured.
Load regulation is not that tight, especially if you compare it to the Corsair CX550. That having been said, at +12 V, the Nidus performs better than the DeepCool DA500, which is based on the same platform but uses inferior components.
At up to the 60% load test, the PSU is silent, and it takes a 400 W load to make its fan exceed 30 dB(A). With more than 34 °C ambient and 80% load or above, the cooling fan spins at full speed to handle the increased thermal loads.
Light Load Testing
In the following tests, we measure the PSU's efficiency at loads significantly lower than 10 percent of its maximum capacity (the lowest load the 80 PLUS standard measures). This is important for representing when a PC is idle with its power-saving features turned on.| Efficiency at Low Loads - Pichau Gaming Nidus 500 | |||||||||
|---|---|---|---|---|---|---|---|---|---|
| Test # | 12 V | 5 V | 3.3 V | 5 VSB | Power (DC/AC) | Efficiency | Fan Speed | PSU Noise | PF/AC Volts |
| 1 | 2.951A | 0.486A | 0.484A | 0.197A | 40.026W | 82.312% | 708 RPM | 14.4 dB(A) | 0.838 |
| 11.819V | 5.150V | 3.397V | 5.081V | 48.627W | 230.38V | ||||
| 2 | 4.181A | 0.976A | 0.972A | 0.394A | 59.974W | 85.160% | 702 RPM | 14.1 dB(A) | 0.891 |
| 11.881V | 5.126V | 3.393V | 5.073V | 70.425W | 230.37V | ||||
| 3 | 5.425A | 1.467A | 1.461A | 0.592A | 80.011W | 86.707% | 704 RPM | 14.1 dB(A) | 0.919 |
| 11.900V | 5.115V | 3.389V | 5.066V | 92.277W | 230.36V | ||||
| 4 | 6.671A | 1.958A | 1.950A | 0.791A | 100.041W | 87.535% | 708 RPM | 14.4 dB(A) | 0.937 |
| 11.908V | 5.107V | 3.386V | 5.057V | 114.287W | 230.36V | ||||
At light loads, output noise is bottom low, and efficiency levels are satisfactory.
Ultra-Light Load Testing
The applied load in this test is only 10 W for PSUs with 500 W and less capacity. For stronger units, we dial in 2% of the maximum-rated capacity. We only run this test with 115 V input.| Efficiency at Low Loads - Pichau Gaming Nidus 500 | |||||||||
|---|---|---|---|---|---|---|---|---|---|
| Test # | 12 V | 5 V | 3.3 V | 5 VSB | Power (DC/AC) | Efficiency | Fan Speed | PSU Noise | PF/AC Volts |
| 1 | 0.656A | 0.223A | 0.237A | 0.043A | 9.929W | 61.503% | 708 RPM | 14.4 dB(A) | 0.864 |
| 11.822V | 5.155V | 3.402V | 5.060V | 16.144W | 115.15V | ||||
It was a nice surprise to see this PSU delivering more than 60% efficiency with only 10 W load.
Efficiency
Using the results we gathered so far, we plotted a chart showing the PSU's efficiency at low loads, and loads ranging from 10 to 110 percent of its maximum-rated capacity.


With normal loads, registered efficiency is not that high compared to the CX550 and the MWE Bronze units which use more advanced platforms, but with light loads, the Nidus manages to take the lead from Corsair's offering.
5VSB Efficiency
| 5VSB Efficiency - Pichau Gaming Nidus 500 | ||||
|---|---|---|---|---|
| Test # | 5VSB | Power (DC/AC) | Efficiency | PF/AC Volts |
| 1 | 0.100A | 0.509W | 68.970% | 0.042 |
| 5.089V | 0.738W | 230.39V | ||
| 2 | 0.250A | 1.272W | 73.272% | 0.095 |
| 5.085V | 1.736W | 230.39V | ||
| 3 | 0.550A | 2.795W | 75.622% | 0.175 |
| 5.080V | 3.696W | 230.39V | ||
| 4 | 1.000A | 5.071W | 76.440% | 0.249 |
| 5.070V | 6.634W | 230.39V | ||
| 5 | 1.500A | 7.593W | 76.837% | 0.293 |
| 5.061V | 9.882W | 230.38V | ||
| 6 | 2.501A | 12.604W | 75.279% | 0.341 |
| 5.040V | 16.743W | 230.39V | ||
This is not the most efficient 5VSB rail I have ever encountered, but I didn't expect miracles from a budget product.
Power Consumption in Idle and Standby
| Idle / Standby - Pichau Gaming Nidus 500 | ||||||
|---|---|---|---|---|---|---|
| Mode | 12 V | 5 V | 3.3 V | 5VSB | Power (AC) | PF/AC Volts |
| Idle | 11.956V | 5.122V | 3.404V | 5.090V | 2.212W | 0.123 |
| 230.3V | ||||||
| Standby | 0.067W | 0.004 | ||||
| 230.3V | ||||||
Fan RPM, Delta Temperature and Output Noise
The following results were obtained at 28–36 °C ambient.

The following results were obtained at 30–32 °C ambient.


May 4th, 2025 11:59 EDT
change timezone
Latest GPU Drivers
New Forum Posts
- 5070 Ti power limit questions (80)
- Are the 8 GB cards worth it? (822)
- Best USB 3 hub chipsets (5)
- Request for advice [Big Build] (43)
- PSU chirping sound (7)
- Windows 11 General Discussion (6016)
- Dream Monitor Ideas (168)
- Last game you purchased? (800)
- Free Games Thread (4659)
- Half Life 3 soon ? (4)
Popular Reviews
- Clair Obscur: Expedition 33 Performance Benchmark Review - 33 GPUs Tested
- ASUS ROG Maximus Z890 Hero Review
- ASUS Radeon RX 9070 XT TUF OC Review
- Montech HS02 PRO Review
- NVIDIA GeForce RTX 5060 Ti 8 GB Review - So Many Compromises
- ASUS GeForce RTX 5090 Astral Liquid OC Review - The Most Expensive GPU I've Ever Tested
- Seasonic Vertex GX 850 W Review
- Upcoming Hardware Launches 2025 (Updated Apr 2025)
- ASRock Radeon RX 9070 XT Taichi OC Review - Excellent Cooling
- Team Group GC Pro 2 TB Review
Controversial News Posts
- AMD Radeon RX 9060 XT to Roll Out 8 GB GDDR6 Edition, Despite Rumors (129)
- NVIDIA Sends MSRP Numbers to Partners: GeForce RTX 5060 Ti 8 GB at $379, RTX 5060 Ti 16 GB at $429 (128)
- NVIDIA Launches GeForce RTX 5060 Series, Beginning with RTX 5060 Ti This Week (115)
- Nintendo Confirms That Switch 2 Joy-Cons Will Not Utilize Hall Effect Stick Technology (105)
- NVIDIA PhysX and Flow Made Fully Open-Source (95)
- Sony Increases the PS5 Pricing in EMEA and ANZ by Around 25 Percent (84)
- Parts of NVIDIA GeForce RTX 50 Series GPU PCB Reach Over 100°C: Report (78)
- Intel "Bartlett Lake-S" Gaming CPU is Possible, More Hints Appear for a 12 P-Core SKU (77)