 7
7
Thermaltake Toughpower GF1 ARGB 850 W Gold Review
Cross Load Tests »Test Setup

Primary Rails Load Regulation
The following charts show the voltage values of the main rails, recorded over a range from 60 W to the maximum specified load, and the deviation (in percent) for the same load range. Tight load regulation is an important characteristic for every power supply since it allows for consistent voltage levels despite of changes in the load.


5VSB Regulation


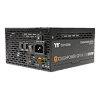
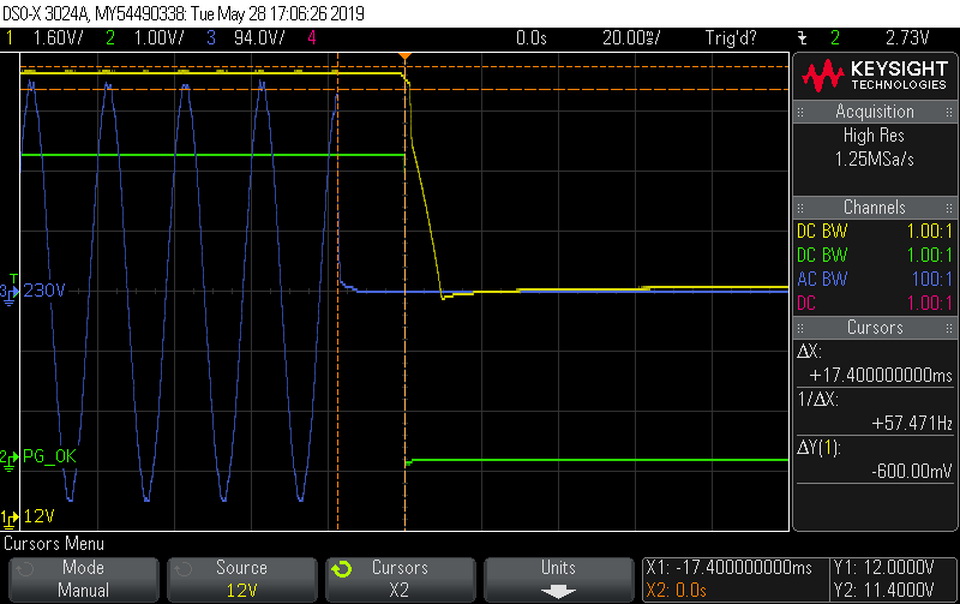
Hold-up Time
Hold-up time represents the amount of time, usually measured in milliseconds, a PSU can maintain output regulations as defined by the ATX specification without input power. Hold-up time is the amount of time the system can continue to run without shutting down or rebooting during a power interruption. In the following screenshots, the blue line is the mains signal and the green line is the "Power Good" signal, while the yellow line represents the +12V rail.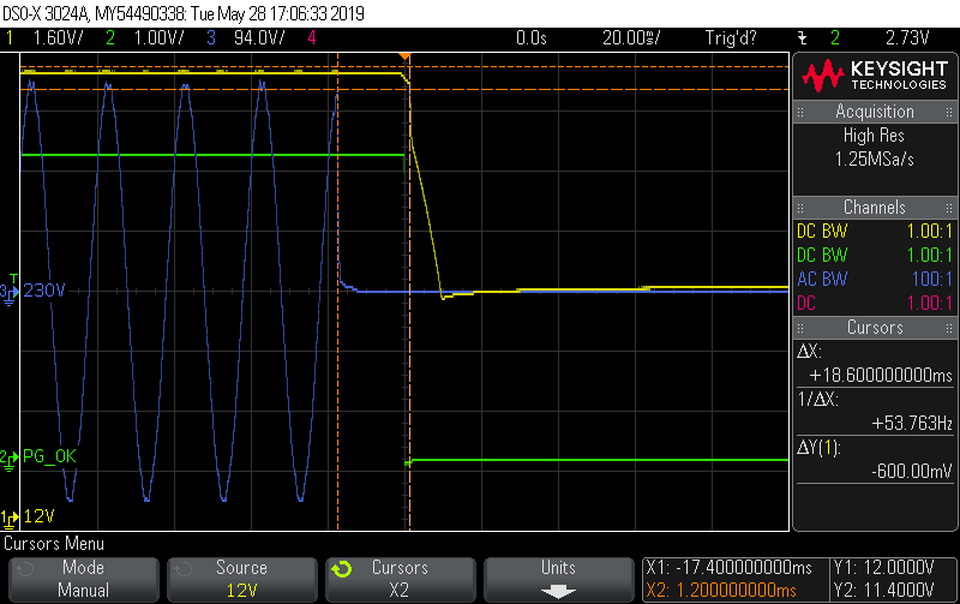


Inrush Current
Inrush current, or switch-on surge, refers to the maximum instantaneous input current drawn by an electrical device when it is first turned on. Large enough inrush current can cause the tripping of circuit breakers and fuses and may also damage switches, relays, and bridge rectifiers. As a result, the lower the inrush current of a PSU right as it is turned on, the better.
10-110% Load Testing
These tests reveal the PSU's load regulation and efficiency levels under high ambient temperatures. They also show how the fan-speed profile behaves in tough operating conditions.| Load Regulation & Efficiency Testing Data Thermaltake TPD-0850F3FAGU-1 | ||||||||||
|---|---|---|---|---|---|---|---|---|---|---|
| Test | 12 V | 5 V | 3.3 V | 5VSB | Power (DC/AC) | Efficiency | Fan Speed | PSU Noise | Temp (In/Out) | PF/AC Volts |
| 10% Load | 5.254A | 1.983A | 2.002A | 0.992A | 84.930W | 87.216% | 0 RPM | <6.0 dB(A) | 46.60°C | 0.829 |
| 12.053V | 5.044V | 3.296V | 5.043V | 97.379W | 39.38°C | 230.24V | ||||
| 20% Load | 11.505A | 2.977A | 3.007A | 1.192A | 169.434W | 90.670% | 582 RPM | 11.3 dB(A) | 40.56°C | 0.915 |
| 12.041V | 5.039V | 3.292V | 5.035V | 186.869W | 48.13°C | 230.25V | ||||
| 30% Load | 18.146A | 3.477A | 3.497A | 1.393A | 254.522W | 92.275% | 582 RPM | 11.3 dB(A) | 41.08°C | 0.940 |
| 12.042V | 5.036V | 3.288V | 5.024V | 275.831W | 49.04°C | 230.25V | ||||
| 40% Load | 24.805A | 3.976A | 4.018A | 1.595A | 339.712W | 92.694% | 582 RPM | 11.3 dB(A) | 41.77°C | 0.952 |
| 12.034V | 5.032V | 3.285V | 5.017V | 366.489W | 50.52°C | 230.25V | ||||
| 50% Load | 31.144A | 4.975A | 5.029A | 1.797A | 425.014W | 92.690% | 695 RPM | 16.4 dB(A) | 42.22°C | 0.957 |
| 12.025V | 5.027V | 3.281V | 5.008V | 458.532W | 51.29°C | 230.25V | ||||
| 60% Load | 37.425A | 5.975A | 6.042A | 2.001A | 509.539W | 92.367% | 1091 RPM | 30.7 dB(A) | 42.63°C | 0.961 |
| 12.017V | 5.022V | 3.276V | 4.999V | 551.646W | 52.68°C | 230.25V | ||||
| 70% Load | 43.783A | 6.979A | 7.059A | 2.205A | 594.862W | 91.989% | 1443 RPM | 38.0 dB(A) | 43.19°C | 0.964 |
| 12.008V | 5.017V | 3.272V | 4.991V | 646.664W | 53.63°C | 230.24V | ||||
| 80% Load | 50.151A | 7.984A | 8.079A | 2.410A | 680.176W | 91.542% | 1659 RPM | 43.1 dB(A) | 43.90°C | 0.965 |
| 11.999V | 5.012V | 3.267V | 4.981V | 743.024W | 54.74°C | 230.24V | ||||
| 90% Load | 56.925A | 8.489A | 8.580A | 2.411A | 765.102W | 91.146% | 1659 RPM | 43.1 dB(A) | 44.54°C | 0.967 |
| 11.991V | 5.008V | 3.263V | 4.979V | 839.424W | 56.05°C | 230.23V | ||||
| 100% Load | 63.440A | 8.996A | 9.111A | 3.027A | 849.912W | 90.629% | 1659 RPM | 43.1 dB(A) | 45.70°C | 0.969 |
| 11.983V | 5.004V | 3.259V | 4.956V | 937.796W | 57.74°C | 230.23V | ||||
| 110% Load | 70.555A | 9.000A | 9.120A | 3.029A | 934.685W | 90.164% | 1657 RPM | 43.1 dB(A) | 46.52°C | 0.971 |
| 11.976V | 5.002V | 3.256V | 4.954V | 1036.652W | 59.32°C | 230.24V | ||||
| Crossload 1 | 0.146A | 14.004A | 13.999A | 0.000A | 117.847W | 83.100% | 596 RPM | 12.1 dB(A) | 42.35°C | 0.886 |
| 12.036V | 5.013V | 3.278V | 5.070V | 141.813W | 51.65°C | 230.23V | ||||
| Crossload 2 | 70.840A | 1.002A | 0.997A | 1.000A | 862.693W | 91.291% | 1661 RPM | 43.1 dB(A) | 45.81°C | 0.969 |
| 11.990V | 5.025V | 3.271V | 5.025V | 944.996W | 57.67°C | 230.23V | ||||
Light Load Testing
In the following tests, we measure the PSU's efficiency at loads significantly lower than 10 percent of its maximum capacity (the lowest load the 80 PLUS standard measures). This is important for representing when a PC is idle with the power-saving features turned on.| Efficiency at Low Loads Thermaltake TPD-0850F3FAGU-1 | |||||||||
|---|---|---|---|---|---|---|---|---|---|
| Test # | 12 V | 5 V | 3.3 V | 5 VSB | Power (DC/AC) | Efficiency | Fan Speed | PSU Noise | PF/AC Volts |
| 1 | 2.860A | 0.495A | 0.485A | 0.197A | 39.583W | 80.998% | 0 RPM | <6.0 dB(A) | 0.657 |
| 12.057V | 5.050V | 3.300V | 5.070V | 48.869W | 230.24V | ||||
| 2 | 4.124A | 0.992A | 1.000A | 0.395A | 60.021W | 85.442% | 0 RPM | <6.0 dB(A) | 0.755 |
| 12.055V | 5.048V | 3.299V | 5.062V | 70.248W | 230.24V | ||||
| 3 | 5.321A | 1.485A | 1.485A | 0.594A | 79.527W | 87.261% | 0 RPM | <6.0 dB(A) | 0.815 |
| 12.053V | 5.046V | 3.297V | 5.056V | 91.137W | 230.24V | ||||
| 4 | 6.581A | 1.984A | 2.002A | 0.792A | 99.906W | 88.509% | 0 RPM | <6.0 dB(A) | 0.856 |
| 12.050V | 5.044V | 3.296V | 5.050V | 112.877W | 230.24V | ||||
Efficiency
Using the results we gathered so far, we plotted a chart showing the PSU's efficiency at low loads, as well as loads ranging from 10 to 110 percent of its maximum-rated capacity.


These are good efficiency numbers at both light and normal loads.
5VSB Efficiency
| 5VSB Efficiency Thermaltake TPD-0850F3FAGU-1 | ||||
|---|---|---|---|---|
| Test # | 5VSB | Power (DC/AC) | Efficiency | PF/AC Volts |
| 1 | 0.100A | 0.508W | 72.057% | 0.021 |
| 5.075V | 0.705W | 230.21V | ||
| 2 | 0.250A | 1.268W | 75.837% | 0.050 |
| 5.071V | 1.672W | 230.21V | ||
| 3 | 0.550A | 2.785W | 78.033% | 0.102 |
| 5.062V | 3.569W | 230.21V | ||
| 4 | 1.000A | 5.050W | 78.392% | 0.170 |
| 5.049V | 6.442W | 230.21V | ||
| 5 | 1.500A | 7.549W | 78.220% | 0.229 |
| 5.032V | 9.651W | 230.21V | ||
| 6 | 3.000A | 14.969W | 76.835% | 0.333 |
| 4.989V | 19.482W | 230.21V | ||
The 5VSB rail is efficient enough. However, a reading of at least 80% (or higher) efficiency would have been nice.
Power Consumption in Idle and Standby
| Idle / Standby Thermaltake TPD-0850F3FAGU-1 | ||||||
|---|---|---|---|---|---|---|
| Mode | 12 V | 5 V | 3.3 V | 5VSB | Power (AC) | PF/AC Volts |
| Idle | 12.087V | 5.050V | 3.302V | 5.078V | 4.274W | 0.113 |
| 230.2V | ||||||
| Standby | 0.065W | 0.002 | ||||
| 230.2V | ||||||
Fan RPM, Delta Temperature and Output Noise
The following results were obtained at 37–47 °C ambient.

The following results were obtained at 30–32 °C ambient.


Feb 22nd, 2025 22:31 EST
change timezone
Latest GPU Drivers
New Forum Posts
- Why is coil whine still a nuisance? (13)
- 5800X3D CO and RAM - Thoughts? (14)
- Windows 11 General Discussion (5696)
- [Feature request] NIS and rBAR (14)
- Discrete case for dual GPU (17)
- 4GB or 8GB - Saphire pulse Radeon RX570 ITX (1)
- Help with integrated gpu. (48)
- A Final Fantasy IX Reminiscence - My love letter and homage to one of the best stories ever told (69)
- How to quickly & easily fix coil-whine(coil choke noise) (1135)
- RX 580 Bricked After Failed BIOS Flash – No Display, Fans Spinning (5)
Popular Reviews
- MSI GeForce RTX 5070 Ti Ventus 3X OC Review
- Ducky One X Inductive Keyboard Review
- ASUS GeForce RTX 5070 Ti TUF OC Review
- Galax GeForce RTX 5070 Ti 1-Click OC White Review
- MSI GeForce RTX 5070 Ti Vanguard SOC Review
- Gigabyte GeForce RTX 5090 Gaming OC Review
- darkFlash DY470 Review
- MSI GeForce RTX 5070 Ti Gaming Trio OC+ Review
- Palit GeForce RTX 5070 Ti GameRock OC Review
- Fantech Aria II Pro Review
Controversial News Posts
- NVIDIA GeForce RTX 5090 Spotted with Missing ROPs, NVIDIA Confirms the Issue, Multiple Vendors Affected, RTX 5070 Ti, Too (412)
- AMD Radeon 9070 XT Rumored to Outpace RTX 5070 Ti by Almost 15% (302)
- AMD Plans Aggressive Price Competition with Radeon RX 9000 Series (271)
- AMD is Taking Time with Radeon RX 9000 to Optimize Software and FSR 4 (256)
- AMD Radeon RX 9070 and 9070 XT Listed On Amazon - One Buyer Snags a Unit (247)
- Edward Snowden Lashes Out at NVIDIA Over GeForce RTX 50 Pricing And Value (241)
- AMD Denies Radeon RX 9070 XT $899 USD Starting Price Point Rumors (239)
- New Leak Reveals NVIDIA RTX 5080 Is Slower Than RTX 4090 (215)