 16
16
Intel 330 Series SSD 180 GB Review
Windows 7 Startup & Software Installation »Steady State Performance
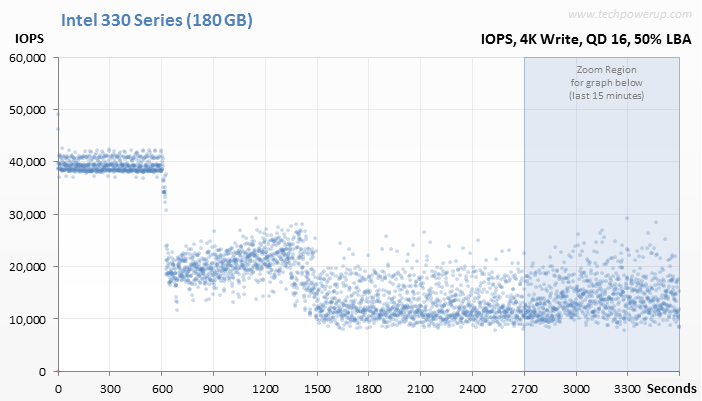
In this test, we put the drive through a steady-state measurement of its write performance in which we write onto the drive with a non-stop, fully-randomized stream of data for an hour (in which the controller can't find patterns).The drive's 4K write performance is measured over three levels of loading (amount of used space vs. amount of free space for the controller to use as potentially spare performance-enhancing area). The three levels we used are 50%, 75%, and 100% LBA. The test may not be a suitable representation of a consumer scenario in which data is typically written in short bursts with lower QD, but can be of academic interest in showing you how the various SSD controller architectures manage their NAND flash resources.
SSD controllers work in mysterious ways. Some of them include using free NAND flash area as performance-enhancing "scratchpads." Some modern controllers such as the SandForce SF-2281 and LAMD LM87800 have a fixed amount of physical NAND flash - known as overprovisioned areas -allotted to these. The controllers can even use free-space in the user-area (the part of the SSD's NAND flash that isn't overprovisioned). As we begin our test, the SSD controller has vast amounts of free / OP area space at its disposal, which causes it to pump out its highest write IOPS. Once the overprovisioned (OP) area is full, we see write IOPS drop like a rock till it plateaus. We still notice the odd spikes as the controller finds free-space to use. Towards the end (the last 15 minutes), the SSD controller will have run out of such free space to provide a metric we call "steady state write performance". That phase of our test is of particular importance, and the second graph below focuses on that portion.
| Capacity Used: Compare with: |
 |
 |
Mar 4th, 2025 07:41 EST
change timezone
Latest GPU Drivers
New Forum Posts
- Oh boy here we go again...potential X3D woes (26)
- 1080ti with 0 vram (4)
- Windows 11 General Discussion (5773)
- Maxsun RX580 graphics card crashes (5)
- The future of RDNA on Desktop. (72)
- AMD Path Tracing Toyshop Demo (3)
- WD Black or Gold for Gaming (10TB) (0)
- Will you buy a RTX 5090? (429)
- Ram downclocking after restart. (13)
- Issues with clock speed not increasing (40)
Popular Reviews
- AMD Radeon RX 9070 Series Technical Deep Dive
- ASUS GeForce RTX 5070 Ti TUF OC Review
- EIZO FlexScan EV4340X Review - A Multitasking Powerhouse
- AMD Ryzen 7 9800X3D Review - The Best Gaming Processor
- be quiet! Pure Base 501 DX Review
- RAWM ES21M Review
- MSI GeForce RTX 5070 Ti Vanguard SOC Review
- MSI GeForce RTX 5070 Ti Ventus 3X OC Review
- ASUS ROG Harpe Ace Mini Review
- MSI GeForce RTX 5070 Ti Gaming Trio OC+ Review
Controversial News Posts
- NVIDIA GeForce RTX 50 Cards Spotted with Missing ROPs, NVIDIA Confirms the Issue, Multiple Vendors Affected (513)
- AMD Plans Aggressive Price Competition with Radeon RX 9000 Series (278)
- AMD Radeon RX 9070 and 9070 XT Listed On Amazon - One Buyer Snags a Unit (260)
- AMD Mentions Sub-$700 Pricing for Radeon RX 9070 GPU Series, Looks Like NV Minus $50 Again (248)
- NVIDIA Investigates GeForce RTX 50 Series "Blackwell" Black Screen and BSOD Issues (244)
- AMD RDNA 4 and Radeon RX 9070 Series Unveiled: $549 & $599 (232)
- AMD Radeon RX 9070 and 9070 XT Official Performance Metrics Leaked, +42% 4K Performance Over Radeon RX 7900 GRE (195)
- AMD Radeon RX 9070-series Pricing Leaks Courtesy of MicroCenter (158)