 30
30
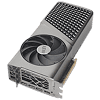
MSI GeForce RTX 4080 Super Expert Review
Cooler Performance Comparison »Temperatures
| Temperature & Noise Comparison | ||||||||
|---|---|---|---|---|---|---|---|---|
| Idle | Gaming | |||||||
| GPU | Noise | GPU | Hotspot | Memory | Noise | RPM | ||
| ASUS RTX 4080 Super Strix | 38°C | Fan Stop | 60°C | 69°C | 66°C | 30.5 dBA | 1267 RPM | |
| ASUS RTX 4080 Super Strix (Quiet BIOS) | 37°C | Fan Stop | 63°C | 72°C | 68°C | 28.0 dBA | 1075 RPM | |
| ASUS RTX 4080 Super TUF | 37°C | Fan Stop | 63°C | 72°C | 62°C | 33.8 dBA | 1541 RPM | |
| ASUS RTX 4080 Super TUF (Quiet BIOS) | 38°C | Fan Stop | 69°C | 79°C | 68°C | 28.4 dBA | 1095 RPM | |
| Galax RTX 4080 Super SG | 38°C | Fan Stop | 64°C | 73°C | 68°C | 32.6 dBA | 1222 RPM | |
| Gigabyte RTX 4080 Super Gaming OC | 36°C | Fan Stop | 60°C | 68°C | 60°C | 36.3 dBA | 1610 RPM | |
| Gigabyte RTX 4080 Super Gaming OC (Quiet BIOS) | 40°C | Fan Stop | 63°C | 71°C | 64°C | 31.0 dBA | 1323 RPM | |
| MSI RTX 4080 Super Expert | 44°C | Fan Stop | 69°C | 80°C | 72°C | 35.1 dBA | 1292 RPM | |
| NVIDIA RTX 4080 Super FE | 34°C | Fan Stop | 63°C | 73°C | 70°C | 35.3 dBA | 1348 RPM | |
| Palit RTX 4080 Super GamingPro | 40°C | Fan Stop | 67°C | 76°C | 72°C | 31.9 dBA | 1503 RPM | |
| PNY RTX 4080 Super Verto | 36°C | Fan Stop | 66°C | 78°C | 70°C | 33.9 dBA | 1344 RPM | |
| Zotac RTX 4080 Super AMP Extreme | 40°C | Fan Stop | 65°C | 76°C | 62°C | 39.3 dBA | 1486 RPM | |
| Zotac RTX 4080 Super AMP Extreme (Quiet BIOS) | 40°C | Fan Stop | 67°C | 78°C | 66°C | 34.5 dBA | 1280 RPM | |
Thermal Analysis
For this test, we first let the card sit idle to reach thermal equilibrium. Next, we start a constant 100% gaming load, recording several important parameters while the test is running. This shows you the thermal behavior of the card and how the fans ramp up as temperatures increase. Once temperatures are stable (no increase for two minutes), we stop the load and record how the card cools down over time.
Fan Noise

Apr 8th, 2025 21:22 EDT
change timezone
Latest GPU Drivers
New Forum Posts
- Comet Lake vs Rocket Lake Lga1200. (18)
- Razer Blade 2023 - i9 13950hx + RTX 4090 - Temperatur Problems (7)
- TPU's Nostalgic Hardware Club (20191)
- Show us your backside! (28)
- Folding Pie and Milestones!! (9464)
- X79 and/or rampage IV OC'ing thread for those of us still left.... (2390)
- Looking for 4060 MXM-A VBIOS (1)
- 9070XT or 7900XT or 7900XTX (156)
- issue with restart after changing throttlestop settings (3)
- Help me pick a UPS (98)
Popular Reviews
- The Last Of Us Part 2 Performance Benchmark Review - 30 GPUs Compared
- MCHOSE L7 Pro Review
- UPERFECT UStation Delta Max Review - Two Screens In One
- PowerColor Radeon RX 9070 Hellhound Review
- Sapphire Radeon RX 9070 XT Pulse Review
- Upcoming Hardware Launches 2025 (Updated Apr 2025)
- ASUS Prime X870-P Wi-Fi Review
- Sapphire Radeon RX 9070 XT Nitro+ Review - Beating NVIDIA
- AMD Ryzen 7 9800X3D Review - The Best Gaming Processor
- DDR5 CUDIMM Explained & Benched - The New Memory Standard
Controversial News Posts
- NVIDIA GeForce RTX 5060 Ti 16 GB SKU Likely Launching at $499, According to Supply Chain Leak (164)
- MSI Doesn't Plan Radeon RX 9000 Series GPUs, Skips AMD RDNA 4 Generation Entirely (146)
- Microsoft Introduces Copilot for Gaming (124)
- AMD Radeon RX 9070 XT Reportedly Outperforms RTX 5080 Through Undervolting (119)
- NVIDIA Reportedly Prepares GeForce RTX 5060 and RTX 5060 Ti Unveil Tomorrow (115)
- Over 200,000 Sold Radeon RX 9070 and RX 9070 XT GPUs? AMD Says No Number was Given (100)
- Nintendo Switch 2 Launches June 5 at $449.99 with New Hardware and Games (97)
- NVIDIA GeForce RTX 5050, RTX 5060, and RTX 5060 Ti Specifications Leak (97)