 24
24
Rapoo VT9 Air Review
Testing 8000 Hz Wired & Wireless »Sensor and Performance
The Rapoo VT9 Air is equipped with the PixArt PAW3398, which is a rebranded PixArt PAW3395. According to specifications, the 3395 is capable of up to 26,000 CPI, as well as a maximum tracking speed of 650 IPS, which equals 16.51 m/s. Out of the box, seven pre-defined CPI steps are available: 400, 800, 1200, 1600, 3200, 6400, and 26,000.All testing was done on the latest firmware (110/109). As such, results obtained on earlier firmware versions may differ from those presented hereafter.
CPI Accuracy
"CPI" (short for counts per inch) describes the number of counts registered by the mouse if it is moved exactly an inch. There are several factors (firmware, mounting height of the sensor not meeting specifications, mouse feet thickness, mousing surface, among others) which may contribute to nominal CPI not matching actual CPI. It is impossible to always achieve a perfect match, but ideally, nominal and actual CPI should differ as little as possible. In this test, I'm determining whether this is the case or not. However, please keep in mind that said variance will still differ from unit to unit, so your mileage may vary.
I've restricted my testing to the four most common CPI steps, which are 400, 800, 1600, and 3200. As you can see, deviation is consistently positive and low, which is a very good result. In order to account for the measured deviation, adjusted steps of 400, 800, 1550, and 3150 CPI have been used for testing.
Motion Delay
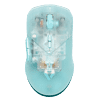
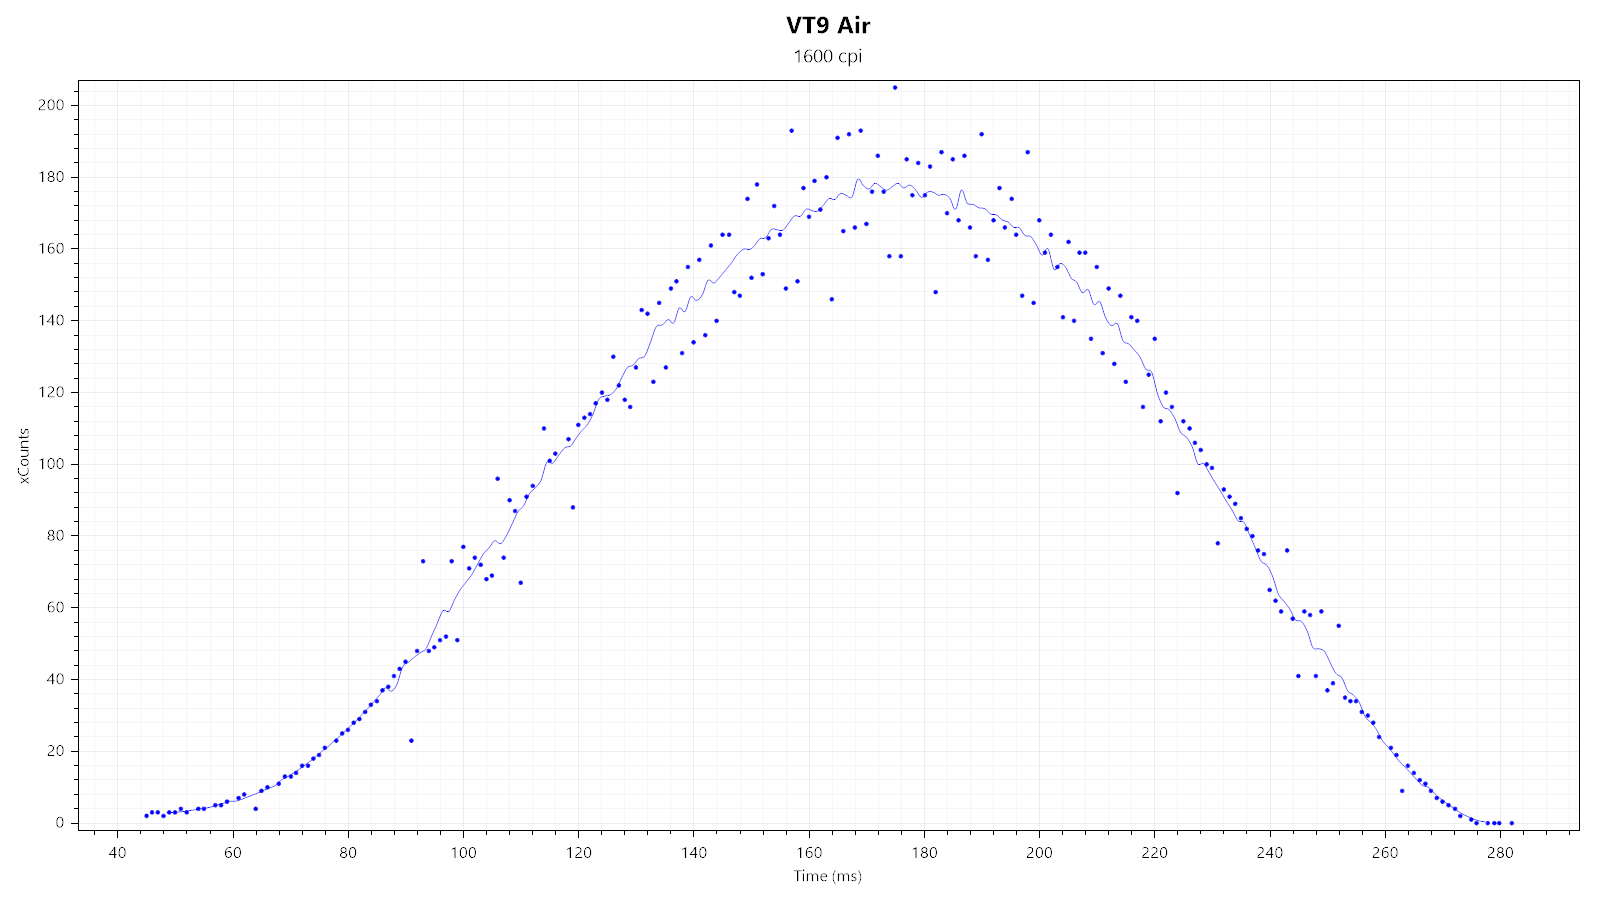
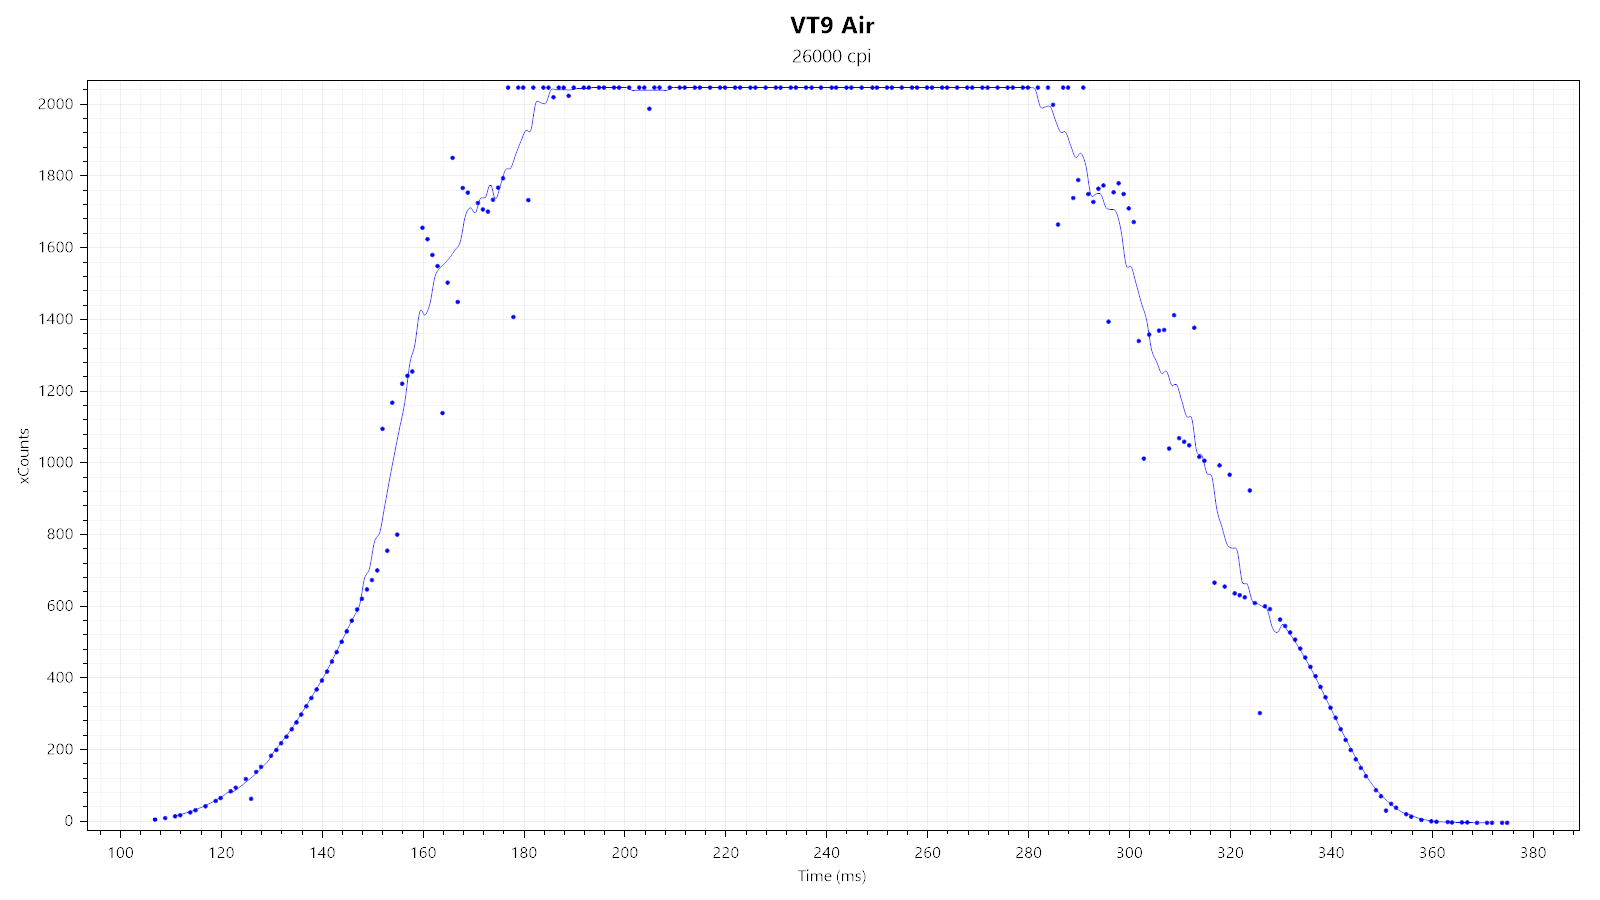
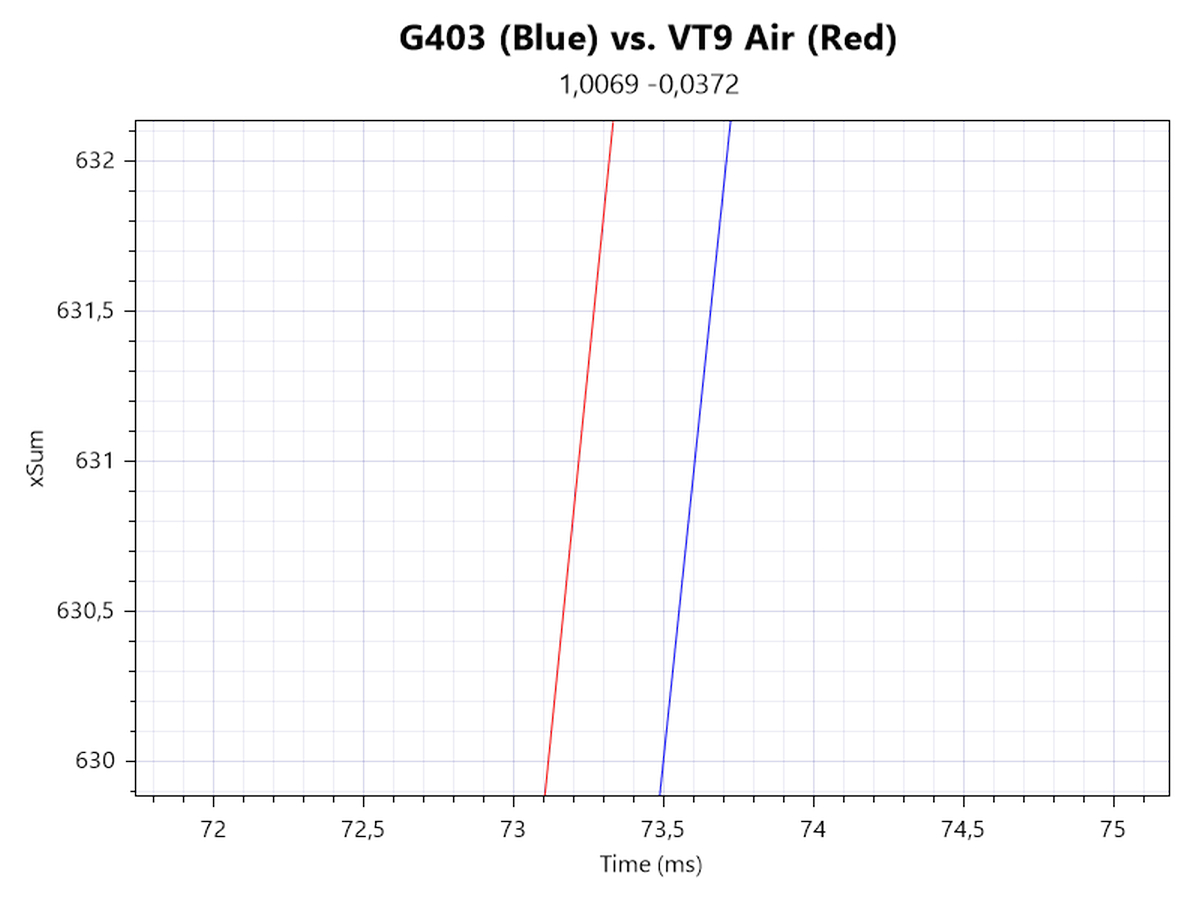
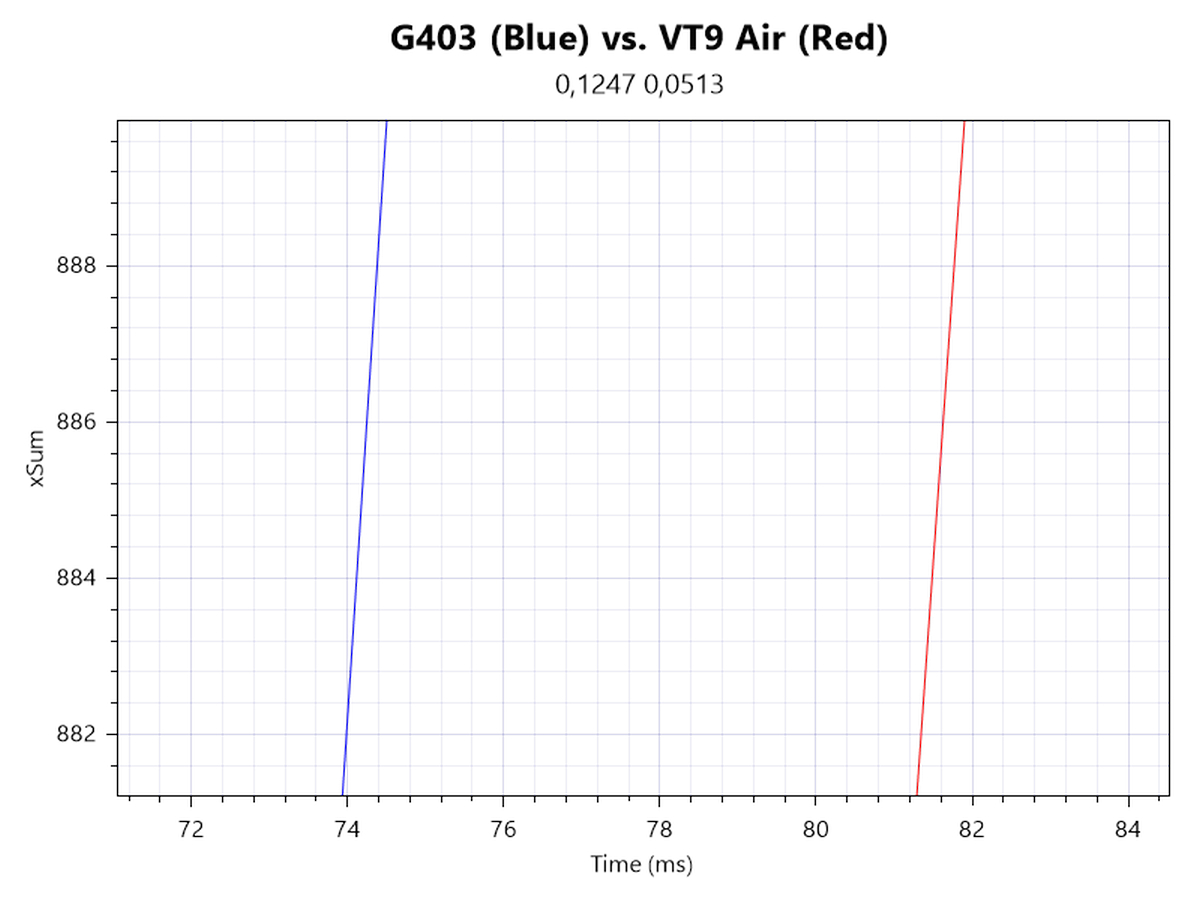
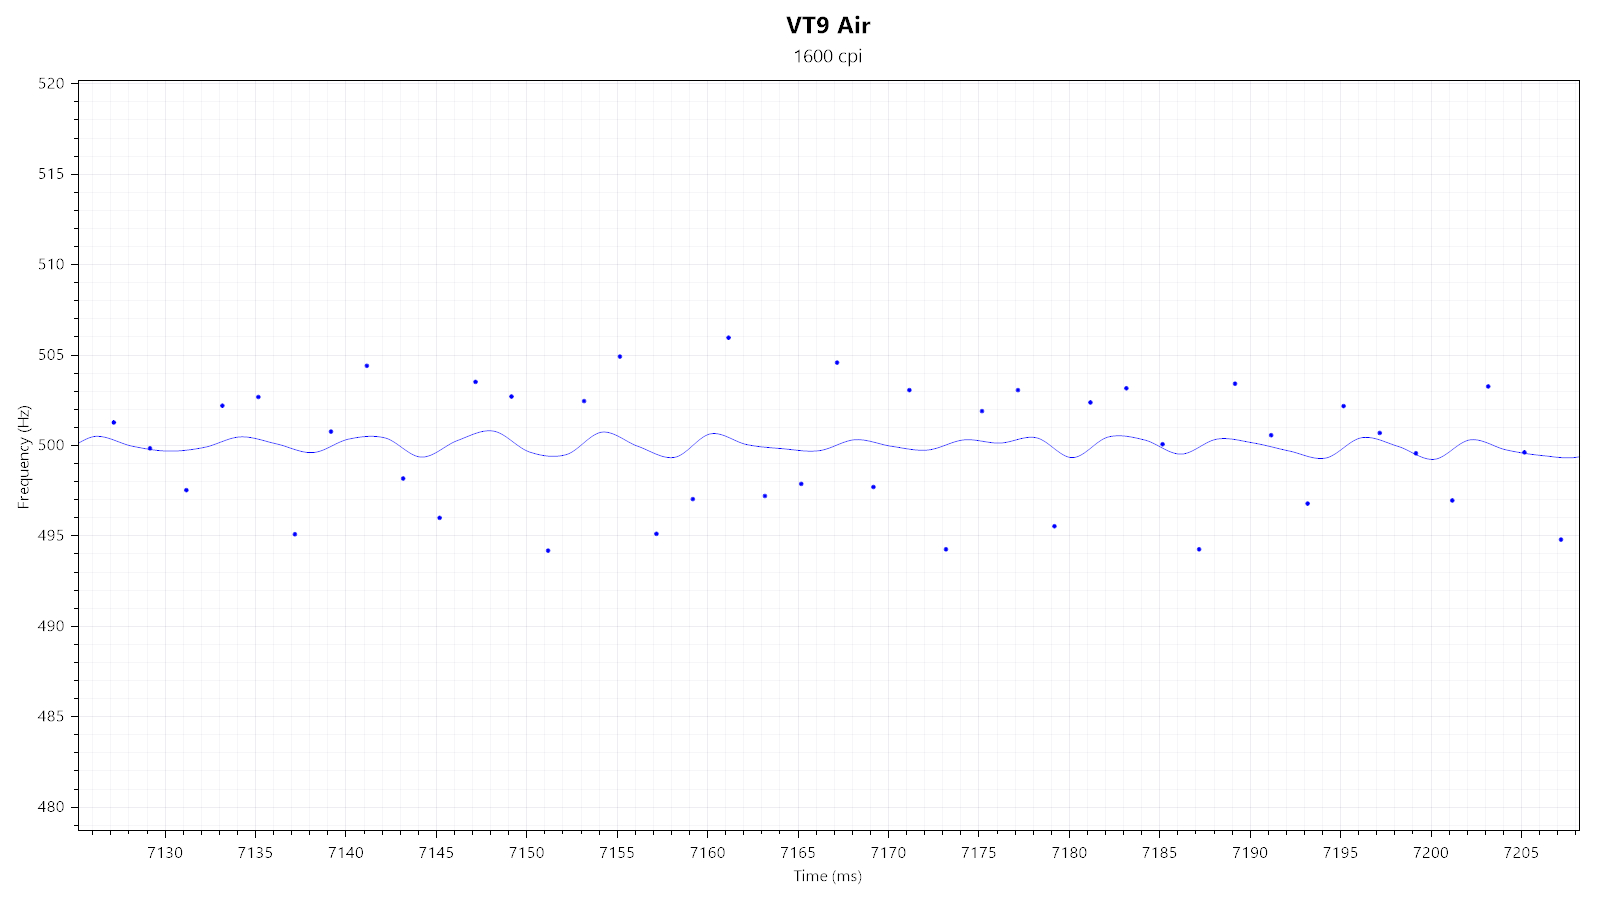
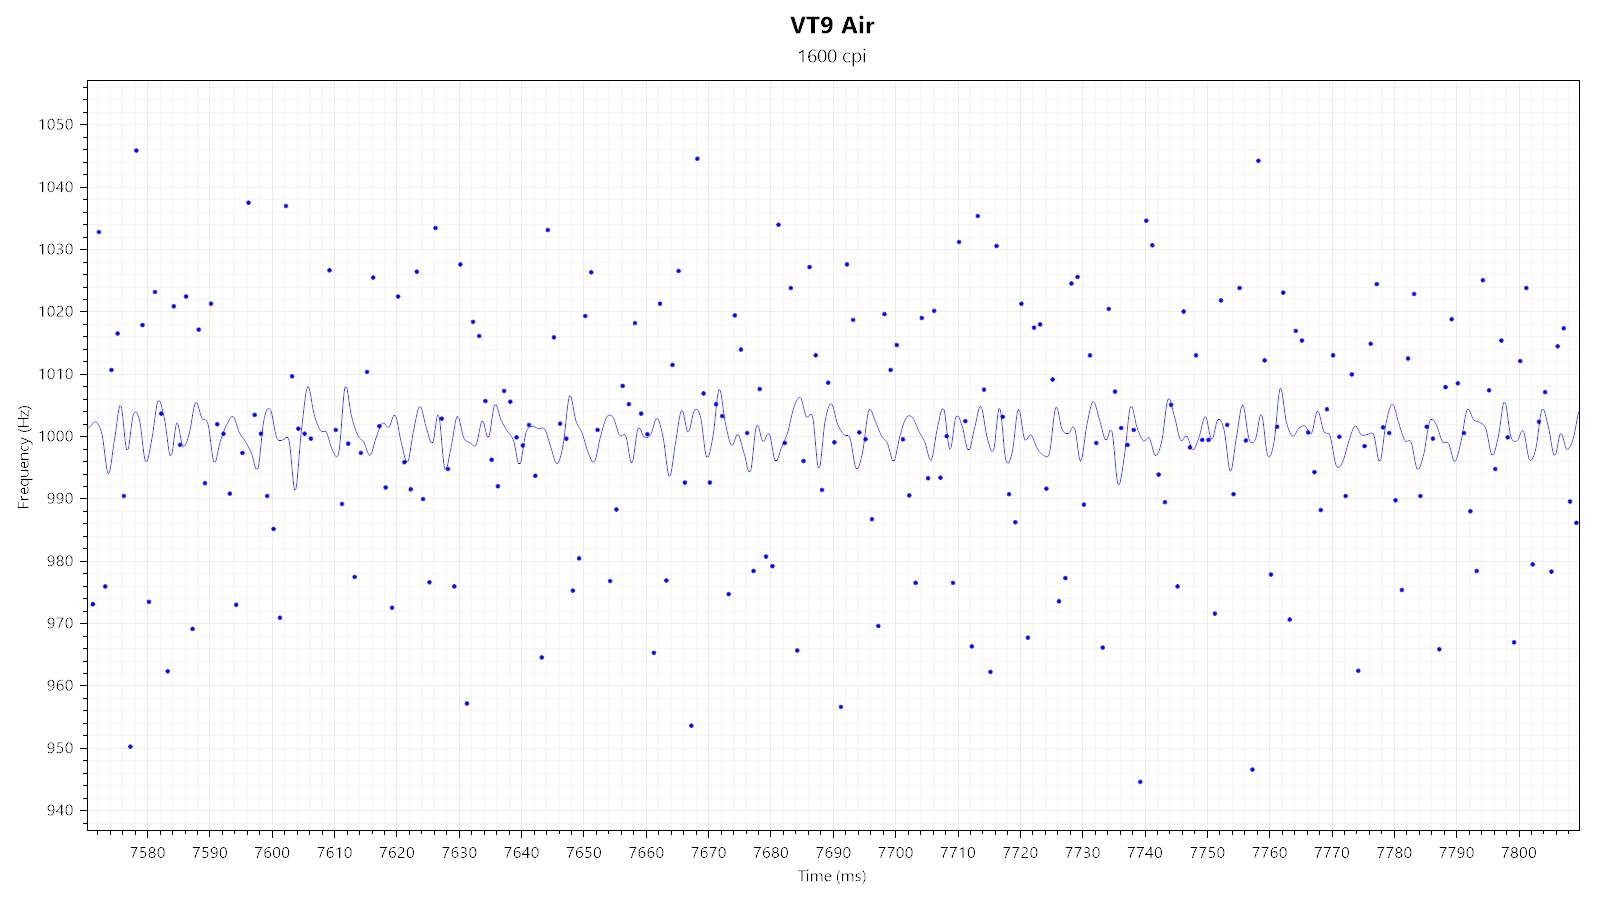
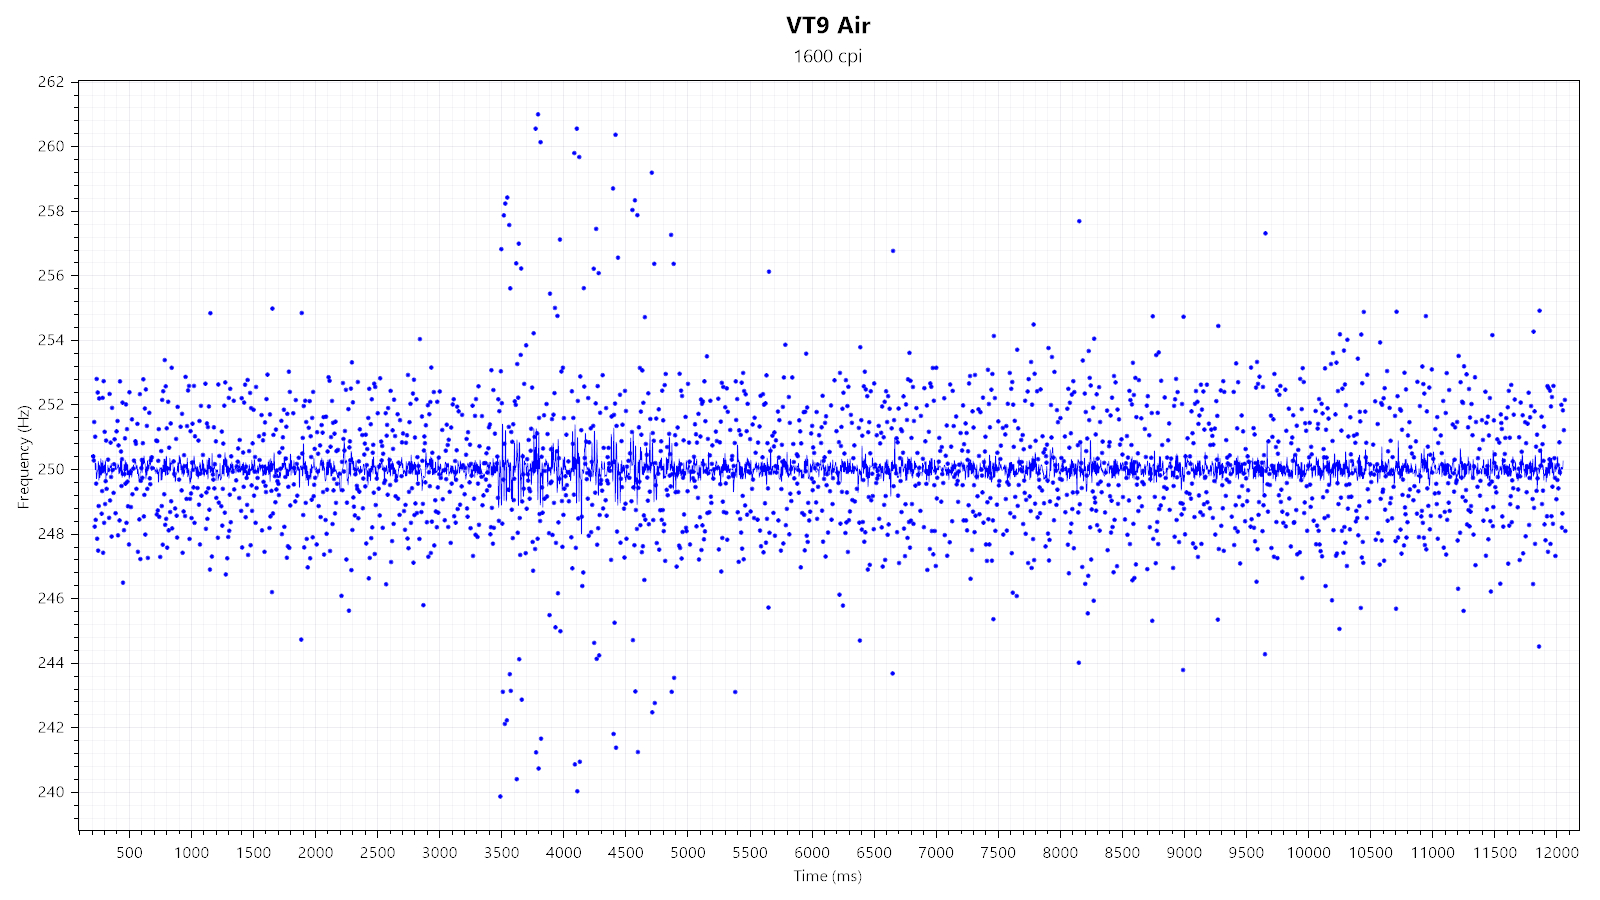
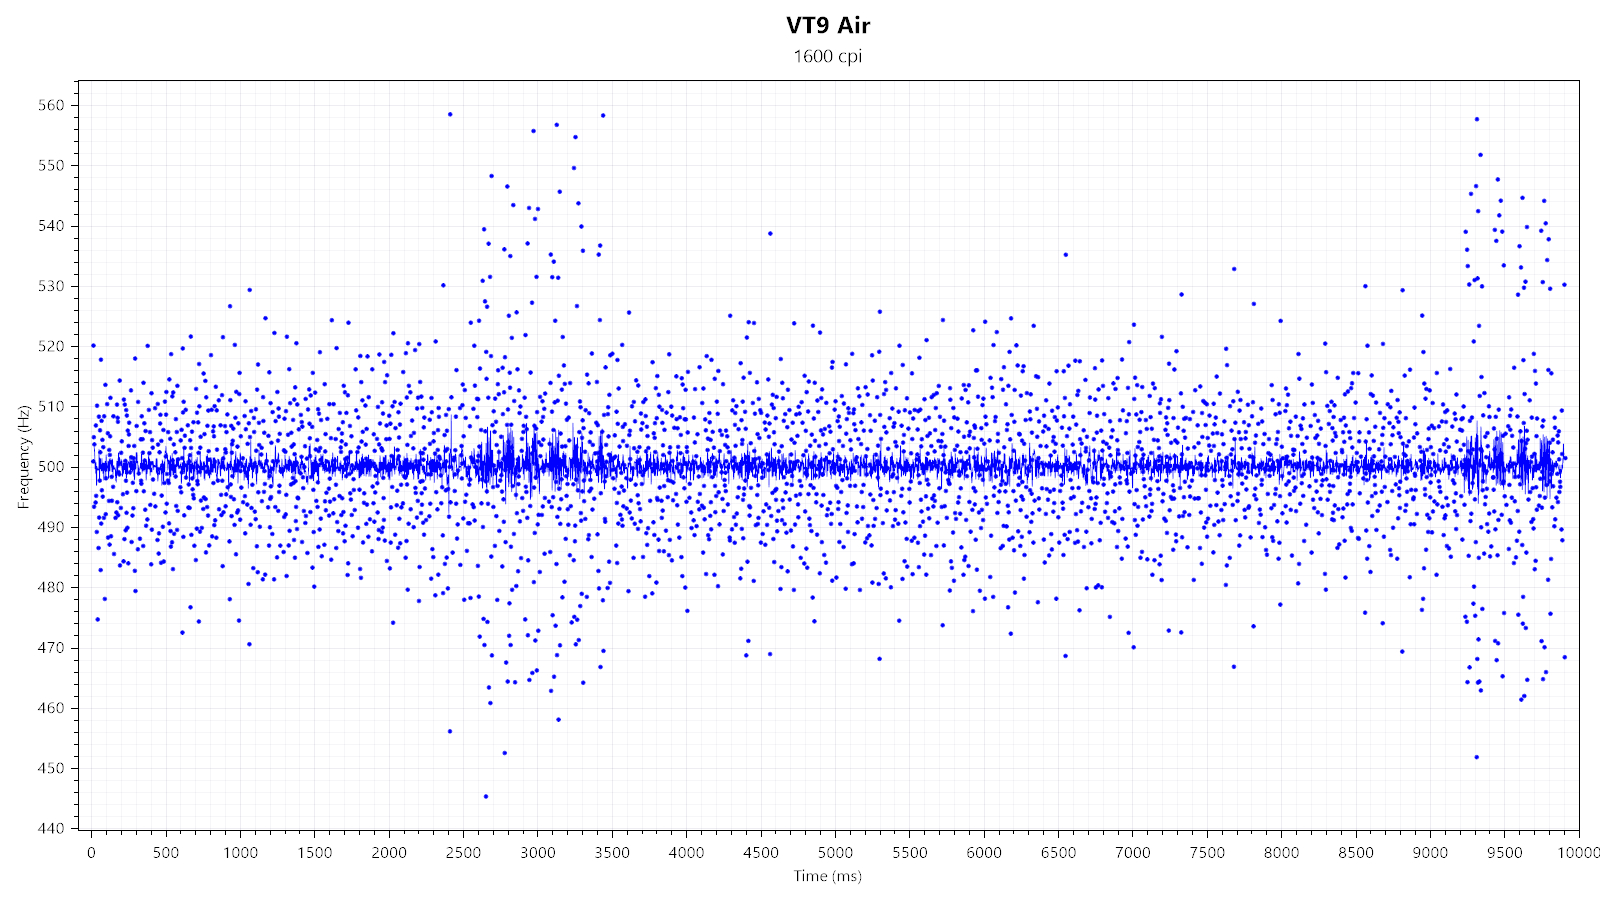
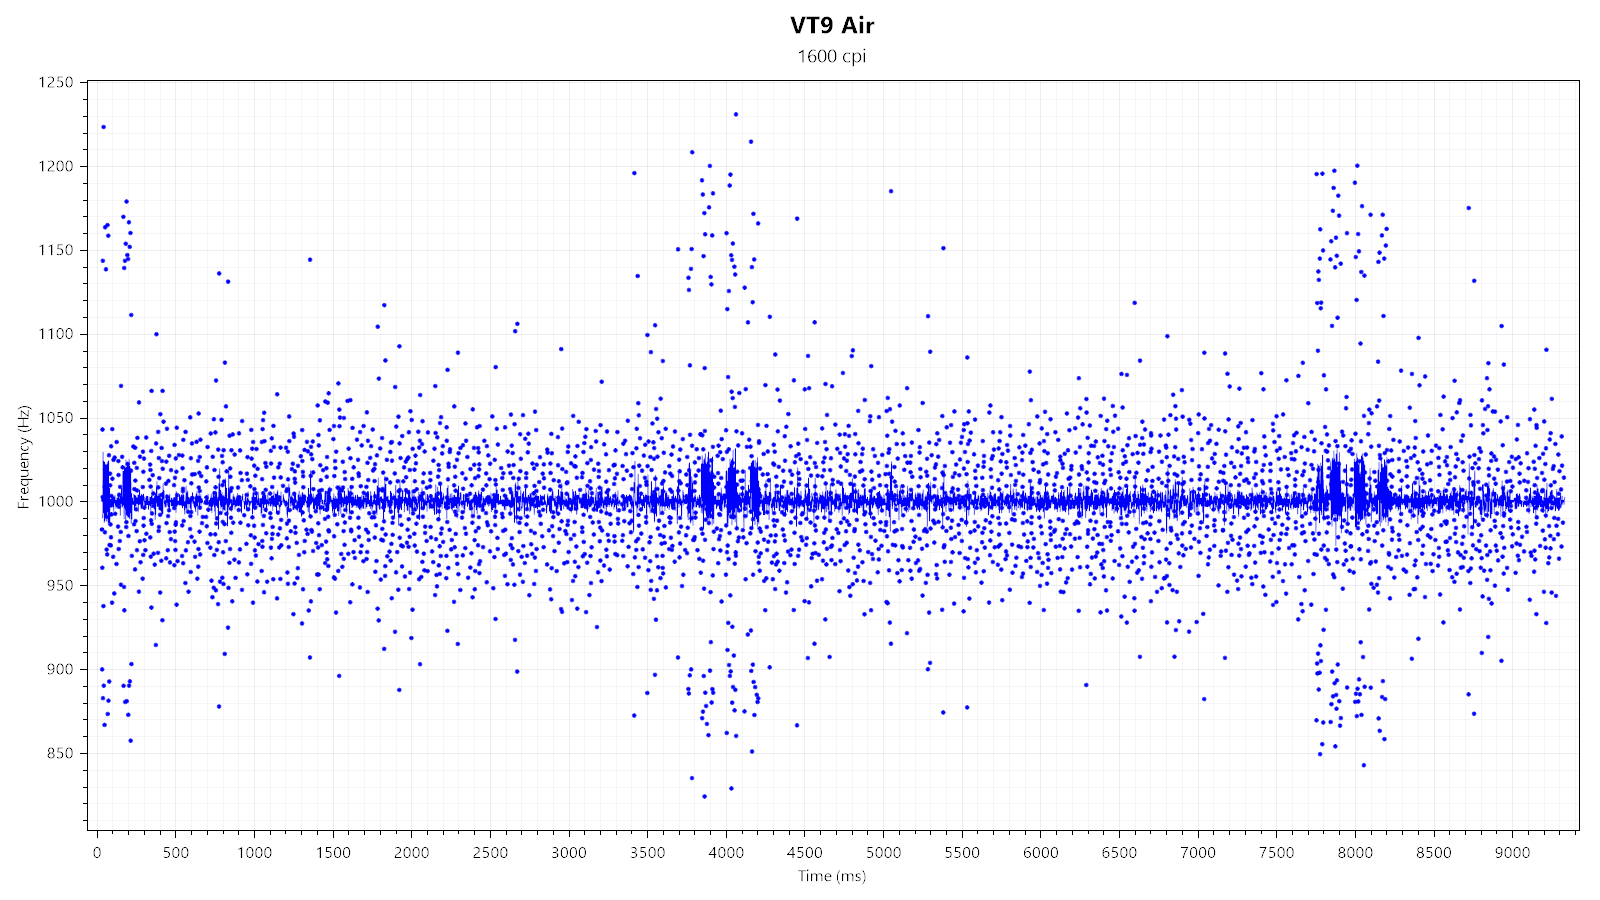
"Motion delay" encompasses all kinds of sensor lag. Any further sources of input delay will not be recorded in this test. The main thing I'll be looking for in this test is sensor smoothing, which describes an averaging of motion data across several capture frames, in order to reduce jitter at higher CPI values, increasing motion delay along with it. The goal here is to have as little smoothing as possible. As there is no way to accurately measure motion delay absolutely without special equipment, it is done by comparison with a control subject that has been determined to have consistent and low motion delay. In this case, the control subject is a Logitech G403, whose PMW3366 sensor has no visible smoothing across the entire CPI range. Note that the G403 is moved first and thus receives a slight head start.Wired testing
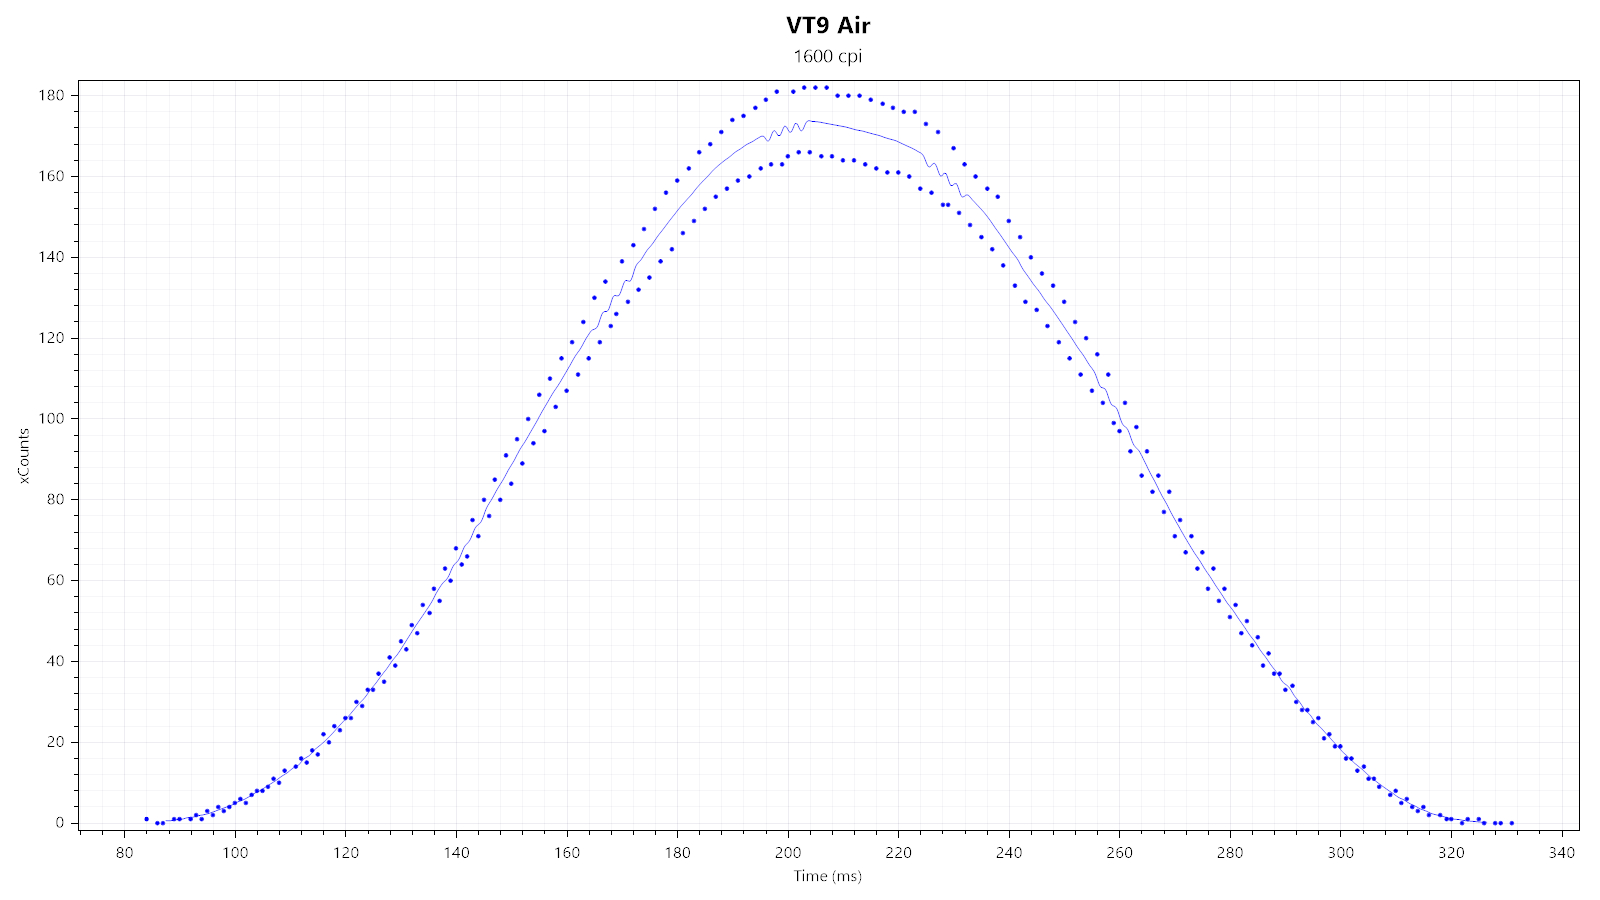
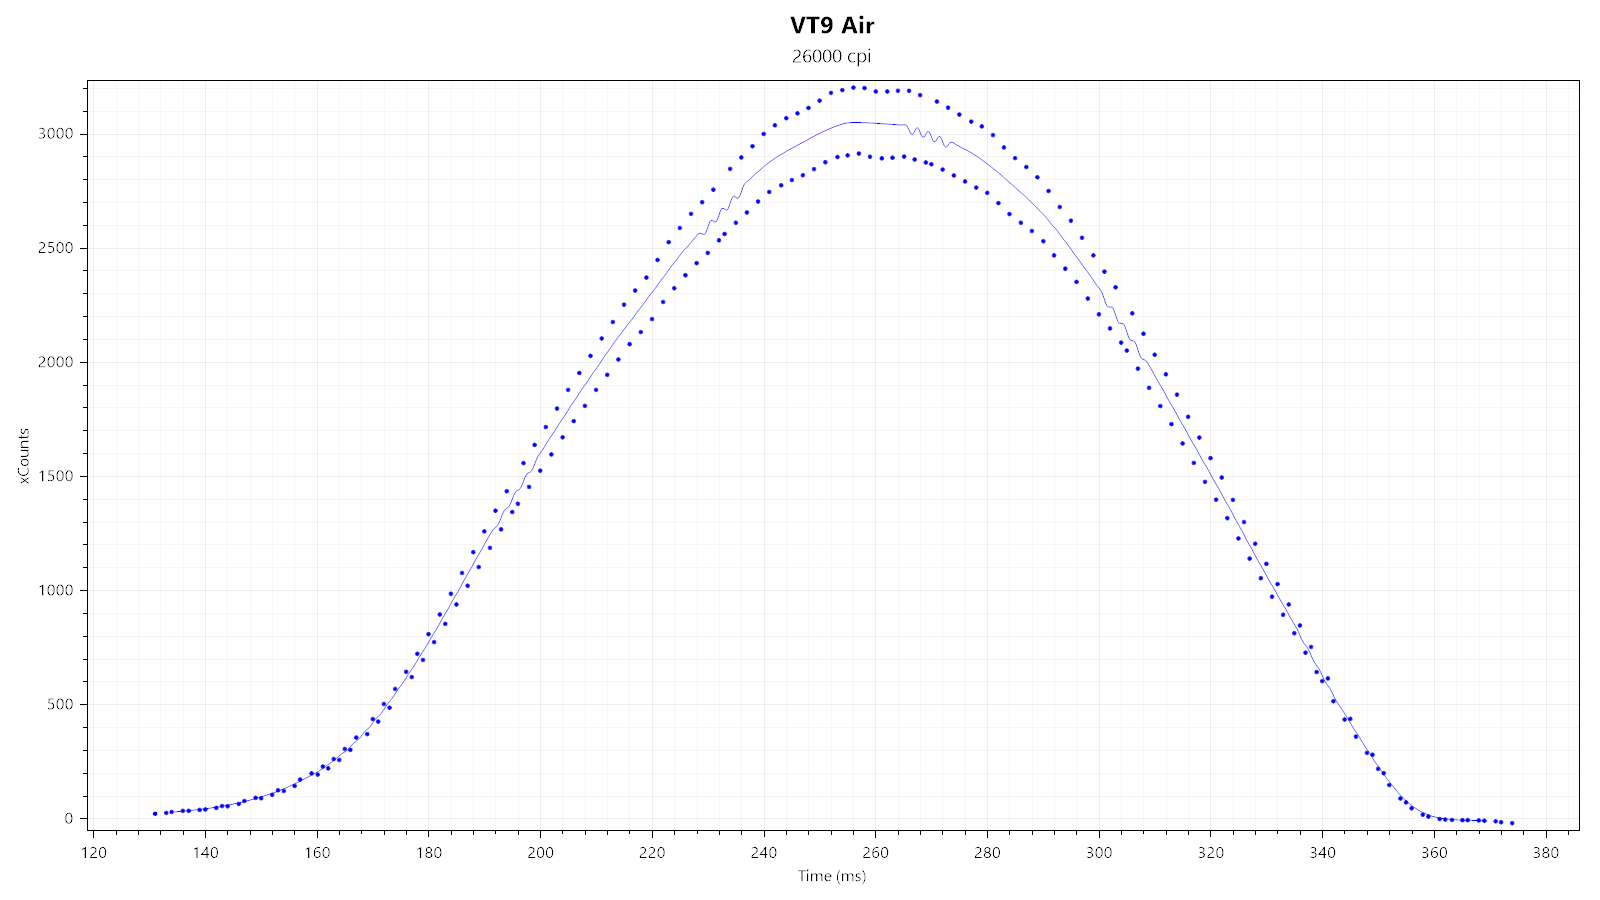
First, I'm looking at two xCounts plots—generated at 1600 and 26,000 CPI—to quickly gauge whether there is any smoothing, which would be indicated by any visible "kinks." As you can see, neither plot shows any, which strongly suggests there not being any smoothing.

Furthermore, the VT9 Air allows enabling MotionSync, which reduces SPI timing jitter.
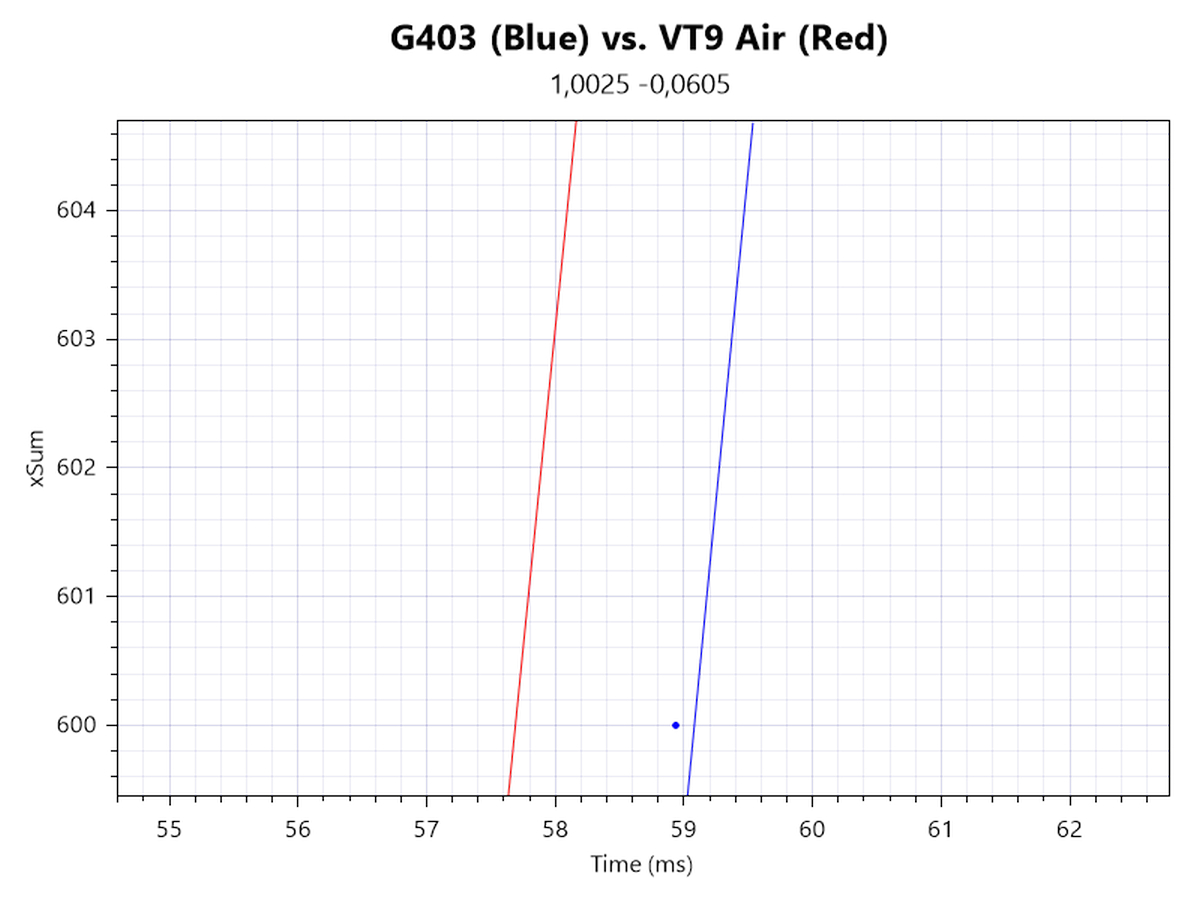
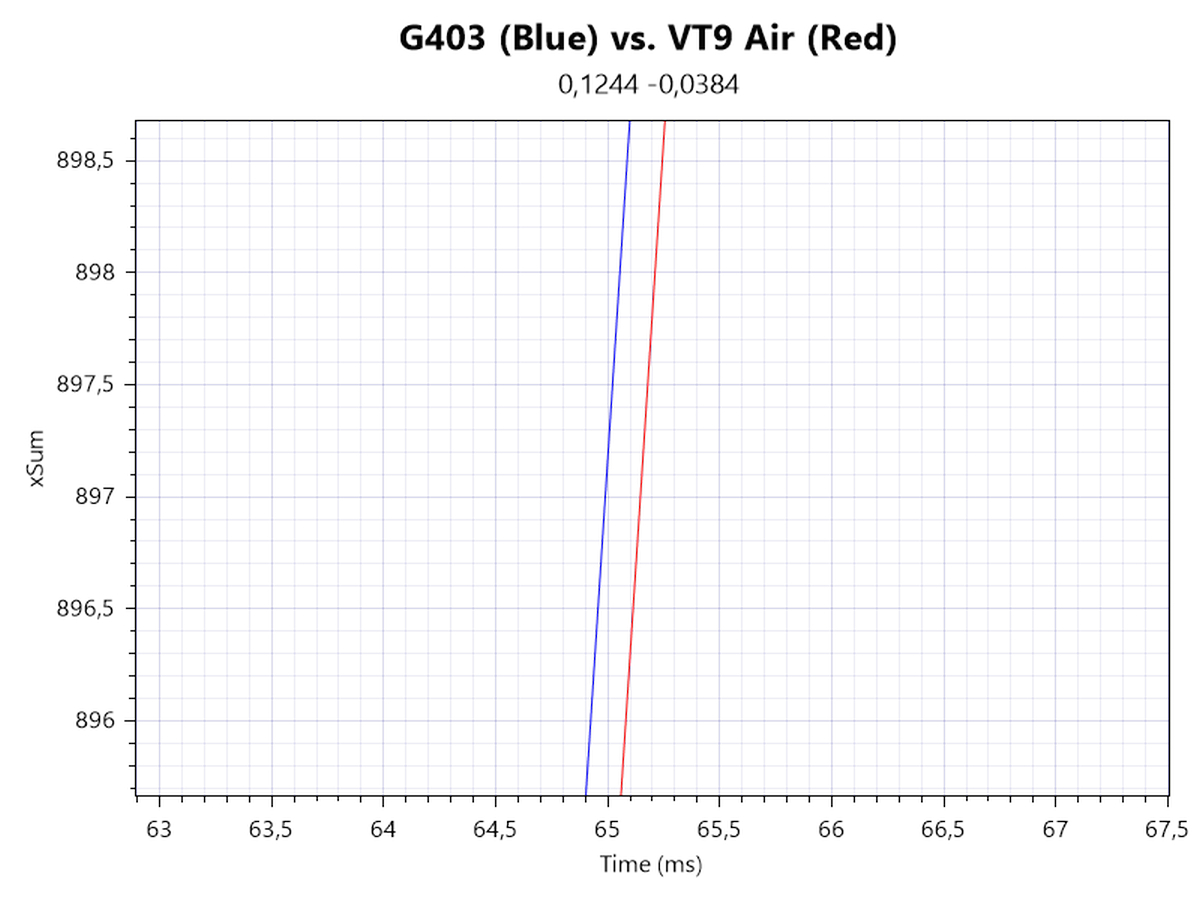
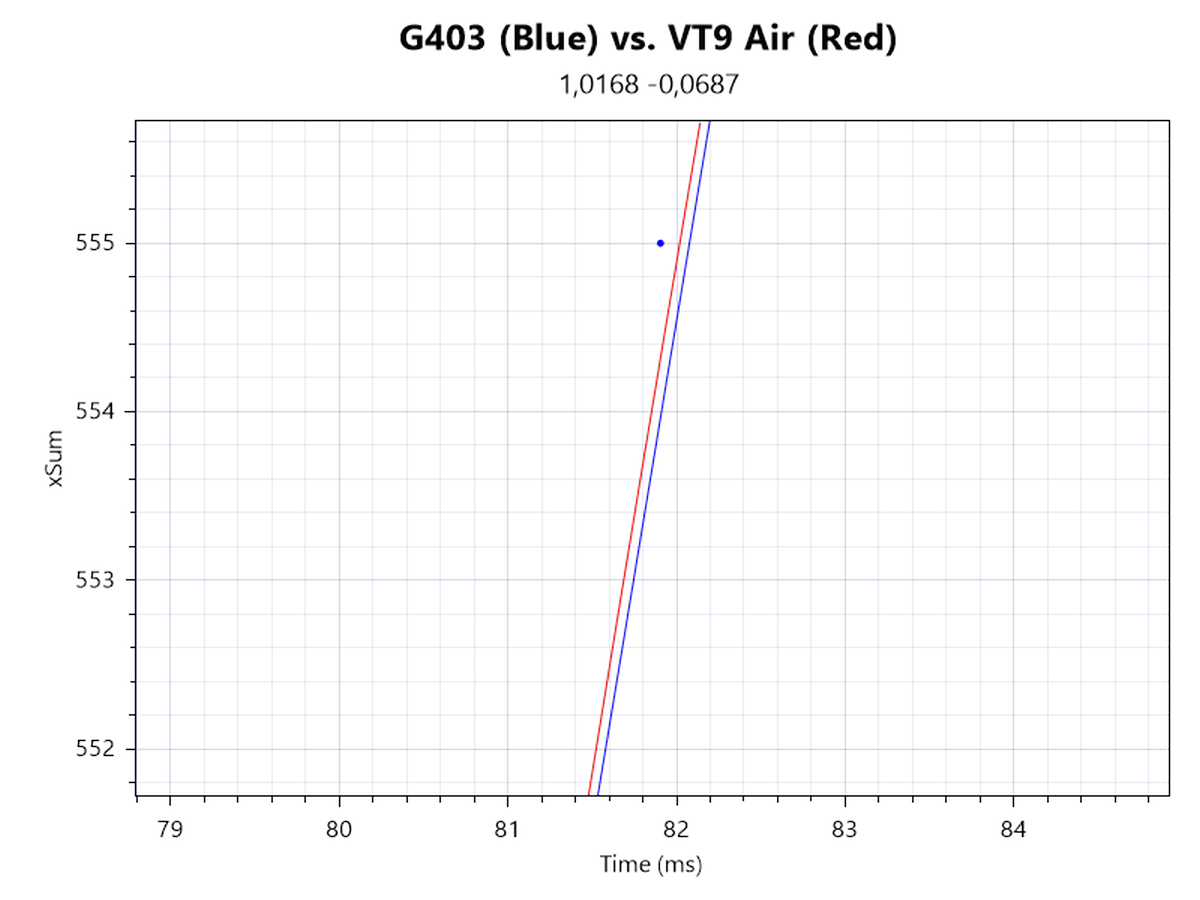
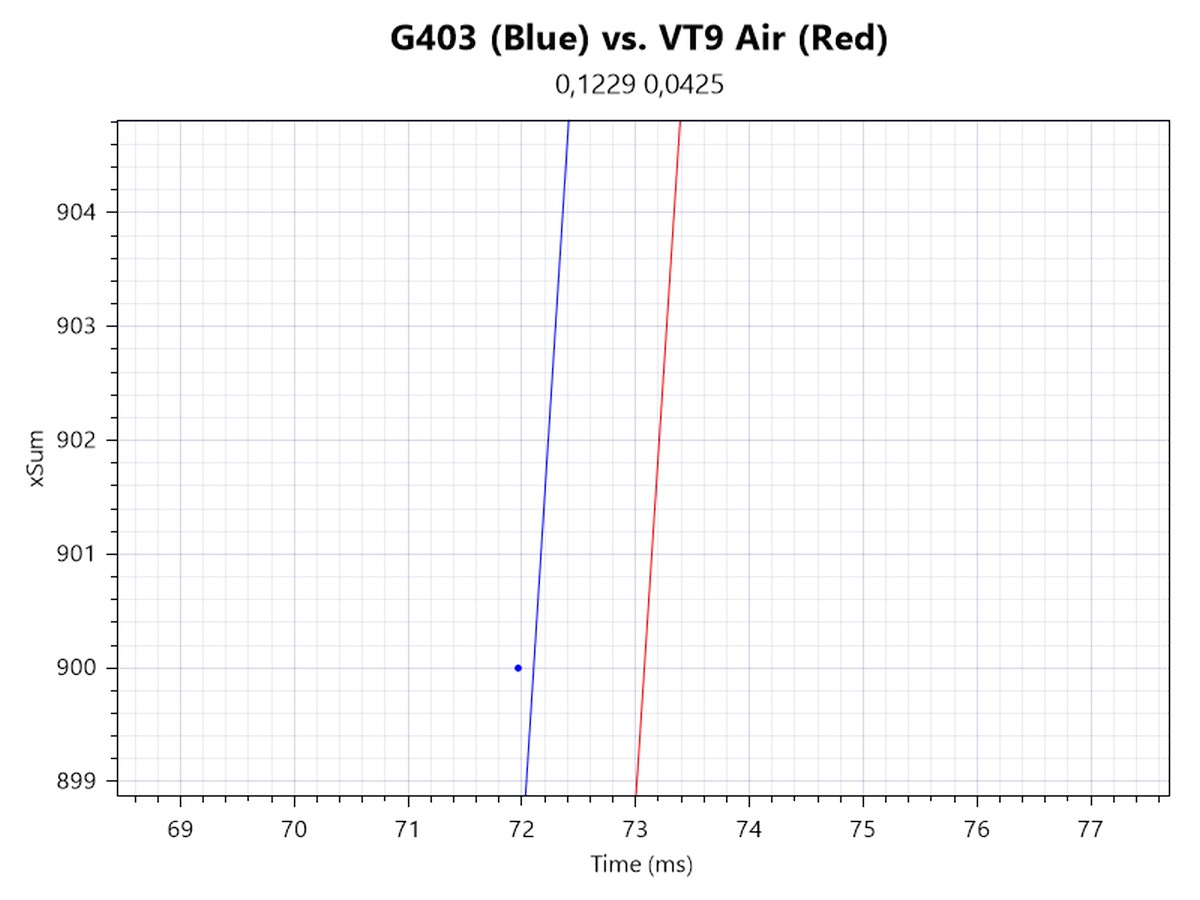
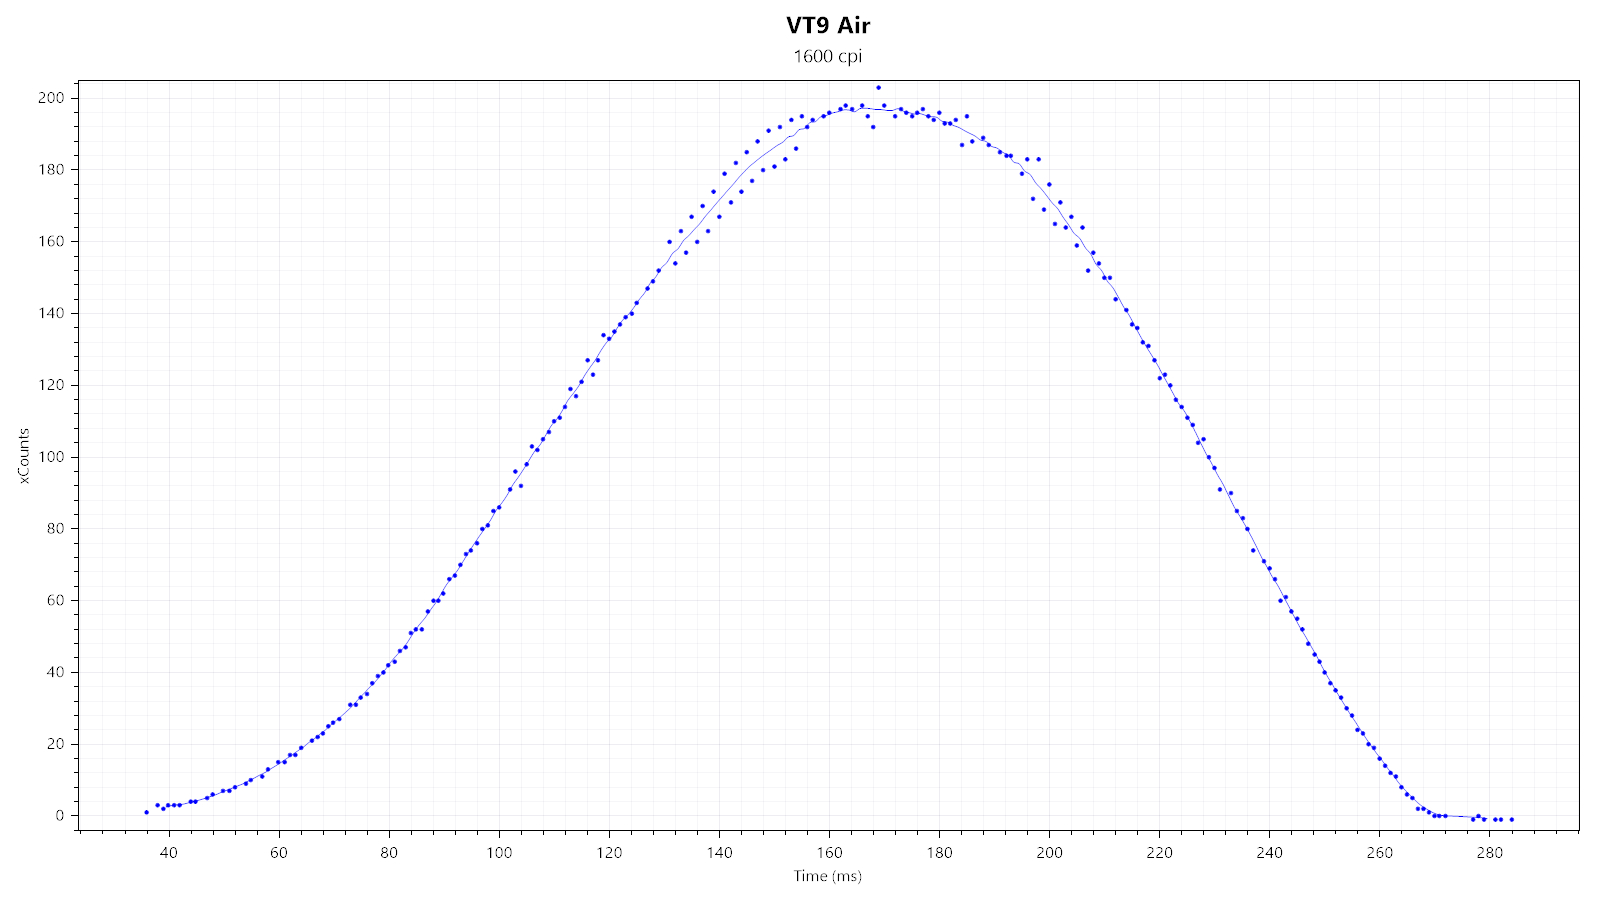
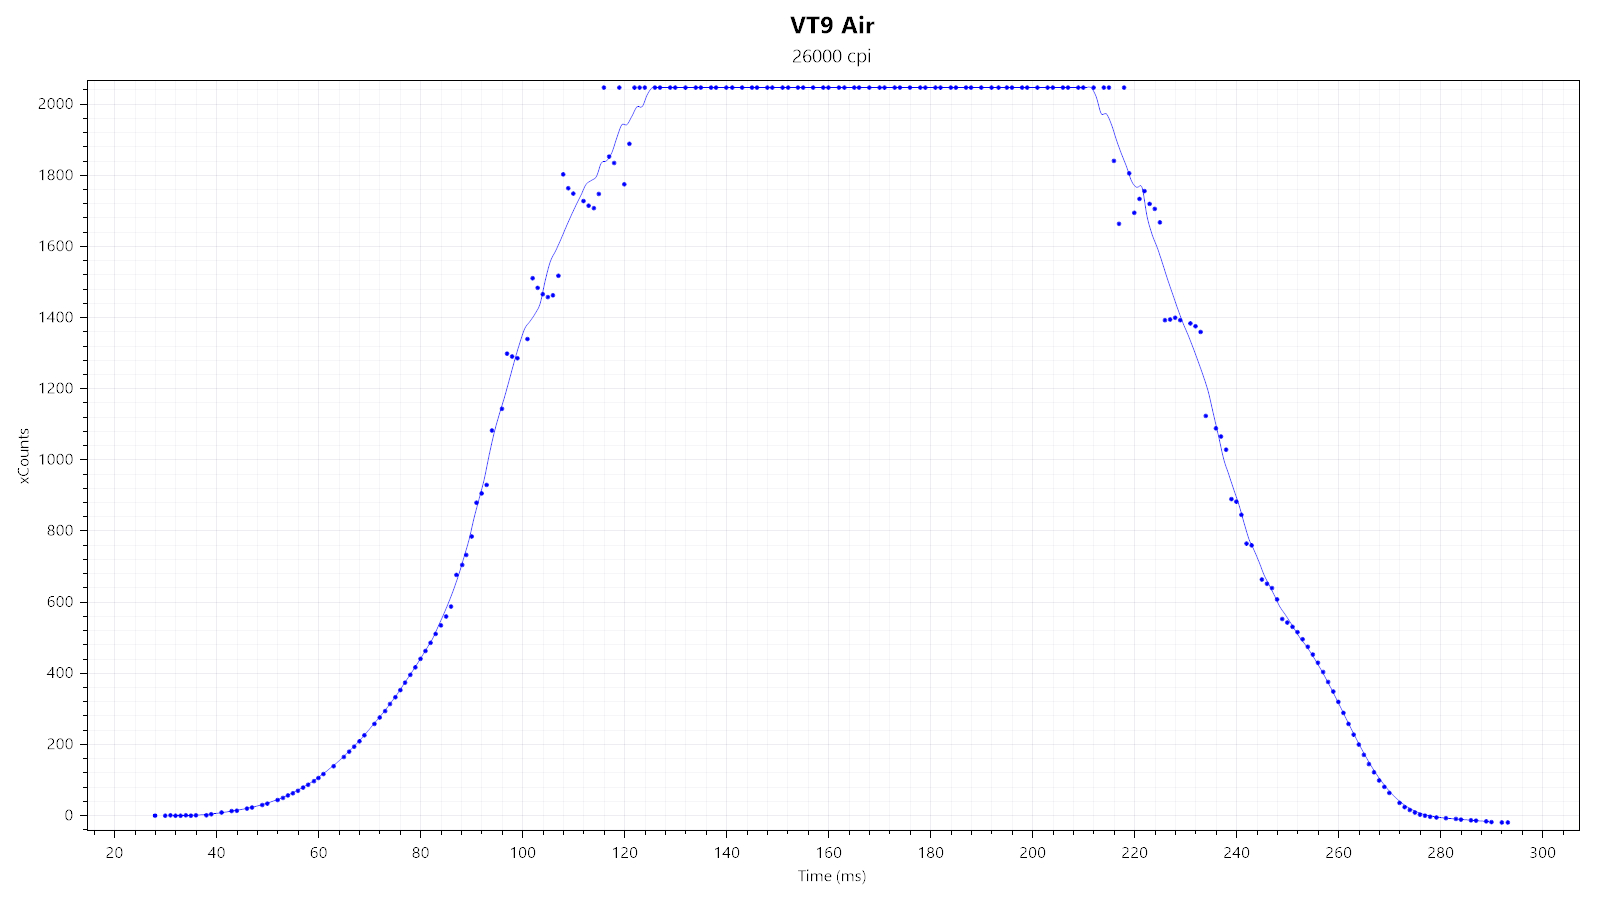
In order to determine motion delay, I'm looking at xSum plots generated at 1600 and 26,000 CPI. The line further to the left denotes the sensor with less motion delay. Without MotionSync (first row), the VT9 Air is ahead by more than 1 ms, whereas 26,000 CPI shows no motion delay differential. This is curious in that smoothing is explicitly turned off within the software. With MotionSync (second row), there is no motion delay differential at 1600 CPI, whereas 26,000 CPI shows a motion delay differential of 1 ms.
Wireless testing
At 1600 CPI, the difference compared to wired is due to a different sensor run mode being used. 26,000 CPI shows a malfunction which is likely due to a 12-bit HID descriptor. As such, if a report contains more than 2047 counts (+/-), a malfunction is the consequence.
Upon enabling MotionSync, SPI timing jitter is lowered.
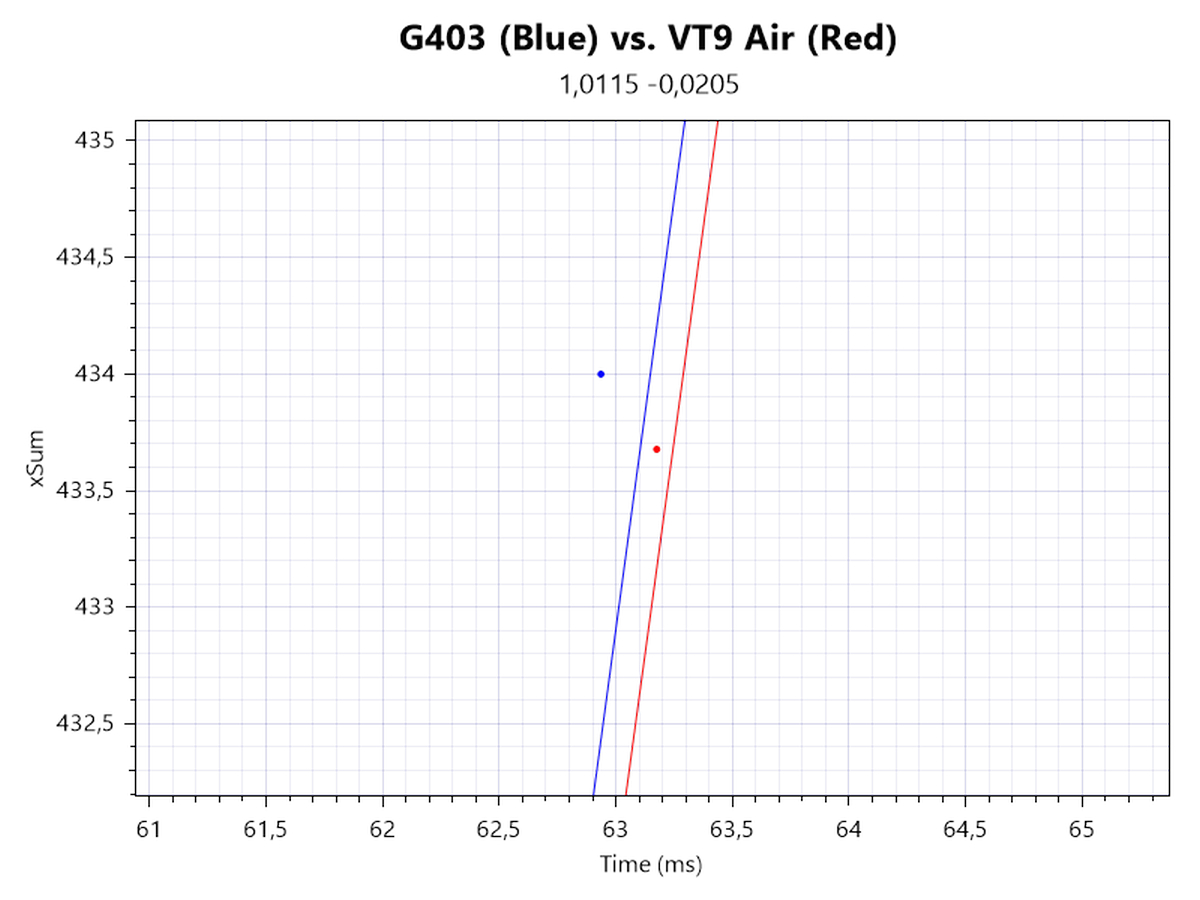
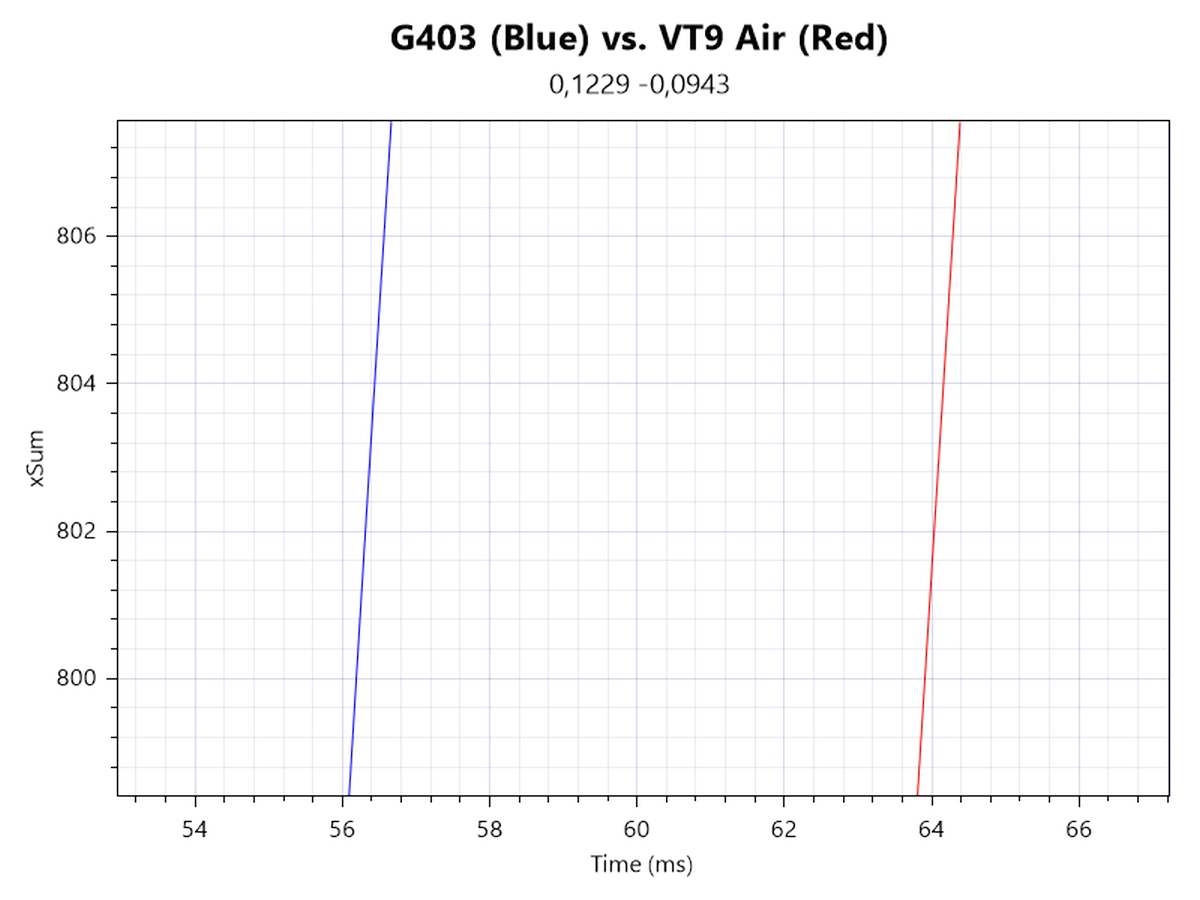
Once again, 1600 and 26,000 CPI are tested. Without MotionSync (first row), the VT9 Air is still ahead by close to 0.5 ms at 1600 CPI, whereas at 26,000 CPI, it is behind by more than 7 ms, no doubt due to smoothing. With MotionSync (second row), there is no motion delay differential at 1600 CPI, whereas 26,000 CPI now shows a motion delay differential of close to 8 ms.
Speed-related Accuracy Variance (SRAV)
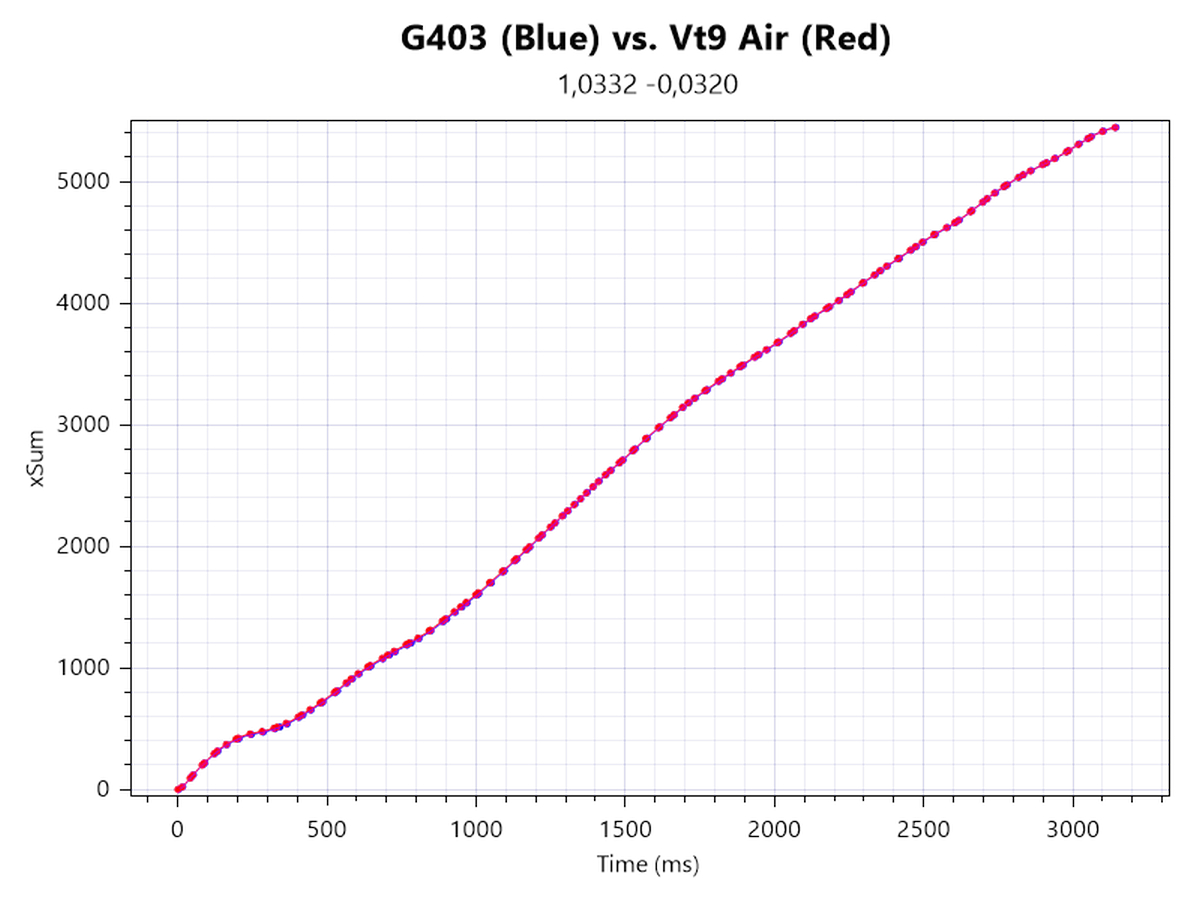
What people typically mean when they talk about "acceleration" is speed-related accuracy variance (or SRAV). It's not about the mouse having a set amount of inherent positive or negative acceleration, but about the cursor not traveling the same distance if the mouse is moved the same physical distance at different speeds. The easiest way to test this is by comparison with a control subject that is known to have very low SRAV, which in this case is the G403. As you can see from the plot, no displacement between the two cursor paths can be observed, which confirms that SRAV is very low.
Perfect Control Speed
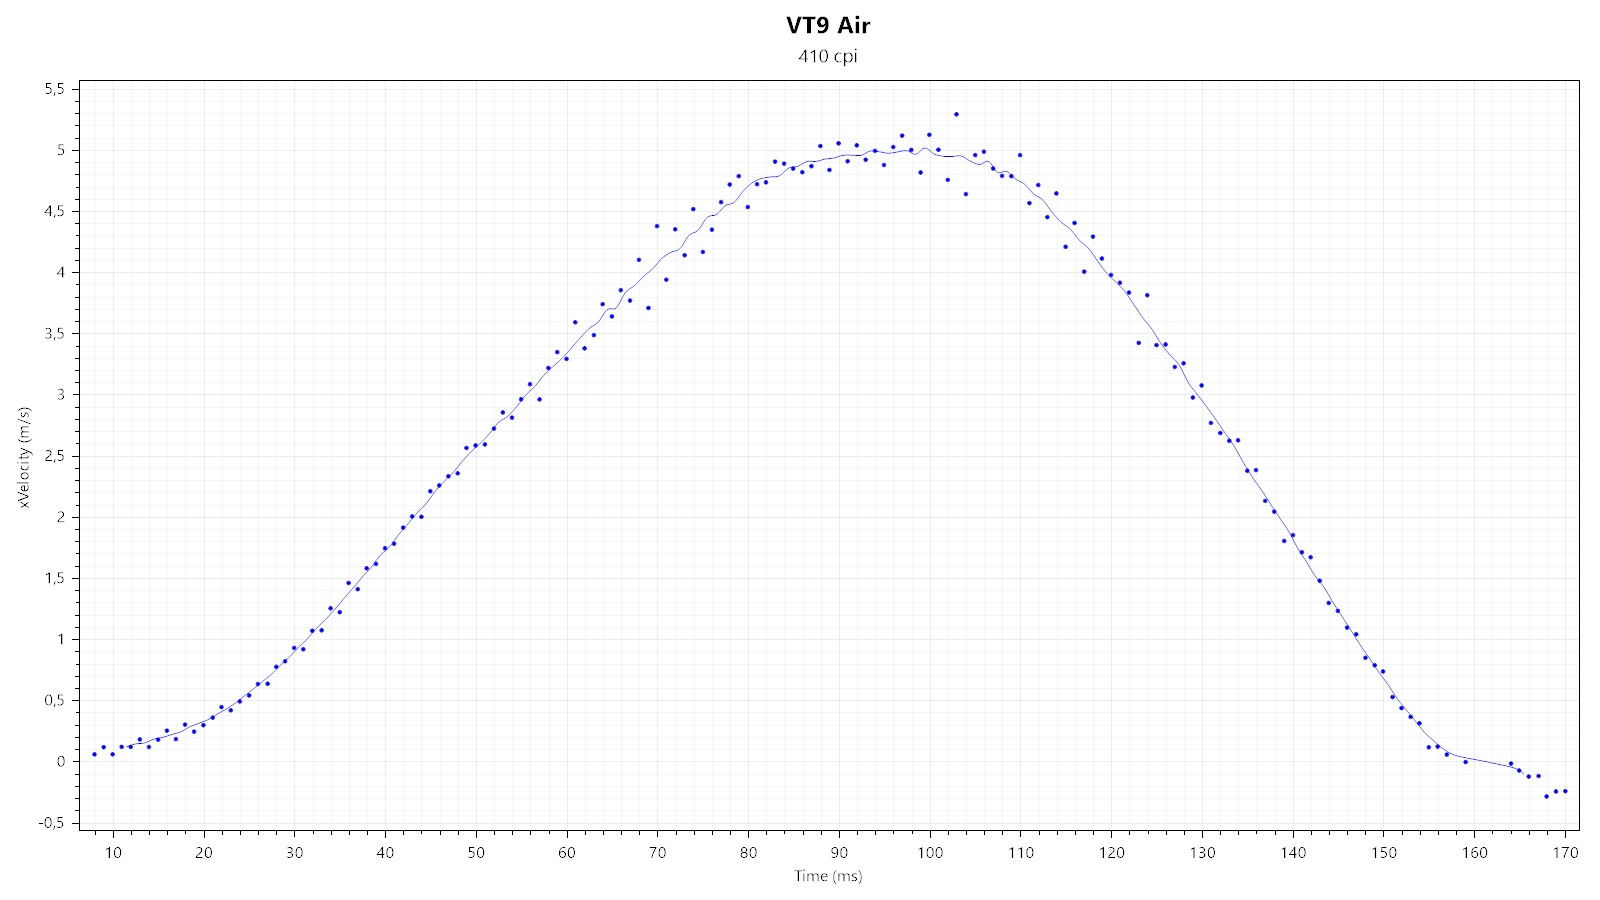
Perfect Control Speed (or PCS for short) is the maximum speed up to which the mouse and its sensor can be moved without the sensor malfunctioning in any way. I've only managed to hit a measly 5 m/s, which is within the proclaimed PCS range and causes no observable sensor malfunction.
Polling Rate Stability
Considering the VT9 Air is usable as a wired mouse as well, I'll be testing polling rate stability for both wired and wireless use.Wired testing
All the available polling rates (125, 250, 500, and 1000 Hz) look and perform fine.
Wireless testing
For wired mice, polling rate stability merely concerns the wired connection between the mouse (SPI communication) and USB. For wireless mice, another device that needs to be kept in sync between the first two is added to the mix: the wireless dongle/wireless receiver. I'm unable to measure all stages of the entire end-to-end signal chain individually, so testing polling-rate stability at the endpoint (the USB) has to suffice here.
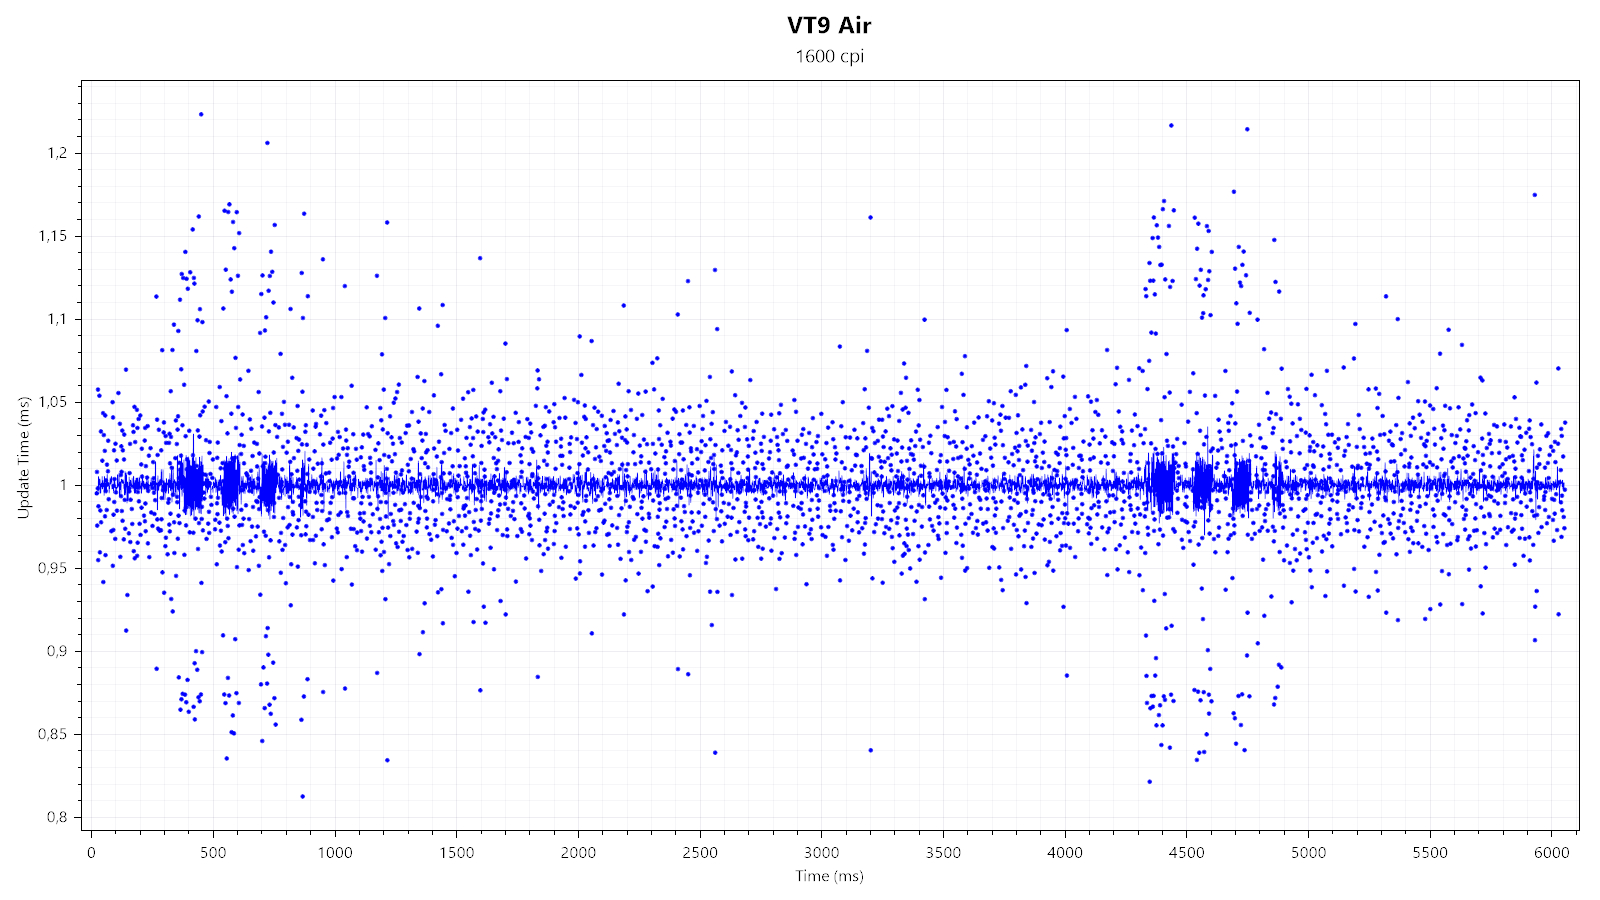
First, I'm testing whether SPI, wireless, and USB communication are synchronized. Any of these being out of sync would be indicated by at least one 2 ms report, which would be the result of any desynchronization drift accumulated over time. While no 2 ms polls are visible, bouts of elevated noise are common and plainly visible.
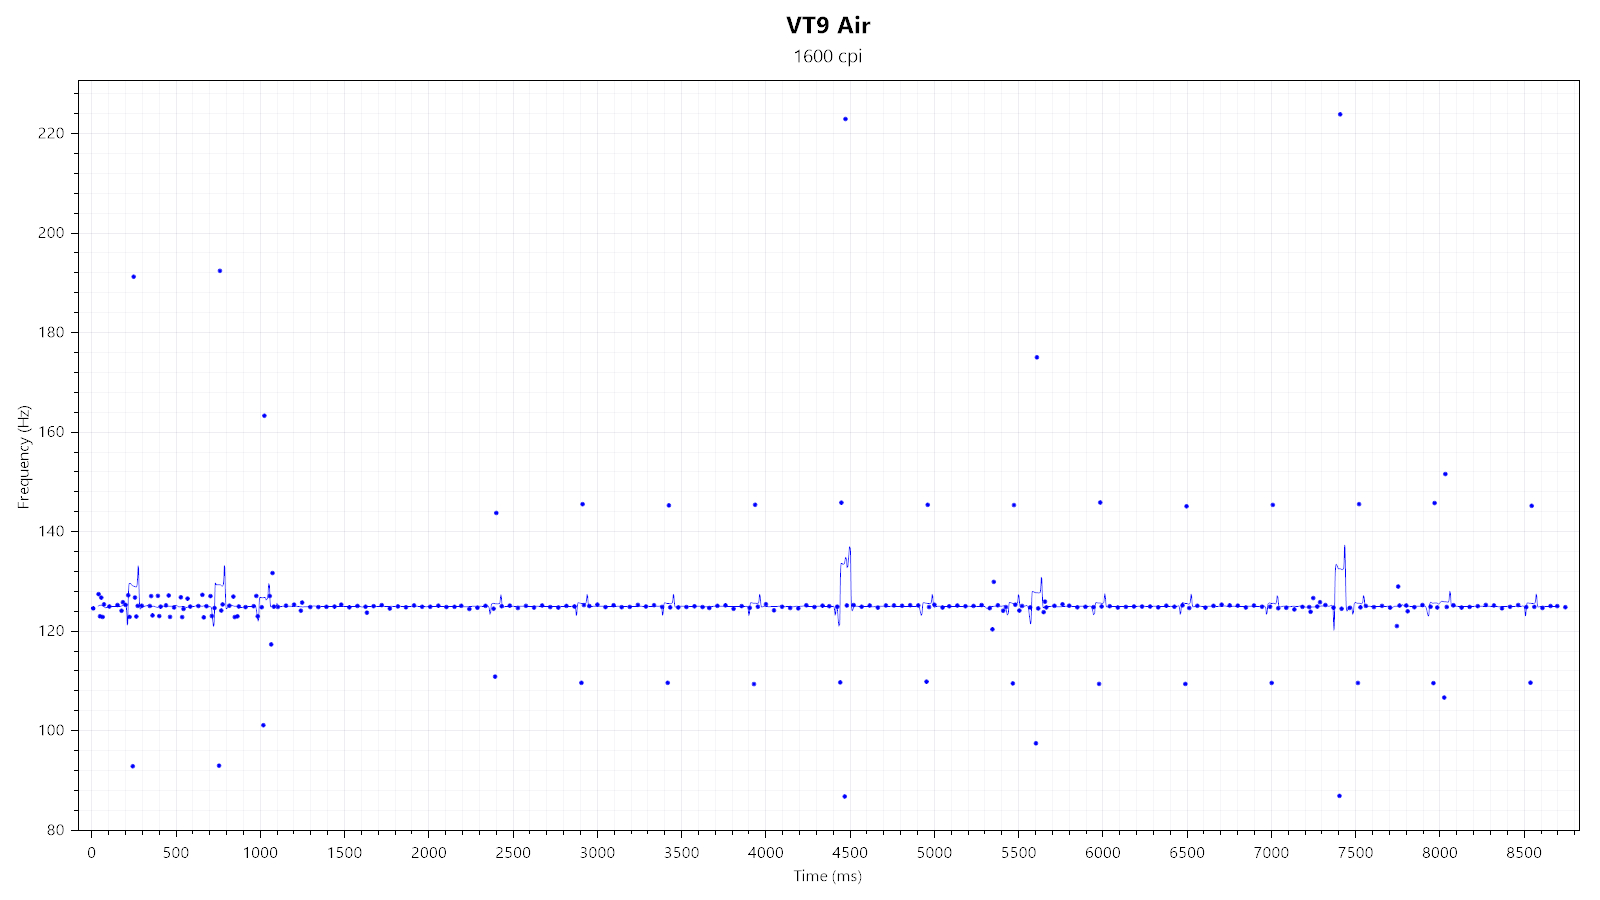
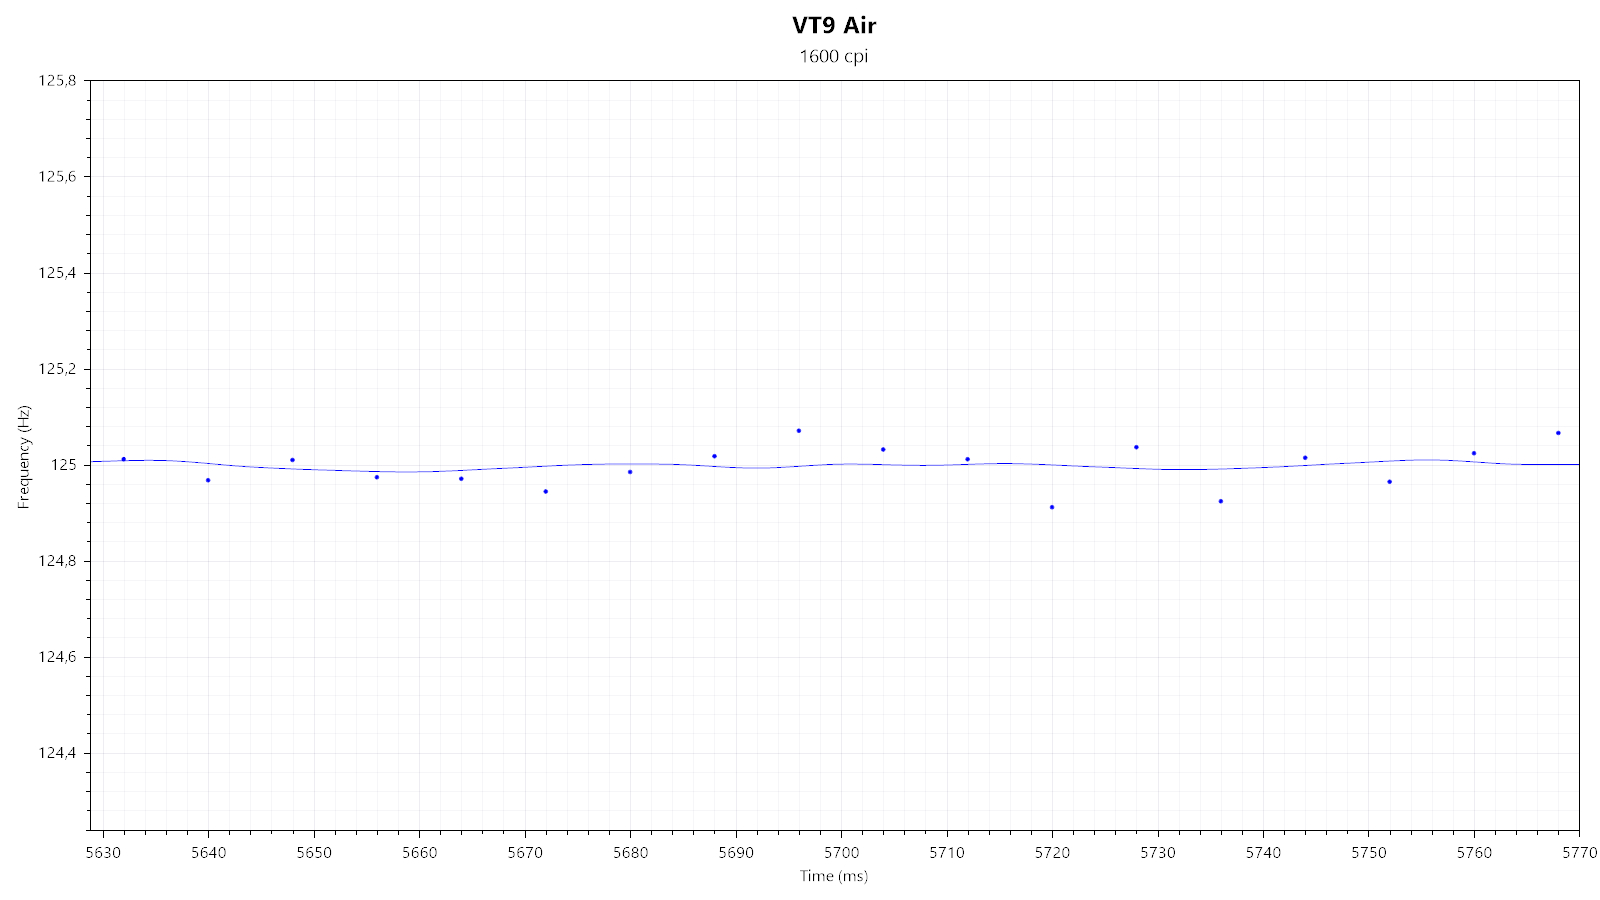
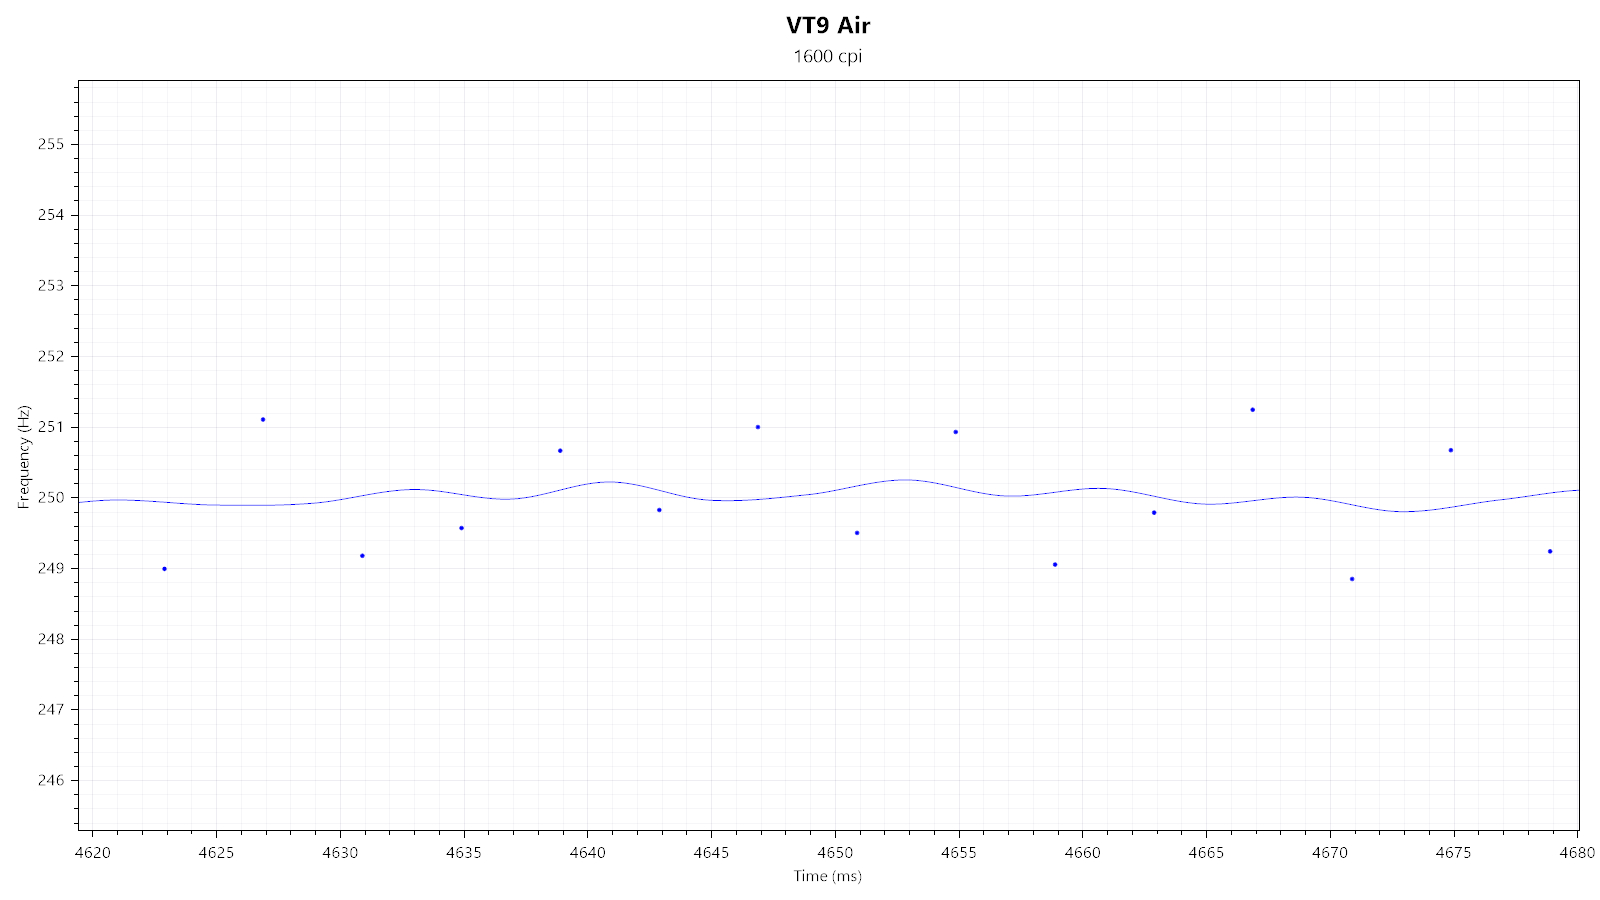
Second, I'm testing the general polling-rate stability of the individual polling rates in wireless mode. Running the VT9 Air at a lower polling rate can have the benefit of extending battery life. All polling rates show periodic outliers and general instability of various degrees.
Paint Test
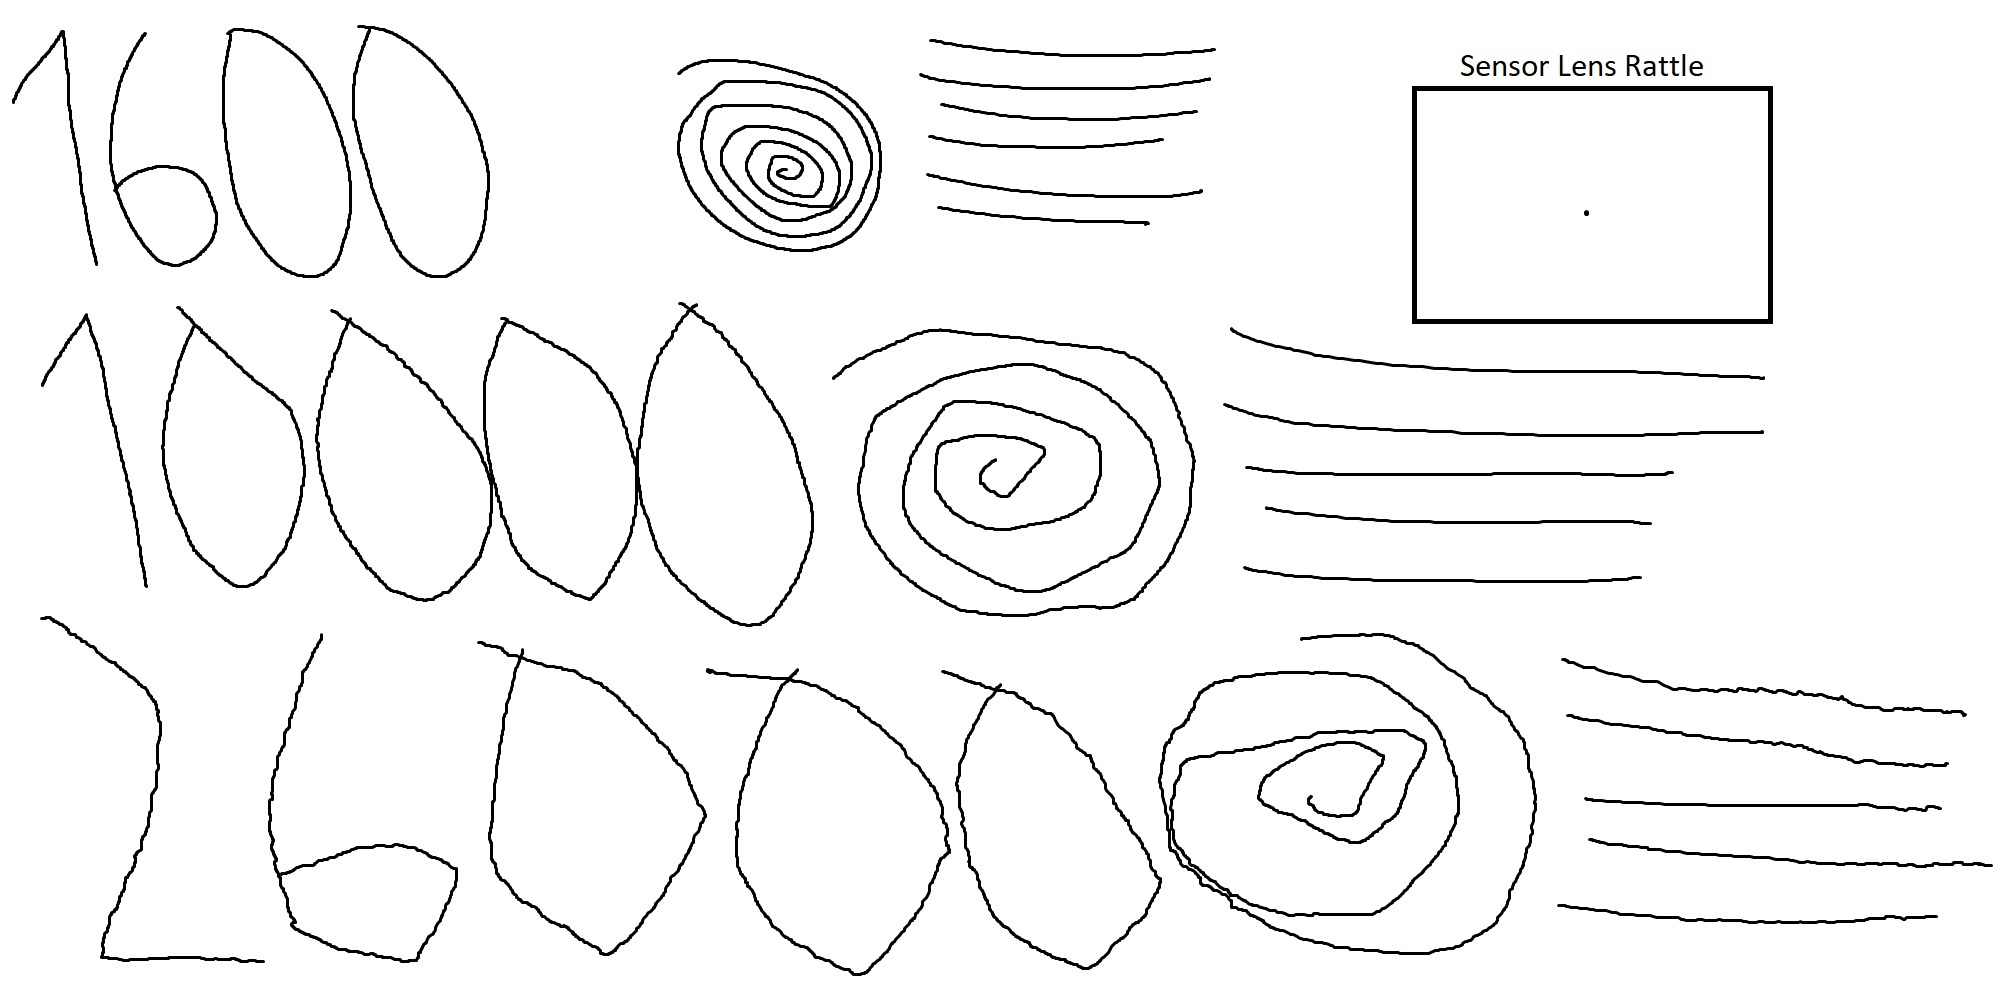
This test is used to indicate any potential issues with angle snapping (non-native straightening of linear motion) and jitter, along with any sensor lens rattle. As you can see, no issues with angle snapping can be observed. There is no jitter visible at 1600 CPI. 10,000 CPI already shows minor to moderate jitter, which is amplified to major levels at 26,000 CPI. Keep in mind that this test has been performed in wired operation, where less smoothing is applied compared to wireless. Lastly, there is no lens movement.
Lift-off Distance
The VT9 Air offers eleven pre-defined LOD levels. Between the "1.0" and "1.4" settings, the sensor does not track at a height of one DVD (<1.2 mm). At and above the "1.5" setting, the sensor does track at a height of one DVD (1.2 mm<x<2.4 mm, with x being LOD height), but not at a height of two DVDs. Keep in mind that LOD may vary slightly depending on the mousing surface (pad) it is being used on.Click Latency

In most computer mice, debouncing is required to avoid double clicks, slam-clicks, or other unintended effects of switch bouncing. Debouncing typically adds a delay, which, along with any potential processing delay, shall be referred to as click latency. In order to measure click latency, the mouse has been interfaced with an NVIDIA LDAT (Latency Display Analysis Tool). Many thanks go to NVIDIA for providing an LDAT device. More specifically, the LDAT measures the time between the electrical activation of the left main button and the OS receiving the button-down message. Unless noted otherwise, the values presented in the graph refer to the lowest click latency possible on the mouse in question. If a comparison mouse is capable of both wired and wireless operation, only the result for wireless (2.4 GHz) operation will be listed. All the listed values have been gathered without any sensor motion. If latency differs between no motion and motion, it will be noted as such.
In wired mode, click latency has been measured to be 3.1 ms, with standard deviation being 0.08 ms. In wireless mode and at a polling rate of 1000 Hz, click latency has been measured to be 3.4 ms, with standard deviation being 0.28 ms. In wireless mode and at a polling rate of 2000 Hz, click latency has been measured to be 3.0 ms, with standard deviation being 0.19 ms. In wireless mode and at a polling rate of 4000 Hz, click latency has been measured to be 2.9 ms, with standard deviation being 0.20 ms. Finally, in wireless mode and at a polling rate of 8000 Hz, click latency has been measured to be 2.8 ms, with standard deviation being 0.12 ms. The debounce time setting has no effect on click latency whatsoever.
After roughly three seconds of button and sensor inactivity, roughly 3 ms of click latency are added to the next click.
The main button switches were measured to be running at 3.34 V. I'm not aware of the voltage specifications of the used Omron D2FC-F-K (60 M) (China) switches, but I consider it very likely that these are running within specifications.
Jul 5th, 2025 23:20 CDT
change timezone
Latest GPU Drivers
New Forum Posts
- Help Watercooling my PC (8)
- Will you buy a RTX 5090? (627)
- RX 9000 series GPU Owners Club (1128)
- 9800x3d temps (3)
- Last game you purchased? (862)
- TPU's Rosetta Milestones and Daily Pie Thread (2375)
- What are you playing? (23897)
- Folding Pie and Milestones!! (9607)
- Do you game on a handheld console? (98)
- TPU's Nostalgic Hardware Club (20486)
Popular Reviews
- NVIDIA GeForce RTX 5050 8 GB Review
- Fractal Design Scape Review - Debut Done Right
- Crucial T710 2 TB Review - Record-Breaking Gen 5
- ASUS ROG Crosshair X870E Extreme Review
- Sapphire Radeon RX 9060 XT Pulse OC 16 GB Review - An Excellent Choice
- PowerColor ALPHYN AM10 Review
- Upcoming Hardware Launches 2025 (Updated May 2025)
- AMD Ryzen 7 9800X3D Review - The Best Gaming Processor
- Sapphire Radeon RX 9070 XT Nitro+ Review - Beating NVIDIA
- NVIDIA GeForce RTX 5060 8 GB Review
TPU on YouTube
Controversial News Posts
- Intel's Core Ultra 7 265K and 265KF CPUs Dip Below $250 (288)
- NVIDIA Grabs Market Share, AMD Loses Ground, and Intel Disappears in Latest dGPU Update (212)
- Some Intel Nova Lake CPUs Rumored to Challenge AMD's 3D V-Cache in Desktop Gaming (140)
- NVIDIA GeForce RTX 5080 SUPER Could Feature 24 GB Memory, Increased Power Limits (115)
- Microsoft Partners with AMD for Next-gen Xbox Hardware (105)
- NVIDIA Launches GeForce RTX 5050 for Desktops and Laptops, Starts at $249 (105)
- AMD Radeon RX 9070 XT Gains 9% Performance at 1440p with Latest Driver, Beats RTX 5070 Ti (102)
- Intel "Nova Lake‑S" Series: Seven SKUs, Up to 52 Cores and 150 W TDP (100)