 52
52
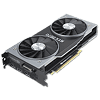
NVIDIA GeForce RTX 2070 Founders Edition Review
Temperatures & Clock Profiles »Overclocking
Overclocking results listed in this section are achieved with the default fan, power, and voltage settings as defined in the VGA BIOS. We choose this approach as it is the most realistic scenario for most users.Every sample overclocks differently, which is why our results here can only serve as a guideline for what you can expect from your card.

Overclocking on Turing is massively complicated by the fact that the power limit is always limiting the clock frequencies. So you can't just dial in a frequency to test and then run any game to test for stability. The issue here is that another game might cause loads that are lighter, which causes higher boost clocks, leading to a crash due to too much overclocking.
With Turing, NVIDIA provides an automated way to scan for the maximum stable overclock through software, which tests each point on the voltage-frequency curve manually. While the end result was stable, performance was a few percent lower than what we had achieved with manual overclocking.
With manual overclocking, the maximum overclock of our sample is 1985 MHz on the memory (13% overclock) and +170 MHz to the GPU's base clock, which increases maximum Boost from 1935 MHz to 2040 MHz (5% overclock).
| Maximum Overclock Comparison | ||
|---|---|---|
| Max. GPU Clock | Max. Memory Clock | |
| NVIDIA RTX 2070 Founders Edition | 2040 MHz | 1985 MHz |
| ASUS RTX 2080 Ti STRIX | 2115 MHz | 2065 MHz |
| MSI RTX 2080 Ti Duke | 2115 MHz | 2005 MHz |
| MSI RTX 2080 Ti Gaming X Trio | 2085 MHz | 2005 MHz |
| NVIDIA RTX 2080 Ti Founders Edition | 2110 MHz | 1945 MHz |
| Zotac RTX 2080 Ti AMP | 2145 MHz | 2000 MHz |
| ASUS RTX 2080 STRIX | 2085 MHz | 1940 MHz |
| Gigabyte RTX 2080 Gaming OC | 2040 MHz | 2070 MHz |
| MSI RTX 2080 Gaming X Trio | 2115 MHz | 1995 MHz |
| NVIDIA RTX 2080 Founders Edition | 2100 MHz | 1980 MHz |
| Palit RTX 2080 Gaming Pro | 2085 MHz | 2070 MHz |
| Palit RTX 2080 Super JetStream | 2040 MHz | 2010 MHz |
differently based on random production variances. This table just serves to provide a list of typical
overclocks for similar cards, determined during TPU review.
Overclocked Performance
Using these clock frequencies, we ran a quick test of Unigine Heaven to evaluate the gains from overclocking.
Actual 3D performance gained from overclocking is 8.1%.
Power Limits
All NVIDIA graphics cards have a power limit defined in the BIOS, which limits power draw by adjusting Boost frequencies accordingly. A second limit exists that defines the maximum TDP adjustment limit for user overclocking; i.e., how far the power slider will go. In the second chart, the (+xx%) value lists the percentage increase from the tested card's default power limit to the highest manual setting available—the slider's adjustment range.

Mar 4th, 2025 02:48 EST
change timezone
Latest GPU Drivers
New Forum Posts
- Possible psu failure after 9 years? (11)
- Issues with clock speed not increasing (37)
- Will you buy a RTX 5090? (426)
- Was pentium 4 an over engineered CPU? (96)
- Authenticode fails for GPU-Z 2.63.0 (21)
- Zotac RTX 3060Ti Twin Edge OC LHR PCB image (11)
- 3DMARK "LEGENDARY" (274)
- Found a weird Radeon HD 7950 with 1536 shaders and no temperature readout (29)
- The future of RDNA on Desktop. (36)
- Windows 11 General Discussion (5769)
Popular Reviews
- AMD Radeon RX 9070 Series Technical Deep Dive
- ASUS GeForce RTX 5070 Ti TUF OC Review
- be quiet! Pure Base 501 DX Review
- AMD Ryzen 7 9800X3D Review - The Best Gaming Processor
- MSI GeForce RTX 5070 Ti Vanguard SOC Review
- RAWM ES21M Review
- EIZO FlexScan EV4340X Review - A Multitasking Powerhouse
- ASUS ROG Harpe Ace Mini Review
- MSI GeForce RTX 5070 Ti Ventus 3X OC Review
- MSI GeForce RTX 5070 Ti Gaming Trio OC+ Review
Controversial News Posts
- NVIDIA GeForce RTX 50 Cards Spotted with Missing ROPs, NVIDIA Confirms the Issue, Multiple Vendors Affected (513)
- AMD Plans Aggressive Price Competition with Radeon RX 9000 Series (277)
- AMD Radeon RX 9070 and 9070 XT Listed On Amazon - One Buyer Snags a Unit (260)
- AMD Mentions Sub-$700 Pricing for Radeon RX 9070 GPU Series, Looks Like NV Minus $50 Again (248)
- NVIDIA Investigates GeForce RTX 50 Series "Blackwell" Black Screen and BSOD Issues (244)
- AMD RDNA 4 and Radeon RX 9070 Series Unveiled: $549 & $599 (230)
- AMD Radeon RX 9070 and 9070 XT Official Performance Metrics Leaked, +42% 4K Performance Over Radeon RX 7900 GRE (195)
- AMD Radeon RX 9070-series Pricing Leaks Courtesy of MicroCenter (158)