 7
7
EVGA SuperNOVA 650 G2 Review
Efficiency, Temperatures & Noise »Test Setup

All measurements were performed using two Chroma 6314A mainframes equipped with the following electronic loads: six 63123A [350 W each], one 63102A [100 W x2], and one 63101A [200 W]. The aforementioned equipment is able to deliver 2500 W of load, and all loads are controlled by a custom-made software. The AC source is a Chroma 6530 capable of delivering up to 3 kW of power. We also used a Rigol DS2072A oscilloscope kindly sponsored by Batronix, a Picoscope 3424 oscilloscope, a Picotech TC-08 thermocouple data logger, two Fluke multimeters (models 289 and 175), a Keithley 2015 THD 6.5 digit bench DMM, and a lab grade N4L PPA1530 3-phase power analyzer along with a Yokogawa WT210 power meter. We also included a wooden box, which, along with some heating elements, was used as a hot box. Finally, we had at our disposal three more oscilloscopes (Rigol VS5042, Stingray DS1M12, and a second Picoscope 3424), and a Class 1 Bruel & Kjaer 2250-L G4 Sound Analyzer we equipped with a type 4189 microphone that features a 16.6-140 dBA-weighted dynamic range. You will find more details about our equipment and the review methodology we follow in this article. We also conduct all of our tests at 40°C-45°C ambient to simulate the environment seen inside a typical system more accurately, with 40°C-45°C being derived from a standard ambient assumption of 23°C and 17°C-22°C being added for the typical temperature rise within a system.
We use a GPIB-USB controller to control the Chroma 6530 source, which avoids its incredibly picky serial port. This controller was kindly provided by Prologix.
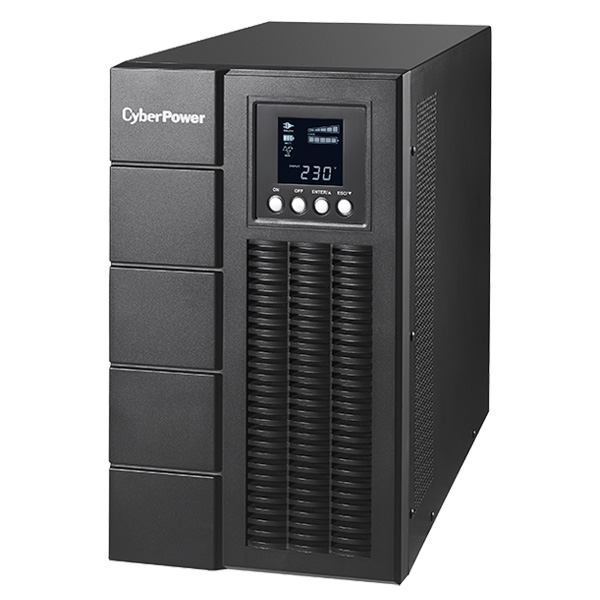
To protect our incredibly expensive Chroma AC source, we use an OLS3000E online UPS with a capacity of 3000VA/2700W.
OLS3000E kindly provided by: |
Primary Rails Load Regulation
The following charts show the voltage values of the main rails, recorded over a range from 60 W to the maximum specified load, and the deviation (in percent) for the same load range.


5VSB Regulation
The following chart shows how the 5VSB rail deals with the load we throw at it.

Hold-up Time
Hold-up time is a very important PSU characteristic and represents the amount of time, usually measured in milliseconds, a PSU can maintain output regulations as defined by the ATX spec without input power. In other words, it is the amount of time a system can continue to run without shutting down or rebooting during a power interruption. The ATX specification sets the minimum hold-up time to 16 ms with the maximum continuous output load. In the following screenshot, the blue line is the mains signal and the yellow line is the "Power Good" signal. The latter is de-asserted to a low state when any of the +12V, 5V, or 3.3V output voltages fall below the undervoltage threshold, or after the mains power has been removed for a sufficiently long time to guarantee that the PSU cannot operate anymore.

Hold-up time easily surpassed the 16 ms mark the ATX specification sets. Please note that although the unit uses the exact same bulk cap as the 550 G2 that failed this test, it somehow managed to produce a very long hold-up time. Given the 550 G2 has 100 W less capacity, it should register an even lower hold-up time than its small brother. The assumption is that significant improvements that somehow affect the hold-up time were made, or that the bulk cap of our 550 G2 sample wasn't at its best.
Inrush Current
Inrush current or switch-on surge refers to the maximum instantaneous input-current drawn by an electrical device when it is first turned on. The charging current of an APFC capacitor(s) has PSUs produce large inrush-current right as they are turned on. Large inrush current can cause the tripping of circuit breakers and fuses and may also damage switches, relays, and bridge rectifiers; as a result, the lower the inrush current of a PSU right as it is turned on, the better.
Compared to other PSUs of similar capacity, inrush current was high.
Load Regulation and Efficiency Measurements
The first set of tests revealed the stability of the voltage rails and the SuperNOVA 650 G2's efficiency. The applied load was equal to (approximately) 10%-110% of the maximum load the PSU can handle, in 10% steps.We conducted two additional tests. In the first test, we stressed the two minor rails (5V and 3.3V) with a high load while the load at +12V was only 0.10 A. This test reveals whether the PSU is Haswell ready or not. In the second test, we dialed the maximum load the +12V rail can handle while the load on the minor rails is minimal.
| Load Regulation & Efficiency Testing Data - EVGA SuperNOVA 650 G2 | ||||||||||
|---|---|---|---|---|---|---|---|---|---|---|
| Test | 12 V | 5 V | 3.3 V | 5VSB | Power (DC/AC) | Efficiency | Fan Speed | Fan Noise | Temp (In/Out) | PF/AC Volts |
| 10% Load | 3.522A | 1.985A | 1.991A | 0.980A | 64.73W | 84.77% | 0 RPM | 0 dBA | 46.44°C | 0.816 |
| 12.247V | 5.047V | 3.311V | 5.085V | 76.36W | 42.57°C | 230.3V | ||||
| 20% Load | 8.078A | 2.969A | 2.994A | 1.180A | 129.69W | 89.55% | 0 RPM | 0 dBA | 47.54°C | 0.914 |
| 12.237V | 5.038V | 3.304V | 5.072V | 144.82W | 42.93°C | 230.3V | ||||
| 30% Load | 12.988A | 3.476A | 3.515A | 1.379A | 194.86W | 91.04% | 0 RPM | 0 dBA | 48.49°C | 0.943 |
| 12.227V | 5.031V | 3.298V | 5.060V | 214.04W | 43.77°C | 230.3V | ||||
| 40% Load | 17.889A | 3.980A | 4.007A | 1.581A | 259.72W | 91.65% | 0 RPM | 0 dBA | 48.00°C | 0.962 |
| 12.217V | 5.024V | 3.292V | 5.047V | 283.38W | 43.24°C | 230.3V | ||||
| 50% Load | 22.472A | 4.978A | 5.020A | 1.786A | 324.70W | 91.73% | 615 RPM | 26.5 dBA | 43.52°C | 0.969 |
| 12.203V | 5.019V | 3.285V | 5.036V | 353.96W | 51.99°C | 230.3V | ||||
| 60% Load | 27.065A | 5.984A | 6.039A | 1.988A | 389.64W | 91.62% | 615 RPM | 26.5 dBA | 43.86°C | 0.974 |
| 12.188V | 5.012V | 3.278V | 5.023V | 425.28W | 52.51°C | 230.3V | ||||
| 70% Load | 31.659A | 6.997A | 7.059A | 2.195A | 454.61W | 91.31% | 615 RPM | 26.5 dBA | 44.66°C | 0.977 |
| 12.177V | 5.005V | 3.270V | 5.010V | 497.86W | 54.19°C | 230.3V | ||||
| 80% Load | 36.265A | 8.005A | 8.089A | 2.400A | 519.58W | 90.88% | 940 RPM | 35.6 dBA | 45.46°C | 0.979 |
| 12.166V | 4.996V | 3.264V | 4.995V | 571.70W | 55.32°C | 230.3V | ||||
| 90% Load | 41.305A | 8.517A | 8.628A | 2.400A | 584.54W | 90.46% | 940 RPM | 35.6 dBA | 46.17°C | 0.981 |
| 12.153V | 4.989V | 3.256V | 4.991V | 646.19W | 56.23°C | 230.3V | ||||
| 100% Load | 46.121A | 9.037A | 9.138A | 3.018A | 649.52W | 90.01% | 1315 RPM | 44.9 dBA | 46.30°C | 0.983 |
| 12.138V | 4.983V | 3.249V | 4.965V | 721.62W | 56.65°C | 230.3V | ||||
| 110% Load | 51.519A | 9.049A | 9.151A | 3.019A | 714.42W | 89.61% | 1315 RPM | 44.9 dBA | 47.20°C | 0.985 |
| 12.126V | 4.977V | 3.245V | 4.959V | 797.30W | 57.94°C | 230.3V | ||||
| Crossload 1 | 0.098A | 13.015A | 13.005A | 0.004A | 109.00W | 83.61% | 615 RPM | 26.5 dBA | 46.61°C | 0.900 |
| 12.243V | 5.009V | 3.275V | 5.097V | 130.37W | 54.82°C | 230.3V | ||||
| Crossload 2 | 54.116A | 1.003A | 1.003A | 1.001A | 670.11W | 90.62% | 1315 RPM | 44.9 dBA | 47.53°C | 0.984 |
| 12.136V | 5.004V | 3.274V | 5.048V | 739.46W | 58.73°C | 230.3V | ||||
The PSU's fan didn't spin at up to and including 40% load, and we had to push the unit really hard to make the fan rotate at its full speed, which our measurements show to barely exceed 1300 RPM. The 650 G2 didn't have any problems at all at very high operating temperatures and delivered its full load and more without a sweat. When it comes to efficiency, the PSU did pretty well, and you can check on how well it did in comparison to the competition in terms of efficiency on the next page.
Jul 12th, 2025 07:36 CDT
change timezone
Latest GPU Drivers
New Forum Posts
- Gigabyte graphic cards - TIM gel SLIPPAGE problem (147)
- Will you buy a RTX 5090? (647)
- 5070 Ti Variants, do they even matter? (20)
- 'NVIDIA App' not usable offline? (10)
- Chrome has removed uBlock Origin 1.64.0 (remove google search suggestions) (8)
- Gpu overheating after bios flash (2)
- What's your latest tech purchase? (24242)
- 3D Printer Club (540)
- Can you guess Which game it is? (230)
- Is RX 9070 VRAM temperature regular value or hotspot? (401)
Popular Reviews
- Fractal Design Epoch RGB TG Review
- Lexar NM1090 Pro 4 TB Review
- Corsair FRAME 5000D RS Review
- NVIDIA GeForce RTX 5050 8 GB Review
- NZXT N9 X870E Review
- Our Visit to the Hunter Super Computer
- Sapphire Radeon RX 9060 XT Pulse OC 16 GB Review - An Excellent Choice
- AMD Ryzen 7 9800X3D Review - The Best Gaming Processor
- Upcoming Hardware Launches 2025 (Updated May 2025)
- Chieftec Iceberg 360 Review
TPU on YouTube
Controversial News Posts
- Intel's Core Ultra 7 265K and 265KF CPUs Dip Below $250 (288)
- Some Intel Nova Lake CPUs Rumored to Challenge AMD's 3D V-Cache in Desktop Gaming (140)
- AMD Radeon RX 9070 XT Gains 9% Performance at 1440p with Latest Driver, Beats RTX 5070 Ti (131)
- NVIDIA Launches GeForce RTX 5050 for Desktops and Laptops, Starts at $249 (119)
- NVIDIA GeForce RTX 5080 SUPER Could Feature 24 GB Memory, Increased Power Limits (115)
- Microsoft Partners with AMD for Next-gen Xbox Hardware (105)
- Intel "Nova Lake‑S" Series: Seven SKUs, Up to 52 Cores and 150 W TDP (100)
- NVIDIA DLSS Transformer Cuts VRAM Usage by 20% (97)