 22
22
Futuremark PCMark 10 Review
Value & Conclusion »PCMark 10


First up are the individual test and group scores for each system. This helps with identifying the strengths and weaknesses for a specific hardware set. There are some very interesting results here, and a lot of it is logical. The Mini PC with a relatively weaker CPU and iGPU lags behind the other three systems, but its strongest point in the benchmark is in the Essentials group, with the Productivity group coming next. No professional would use this system for digital content creation, and these results speak for themselves. The other three systems are a combination of a new Intel quad-core CPU with a high OC but only the iGPU, an older Intel quad-core CPU with the most powerful discrete GPU in this article, and an AMD Ryzen eight core at lower clocks that has been combined with a discrete GPU that is not as powerful but still outperforms any iGPU. Other system components, including an SSD instead of an HDD, high-performing memory, and a stripped-down OS, will all help boost multiple individual test scores as well.

As expected thus, the ECS LIVA Mini PC fell behind a lot with the other three looking a lot closer to each other on this scale. The presence of a discrete GPU more than made up for the difference in CPU performance with Intel systems, especially in the Digital Content Creation group. A lot of individual tests were ultimately so CPU-centric that the eight cores with lower clocks more than made up for the GPU difference, which had the AMD Ryzen-based system being the overall winner. A swap of the two Intel quad-core CPUs might well have changed things around, but that does open up Pandora's box, so I will let you readers discuss that option freely instead.
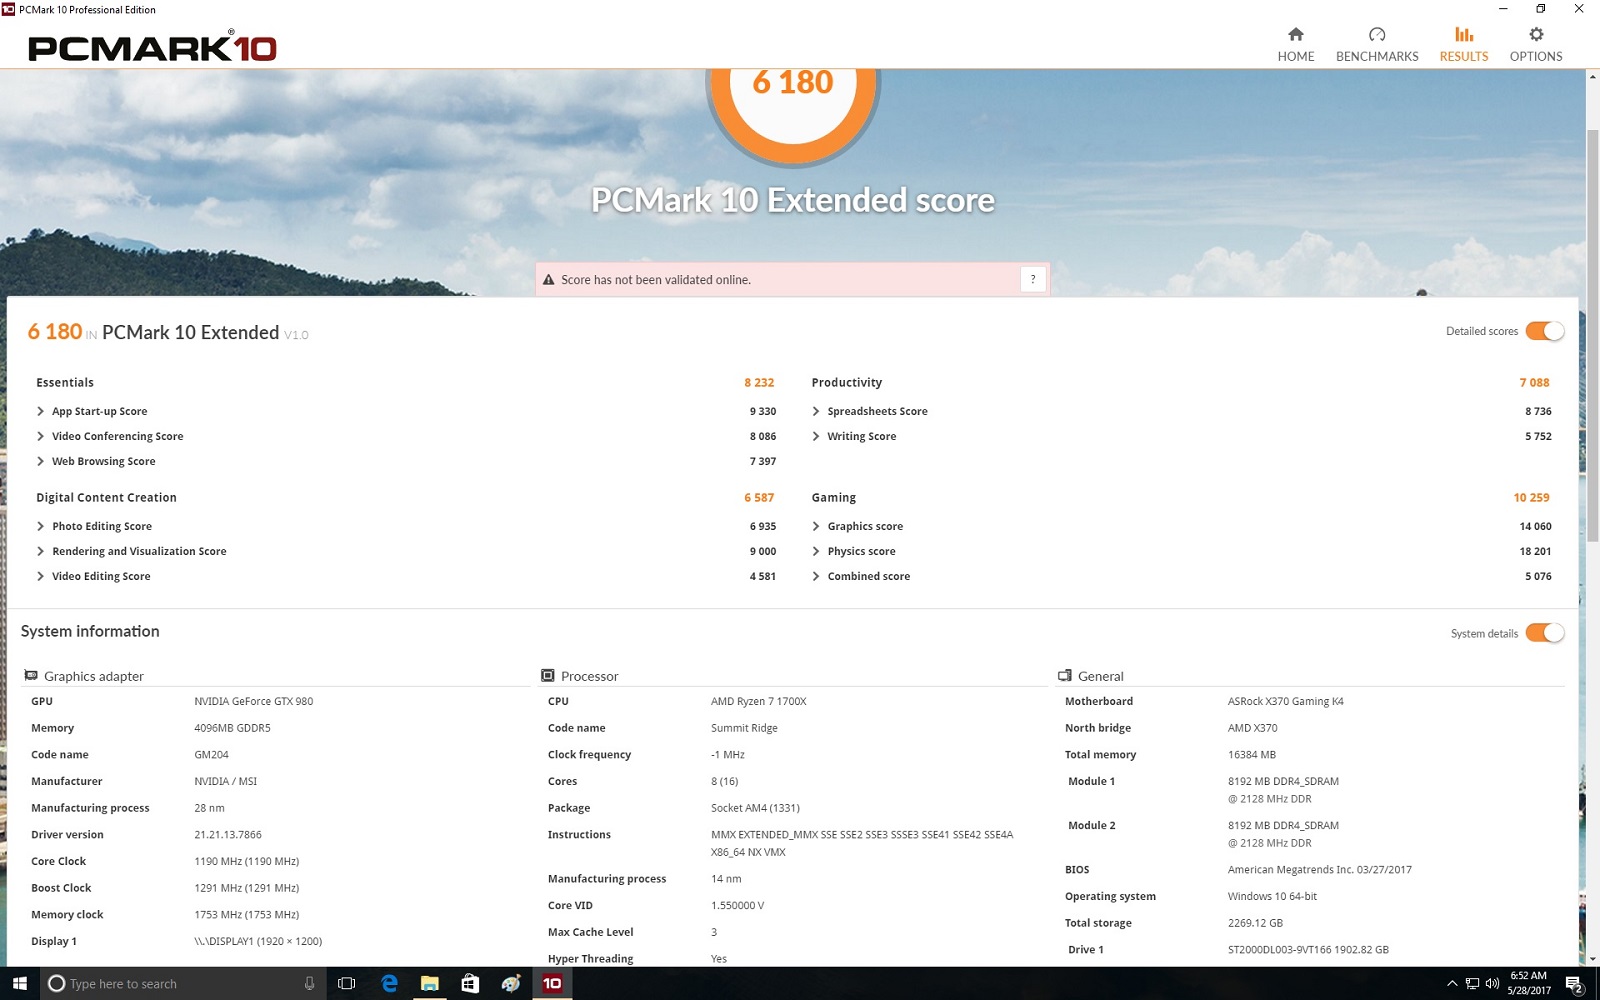
PCMark 10 Extended


With the Gaming group added and everything re-scaled to fit it in, the Mini PC just surprised us when it even managed to finish the benchmark without throttling down or showing artifacts. But we are clearly past the point of expectations here, and the other three systems show the importance of not just having a strong CPU or strong GPU but a good balance of the two. These results also show that a 4-year old quad-core Intel CPU is not really a bottleneck for GPU-centric tests, though it does play a role when it comes to the more CPU-centric tests, including the Fire Strike Physics test which alone may have tipped the favor back in System 4's favor.

Indeed, when we look at the overall benchmark scores that is exactly what happened. The score differential between system 3 (Core i7-4770K/GTX 980 Ti) and system 4 (Ryzen 7 1700X/GTX 980) is closer here owing to the stronger discrete GPU in the former, and yet system 4 ends up being a more balanced system with all tasks considered, thus making it the overall winner yet again. This goes to show how much AMD has improved in CPU performance, and the relative performance vs. Intel's quad-core offerings has also improved, which is what we saw in the various AMD Ryzen CPU reviews covered on TechPowerUp.
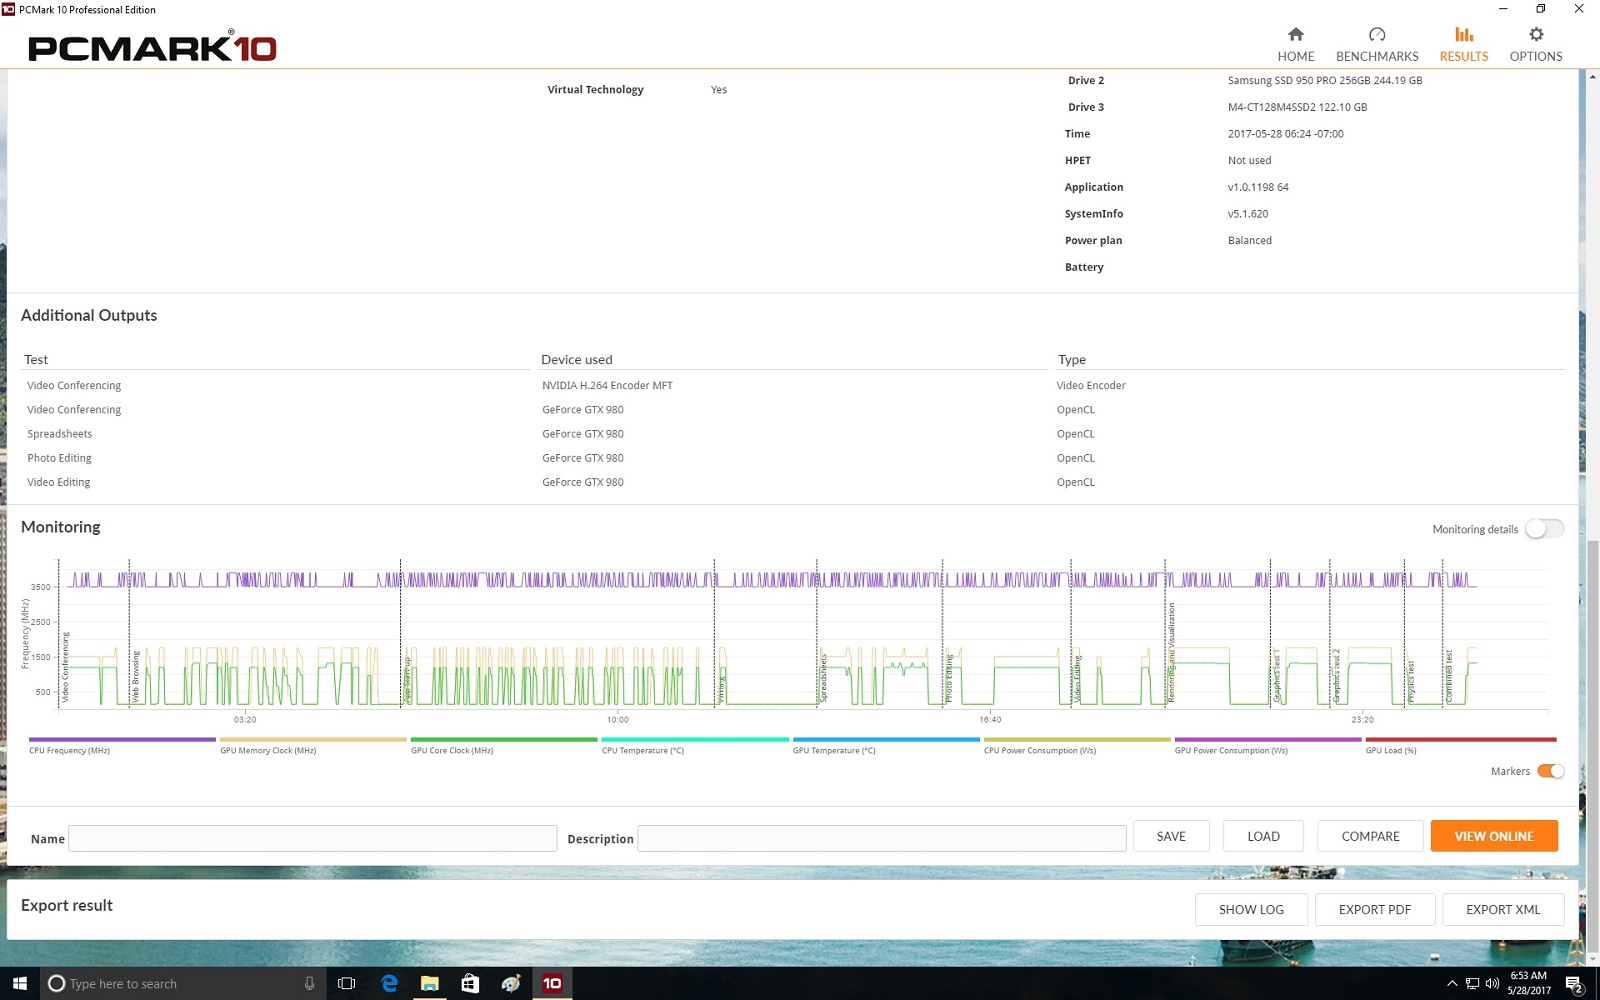
PCMark 10 Advanced and Professional also offer detailed result analysis and exporting. Here, you can take a look at how the CPU and GPU performed during each test, and catch any throttling that lowers performance. You can also compare different results to see where, say, one system with the exact same hardware set outperformed another. While all three editions support online storage and viewing, the latter two allow you to export the data set as a PDF. Be aware that the default option does not save the detailed scores for each test and only gives you a record of the test groups and the overall benchmark score. While this can be configured manually, and there are command line options available as well, I would like to see Futuremark implement the default export to include the detailed scores as well.
Jul 12th, 2025 07:35 CDT
change timezone
Latest GPU Drivers
New Forum Posts
- Gigabyte graphic cards - TIM gel SLIPPAGE problem (147)
- Will you buy a RTX 5090? (647)
- 5070 Ti Variants, do they even matter? (20)
- 'NVIDIA App' not usable offline? (10)
- Chrome has removed uBlock Origin 1.64.0 (remove google search suggestions) (8)
- Gpu overheating after bios flash (2)
- What's your latest tech purchase? (24242)
- 3D Printer Club (540)
- Can you guess Which game it is? (230)
- Is RX 9070 VRAM temperature regular value or hotspot? (401)
Popular Reviews
- Fractal Design Epoch RGB TG Review
- Lexar NM1090 Pro 4 TB Review
- Corsair FRAME 5000D RS Review
- NVIDIA GeForce RTX 5050 8 GB Review
- NZXT N9 X870E Review
- Our Visit to the Hunter Super Computer
- Sapphire Radeon RX 9060 XT Pulse OC 16 GB Review - An Excellent Choice
- AMD Ryzen 7 9800X3D Review - The Best Gaming Processor
- Upcoming Hardware Launches 2025 (Updated May 2025)
- Chieftec Iceberg 360 Review
TPU on YouTube
Controversial News Posts
- Intel's Core Ultra 7 265K and 265KF CPUs Dip Below $250 (288)
- Some Intel Nova Lake CPUs Rumored to Challenge AMD's 3D V-Cache in Desktop Gaming (140)
- AMD Radeon RX 9070 XT Gains 9% Performance at 1440p with Latest Driver, Beats RTX 5070 Ti (131)
- NVIDIA Launches GeForce RTX 5050 for Desktops and Laptops, Starts at $249 (119)
- NVIDIA GeForce RTX 5080 SUPER Could Feature 24 GB Memory, Increased Power Limits (115)
- Microsoft Partners with AMD for Next-gen Xbox Hardware (105)
- Intel "Nova Lake‑S" Series: Seven SKUs, Up to 52 Cores and 150 W TDP (100)
- NVIDIA DLSS Transformer Cuts VRAM Usage by 20% (97)