 4
4
Glorious Model O 2 Wireless Review
Software, Lighting & Battery Life »Sensor and Performance
The Glorious Model O 2 Wireless is equipped with the BAMF 2.0, which essentially is a PixArt PAW3395. According to specifications, the 3395 is capable of up to 26,000 CPI, as well as a maximum tracking speed of 650 IPS, which equals 16.51 m/s. Out of the box, four pre-defined CPI steps are available: 400, 800, 1600, and 3200.All testing was done on the latest firmware (252). As such, results obtained on earlier firmware versions may differ from those presented hereafter.
CPI Accuracy
"CPI" (short for counts per inch) describes the number of counts registered by the mouse if it is moved exactly an inch. There are several factors (firmware, mounting height of the sensor not meeting specifications, mouse feet thickness, mousing surface, among others) which may contribute to nominal CPI not matching actual CPI. It is impossible to always achieve a perfect match, but ideally, nominal and actual CPI should differ as little as possible. In this test, I'm determining whether this is the case or not. However, please keep in mind that said variance will still differ from unit to unit, so your mileage may vary.
I've restricted my testing to the four most common CPI steps, which are 400, 800, 1600, and 3200. As you can see, deviation is consistently positive, inconsistent, and large, which is a poor result overall. In order to account for the measured deviation, adjusted steps of 350, 800, 1500, and 2900 CPI have been used for testing.
Motion Delay
"Motion delay" encompasses all kinds of sensor lag. Any further sources of input delay will not be recorded in this test. The main thing I'll be looking for in this test is sensor smoothing, which describes an averaging of motion data across several capture frames, in order to reduce jitter at higher CPI values, increasing motion delay along with it. The goal here is to have as little smoothing as possible. As there is no way to accurately measure motion delay absolutely without special equipment, it is done by comparison with a control subject that has been determined to have consistent and low motion delay. In this case, the control subject is a Logitech G403, whose PMW3366 sensor has no visible smoothing across the entire CPI range. Note that the G403 is moved first and thus receives a slight head start.Testing is restricted to 2.4 GHz mode as Bluetooth is not suitable for non-casual gaming applications.
Wired testing
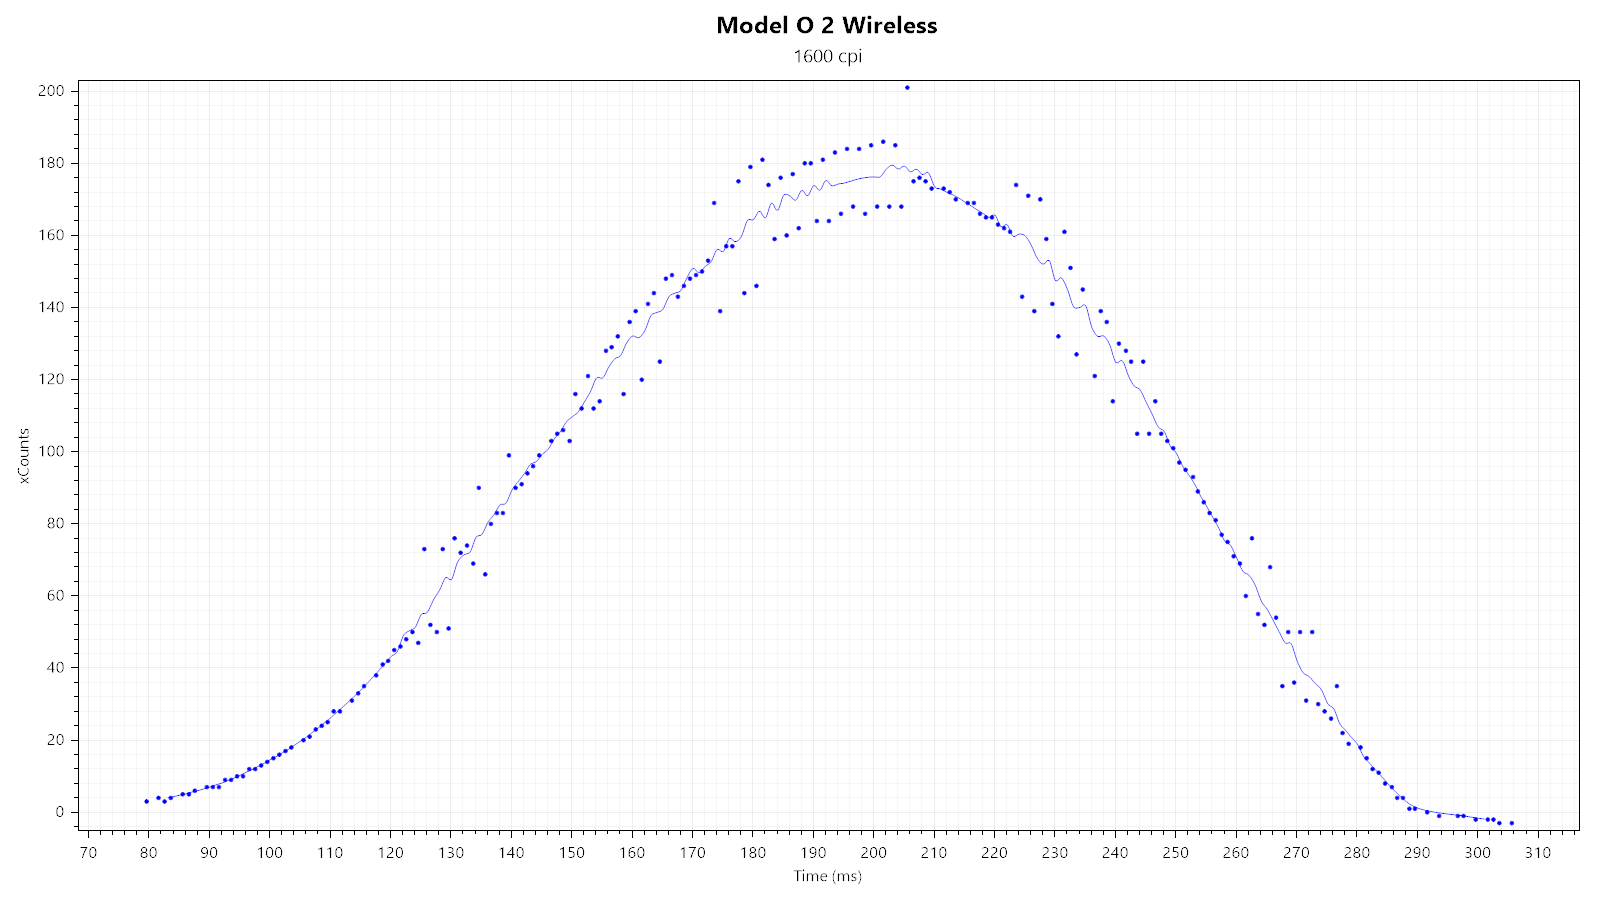
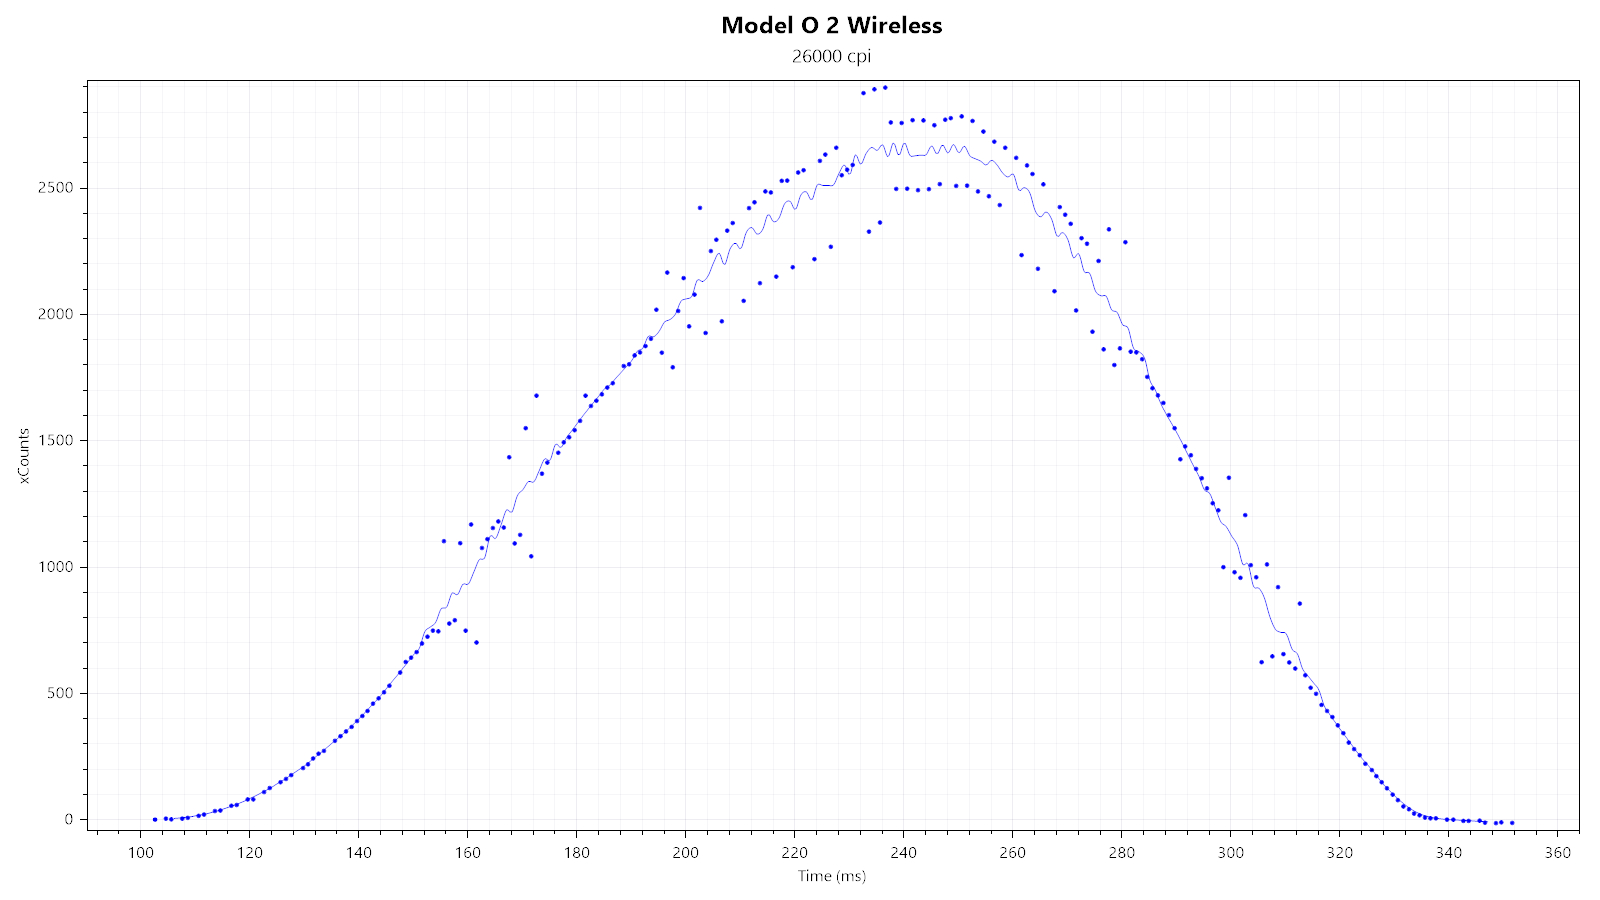
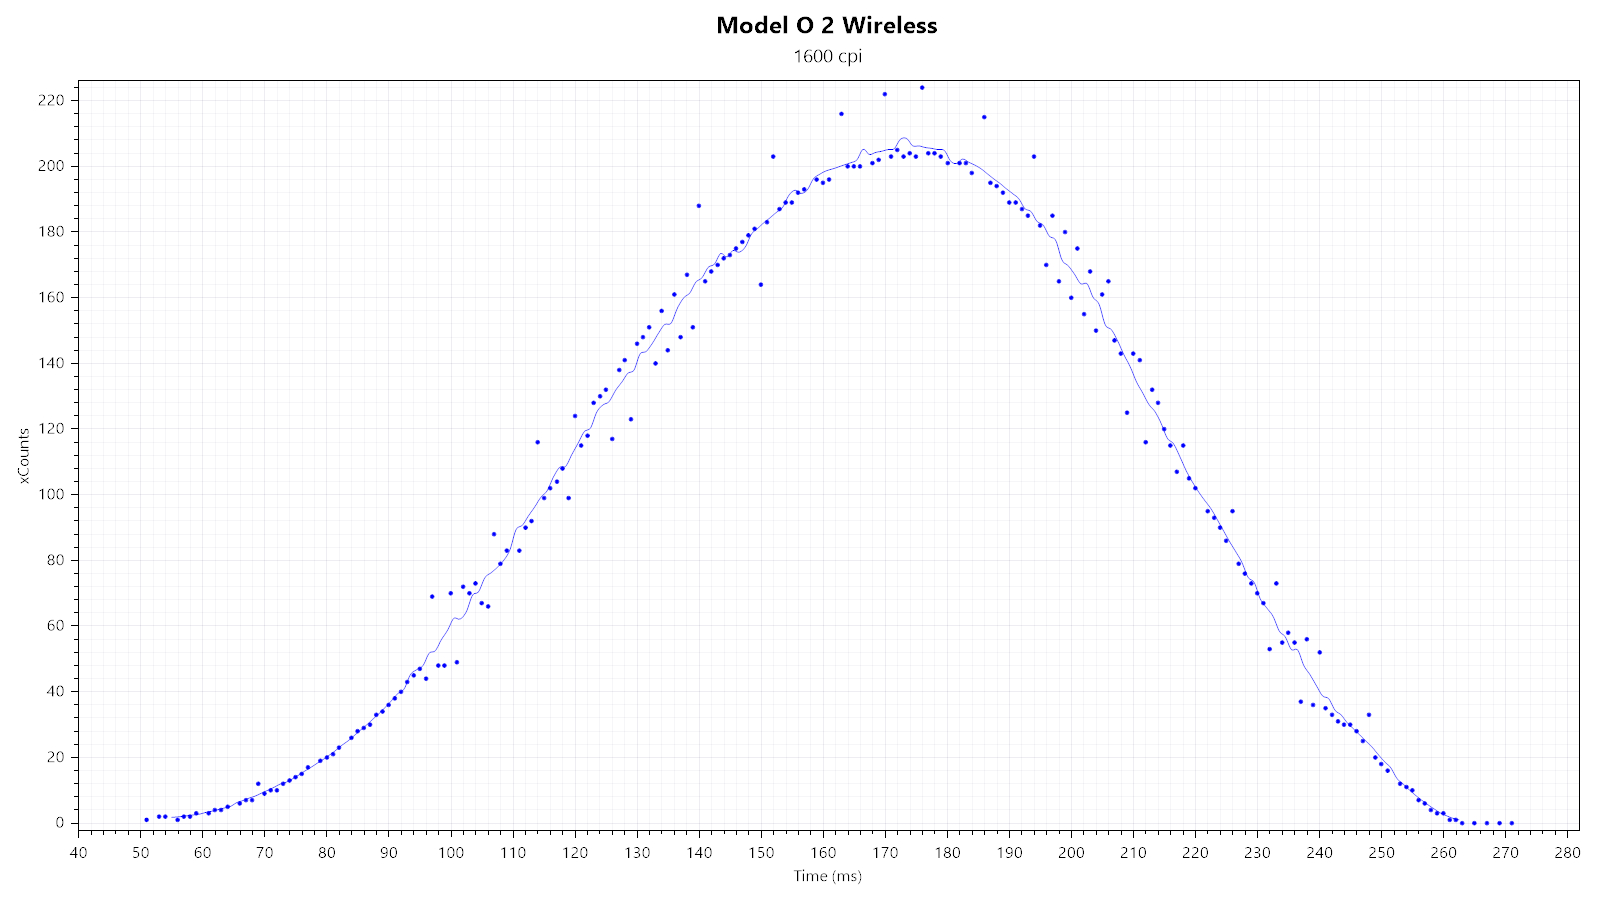
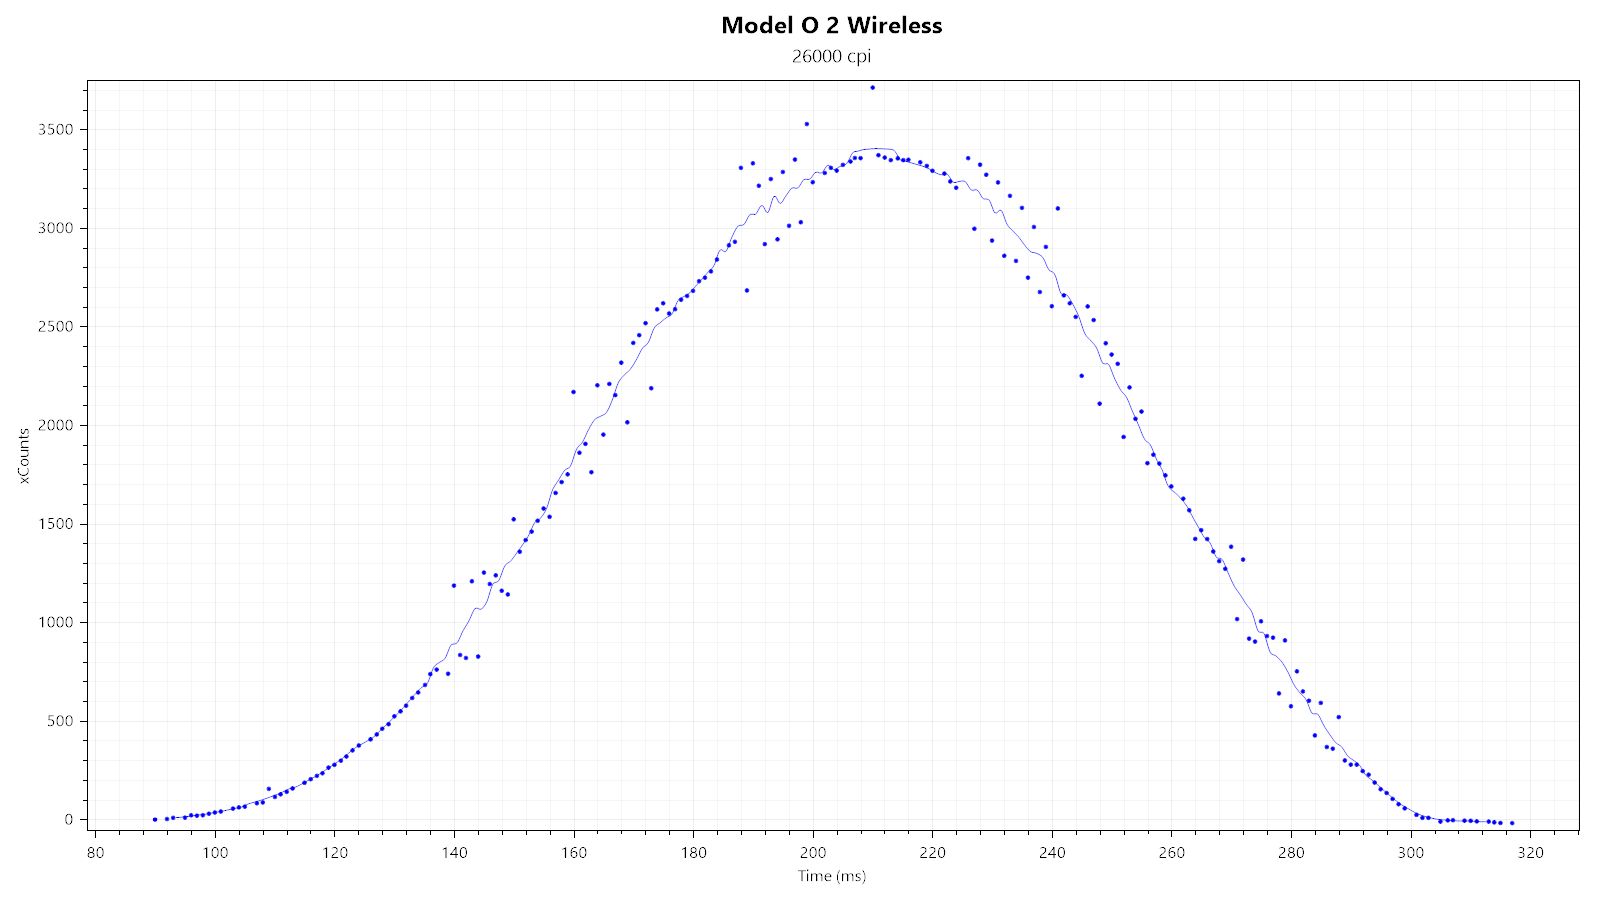
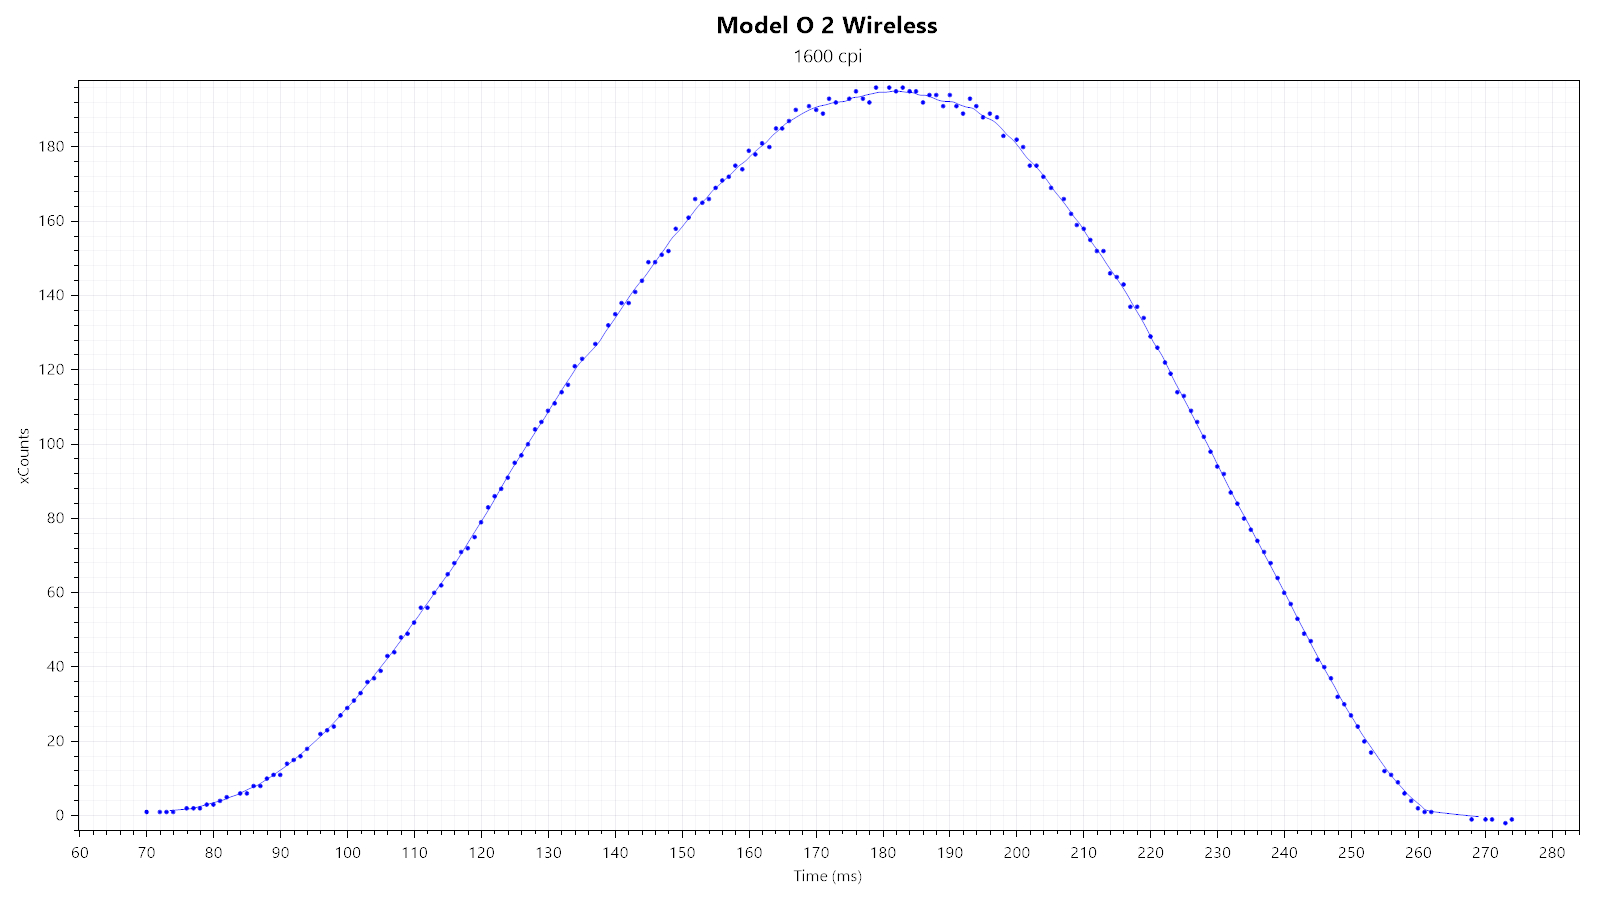
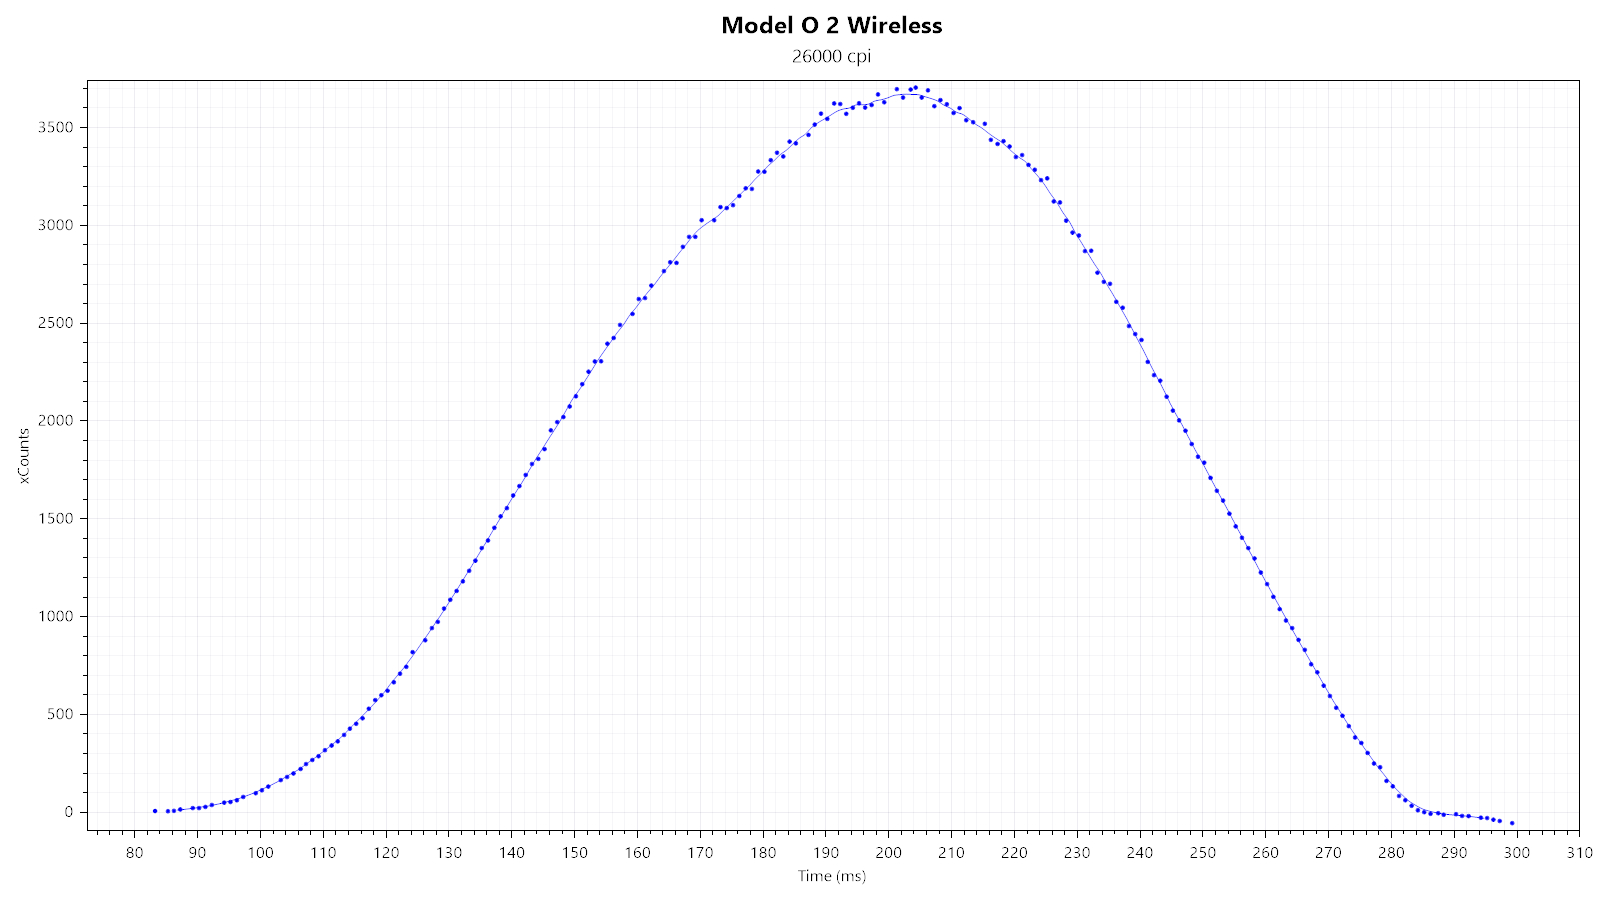
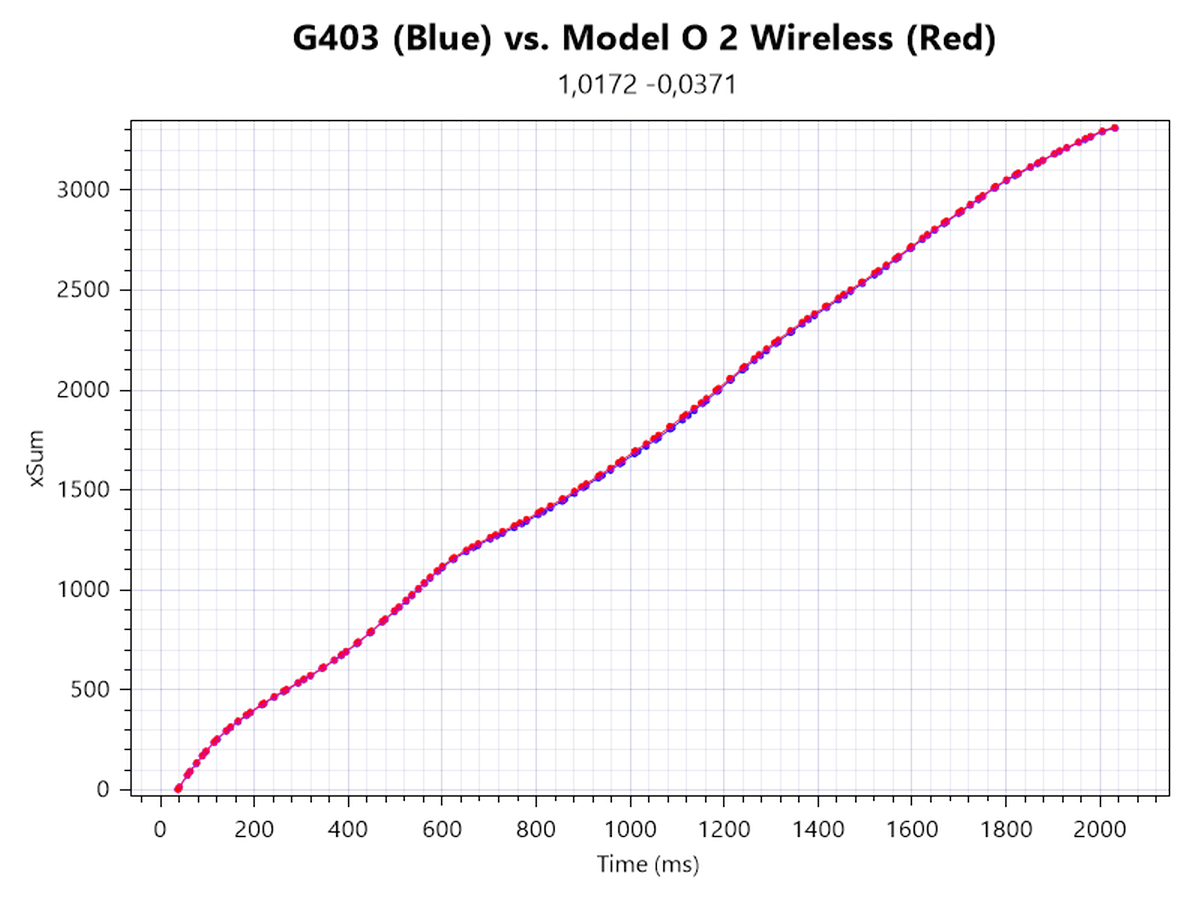
First, I'm looking at two xCounts plots—generated at 1600 and 26,000 CPI—to quickly gauge whether there is any smoothing, which would be indicated by any visible "kinks." As you can see, neither plot shows any, which strongly suggests there not being any smoothing.
Furthermore, the Model O 2 Wireless allows enabling MotionSync, which reduces SPI timing jitter.
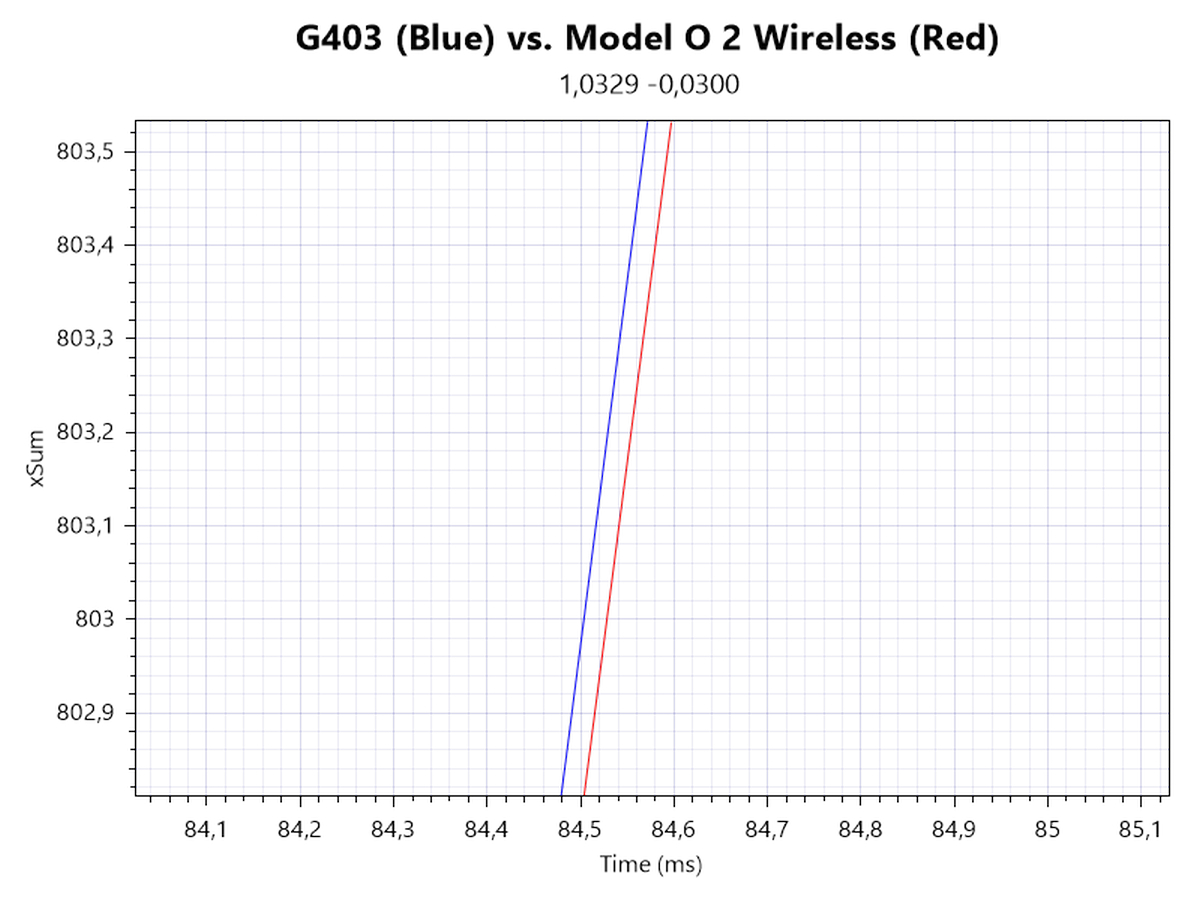
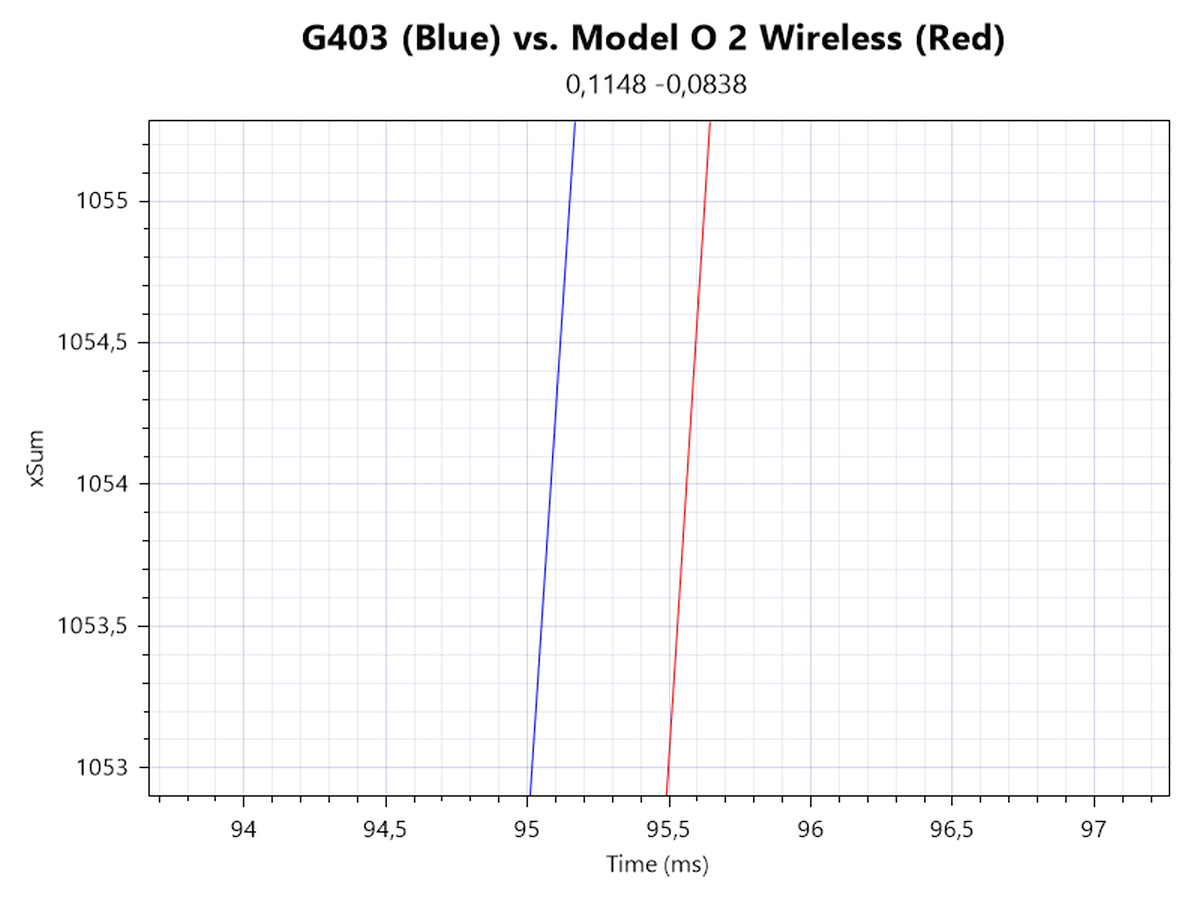
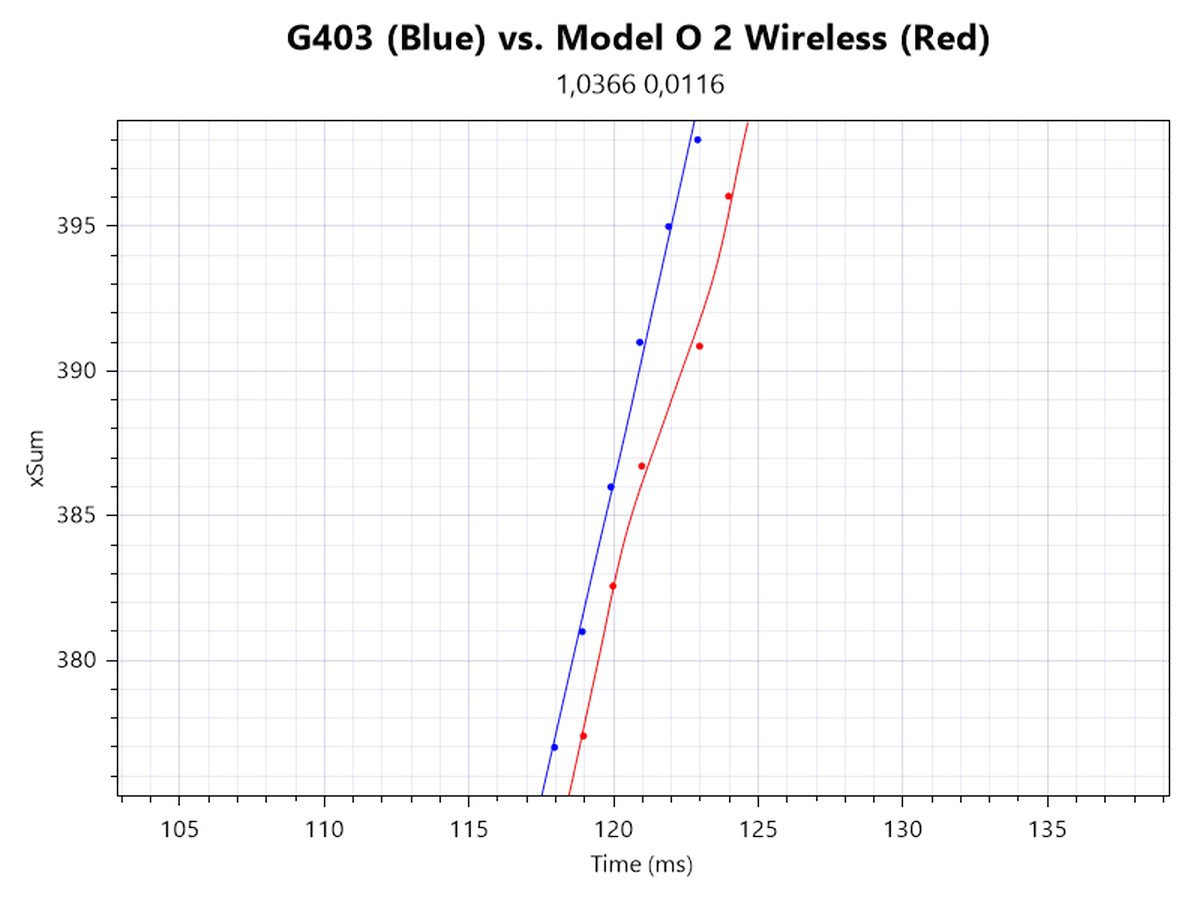
In order to determine motion delay, I'm looking at xSum plots generated at 1600 and 26,000 CPI. The line further to the left denotes the sensor with less motion delay. There is no motion delay differential at either step, which further confirms there not being smoothing across the entire CPI range.

Upon enabling MotionSync, motion delay is increased by a bit more than 0.5 ms.
Wireless testing
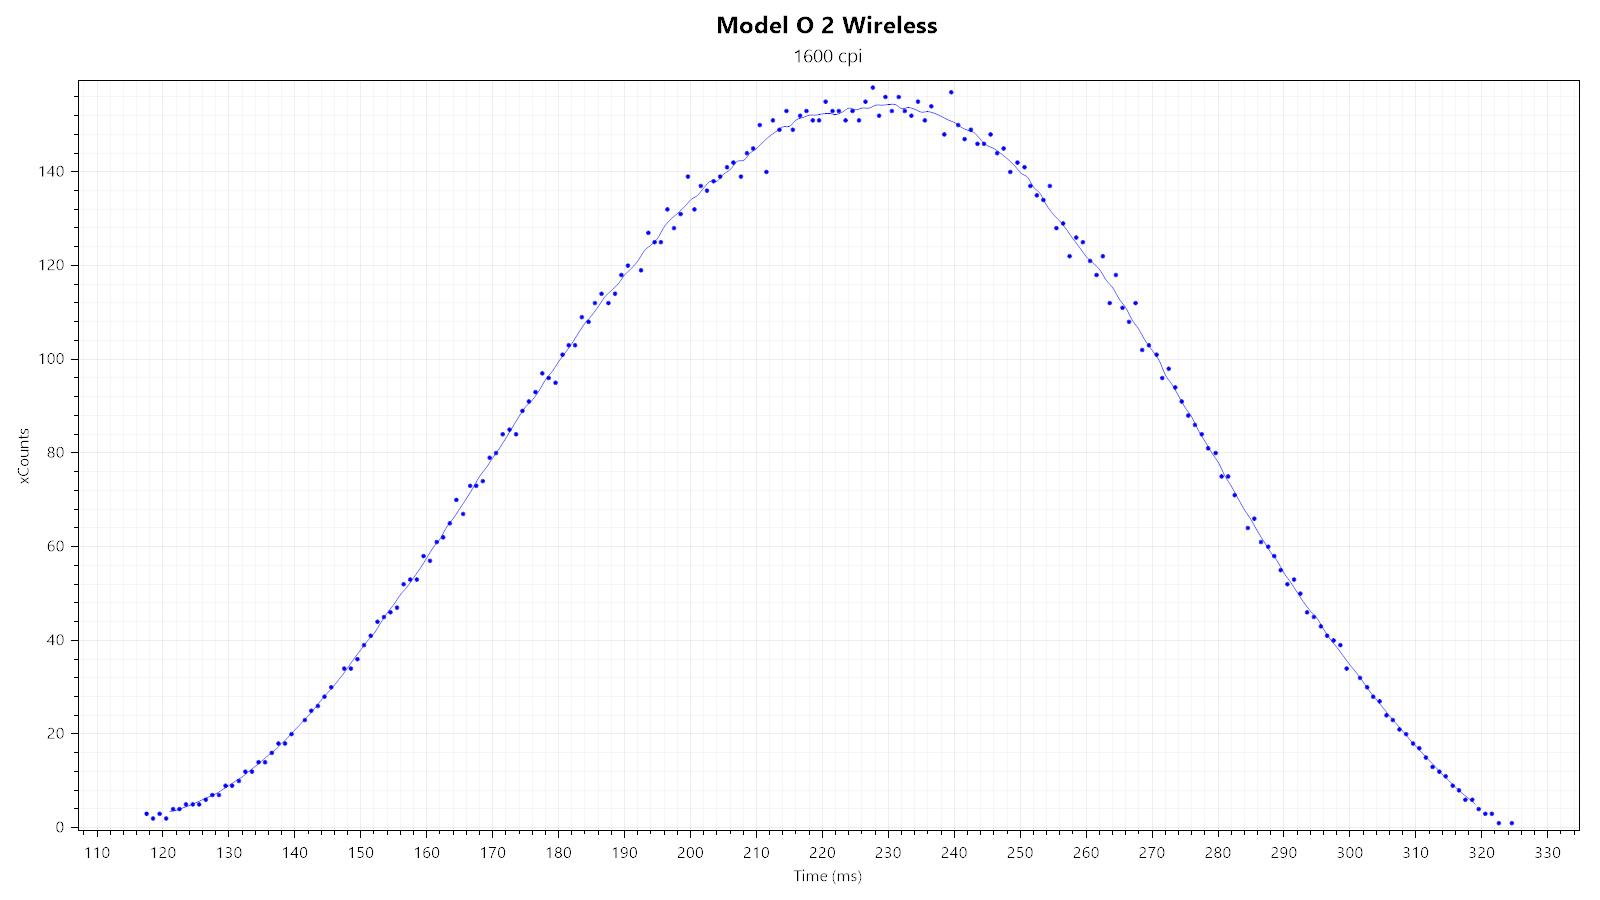
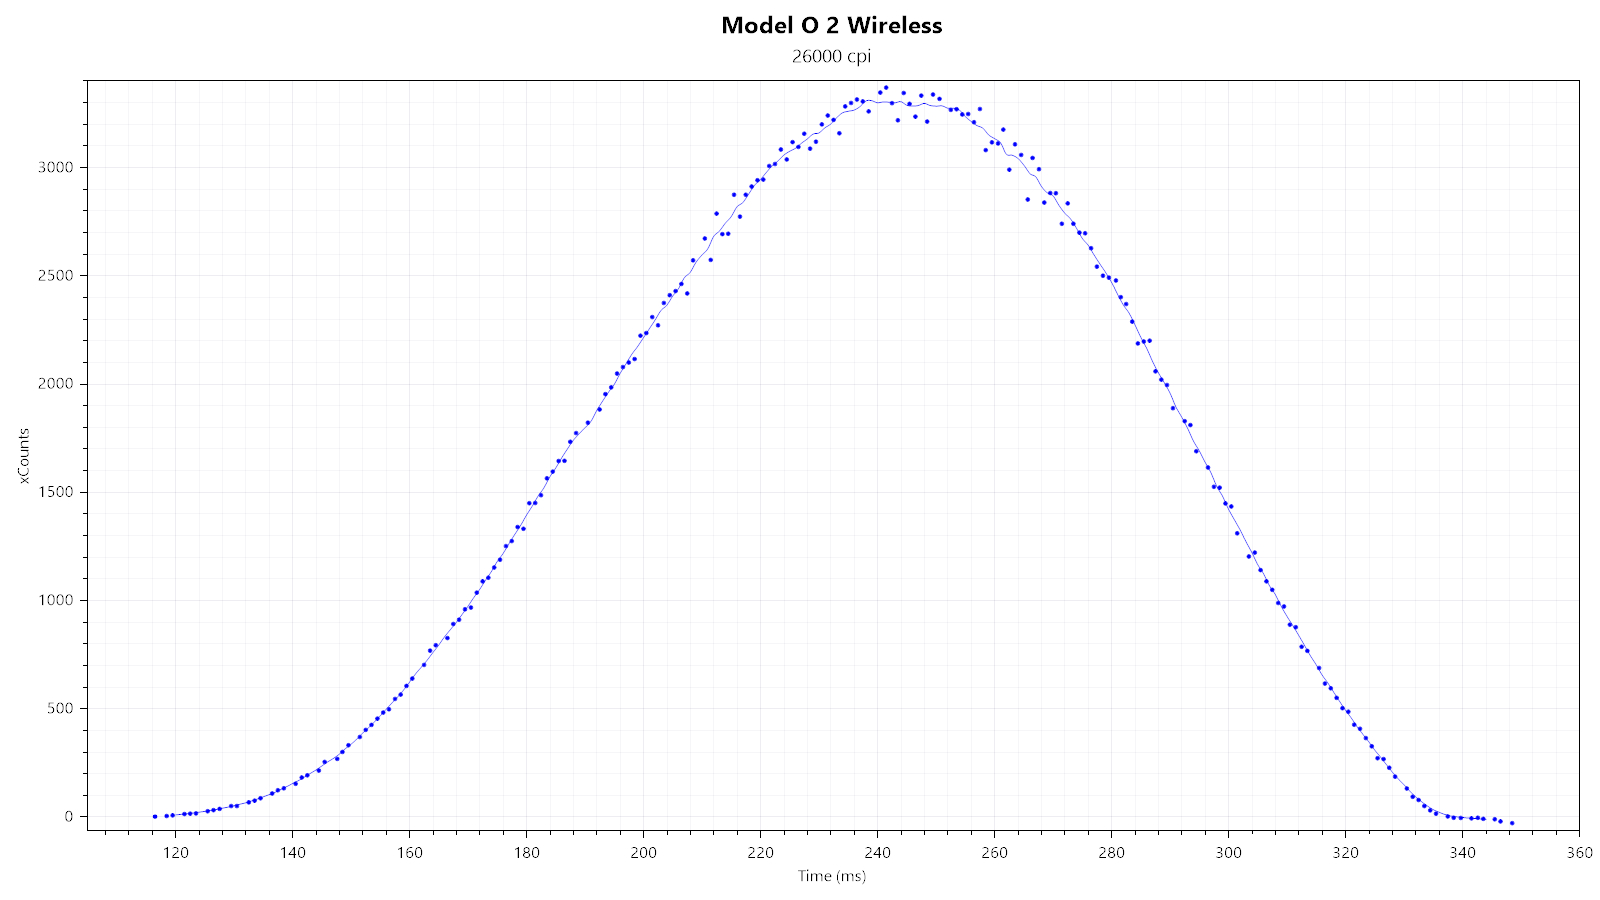
Not much changes when running the Model O 2 Wireless in wireless mode, as SPI timing jitter and general tracking are virtually on the same level as when wired.
Yet again, enabling MotionSync reduces SPI timing jitter.
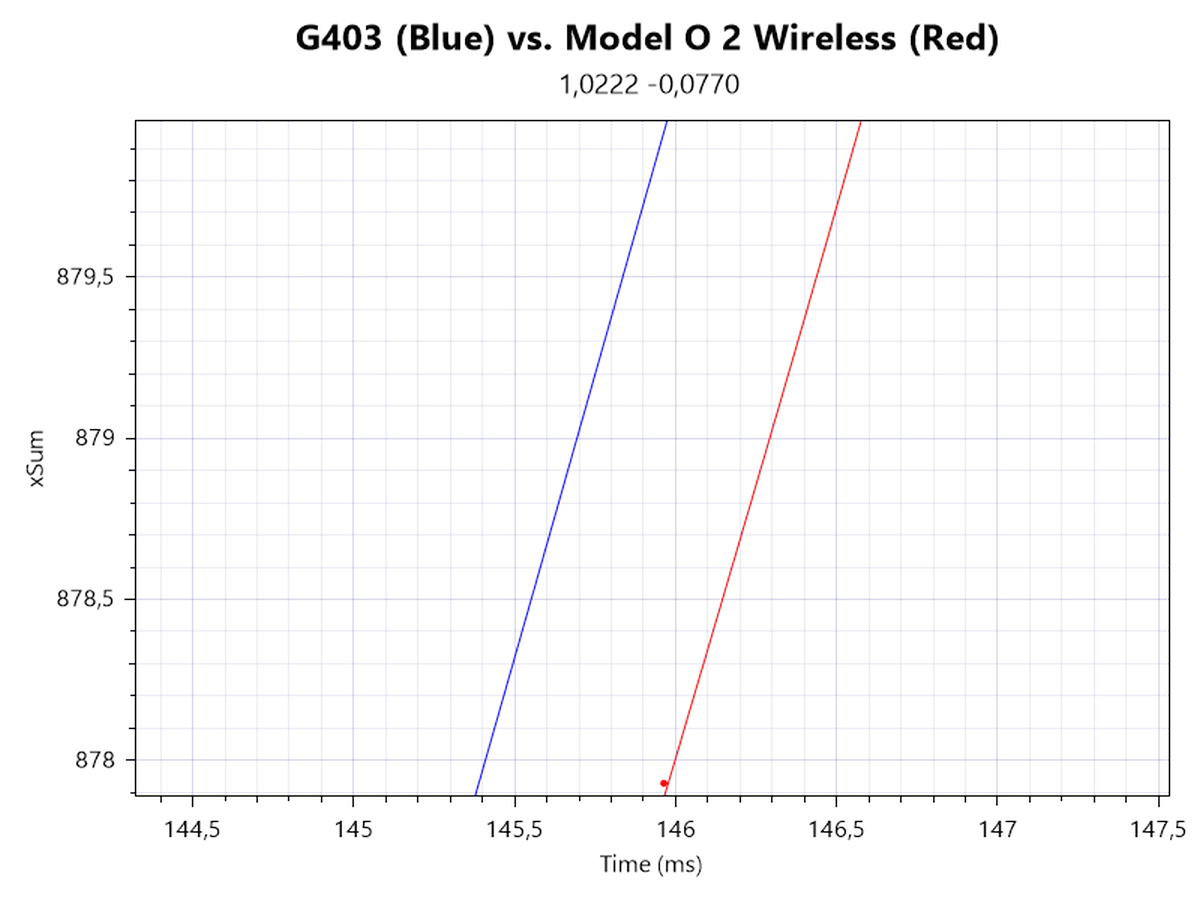
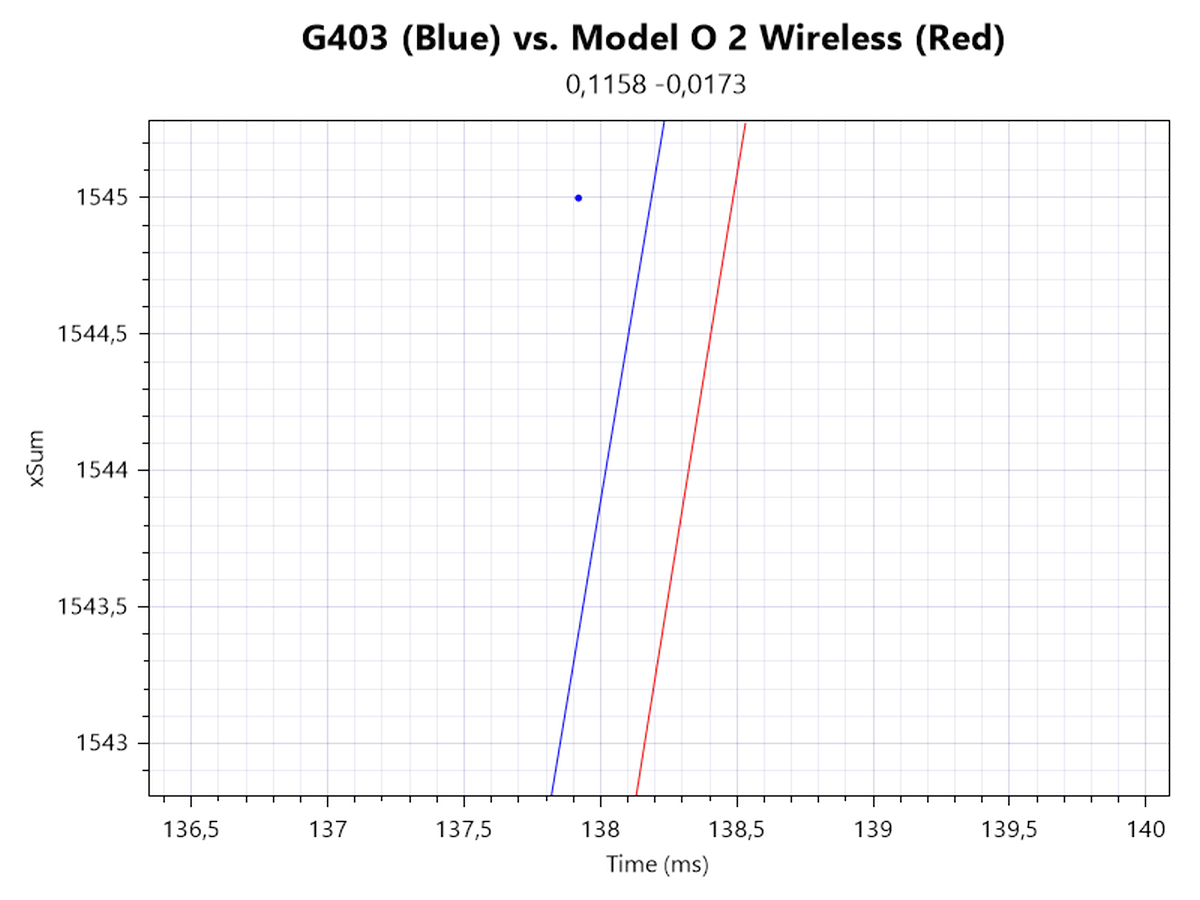
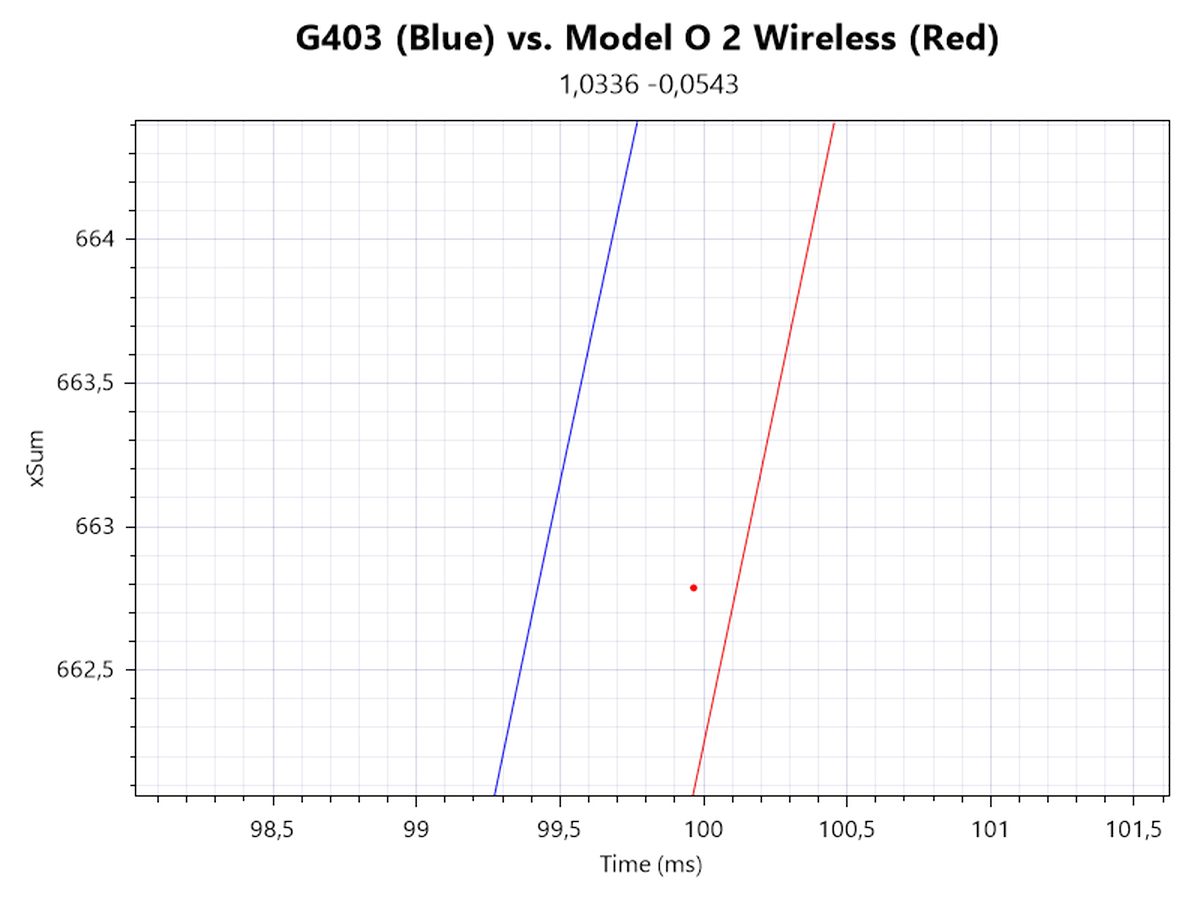
Once again, 1600 and 26,000 CPI are tested. At both 1600 and 26,000 CPI, I can measure a wireless motion delay differential of around 0.5 ms.
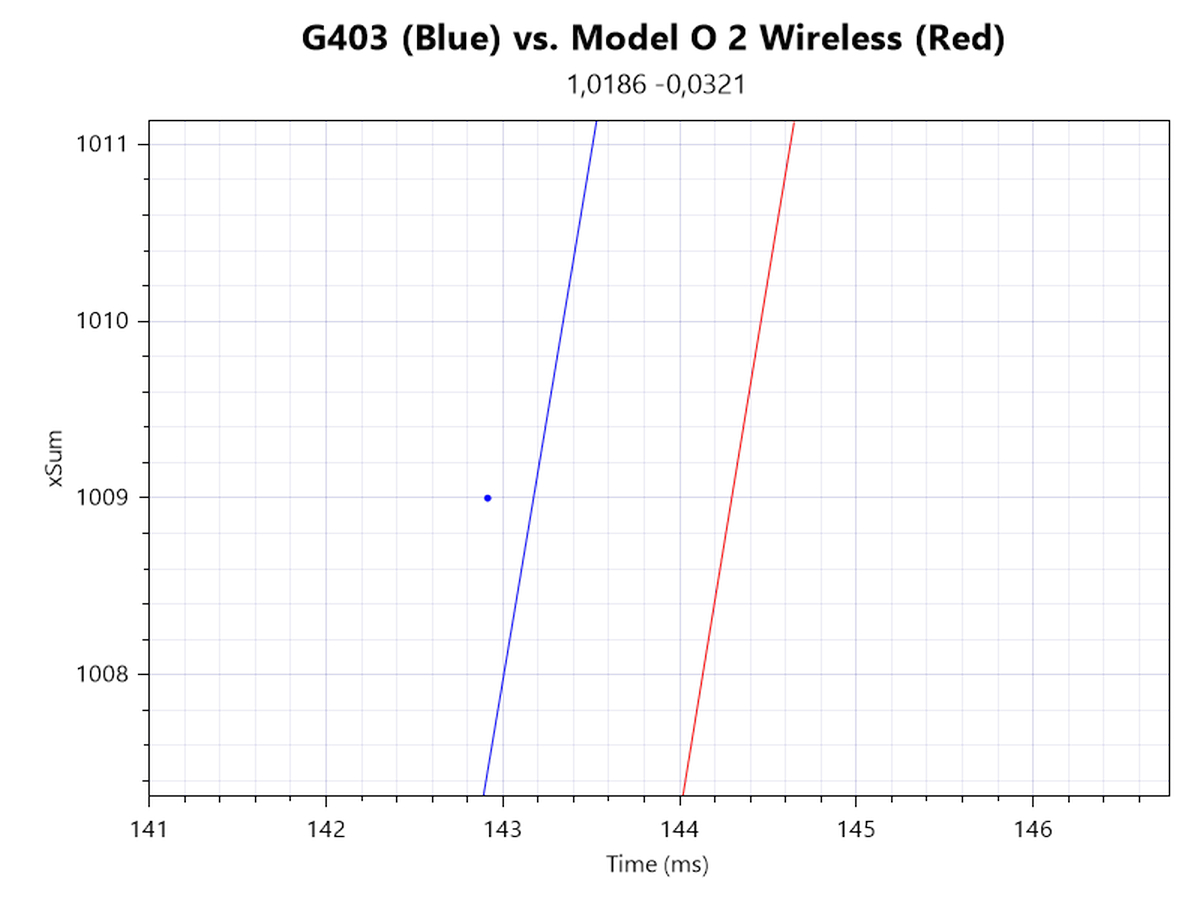
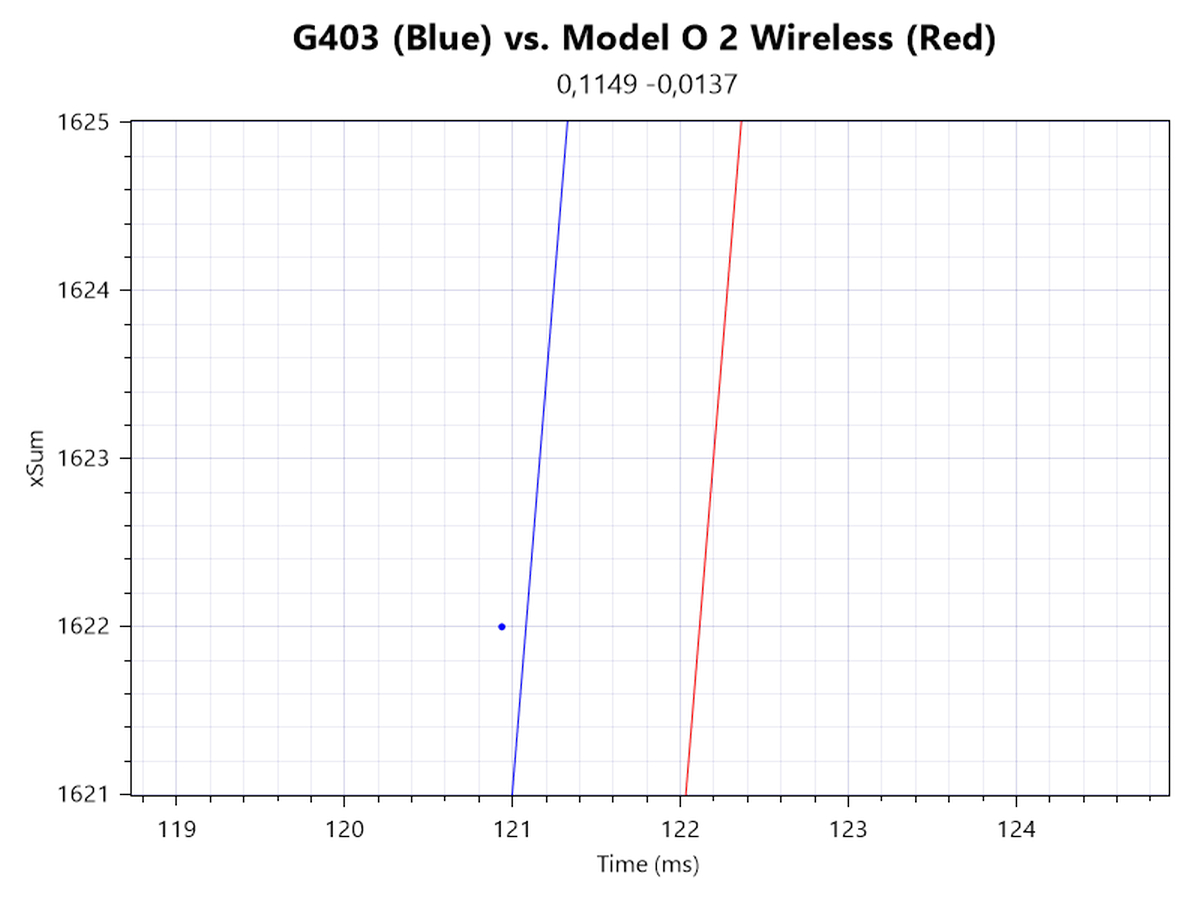
Enabling MotionSync increases the motion delay differential to roughly 1 ms.
Somewhat curiously, at times the first count is registered very late when moving from a standstill, new counts are suspended for a short time, only to resume by being reported in a single update. Hence, the average position is unaffected, but responsiveness suffers.
Much like on several releases from Razer (DeathAdder V2 Pro, V3 Pro, Viper V2 Pro, Naga V2 Pro, among others) as well as those of other manufacturers (VAXEE XE/NP-01S Wireless, Darmoshark M3/M3 4K/M3S Varun, among others), a rather curious behavior is present on the Model O 2 Wireless as well. At any point during the motion, though typically towards the start, motion delay is increased by at least a single interval, which is maintained through the motion. This appears to only happen in wireless (2.4 GHz) operation. I'm unable to reproduce this behavior consistently.
Speed-related Accuracy Variance (SRAV)
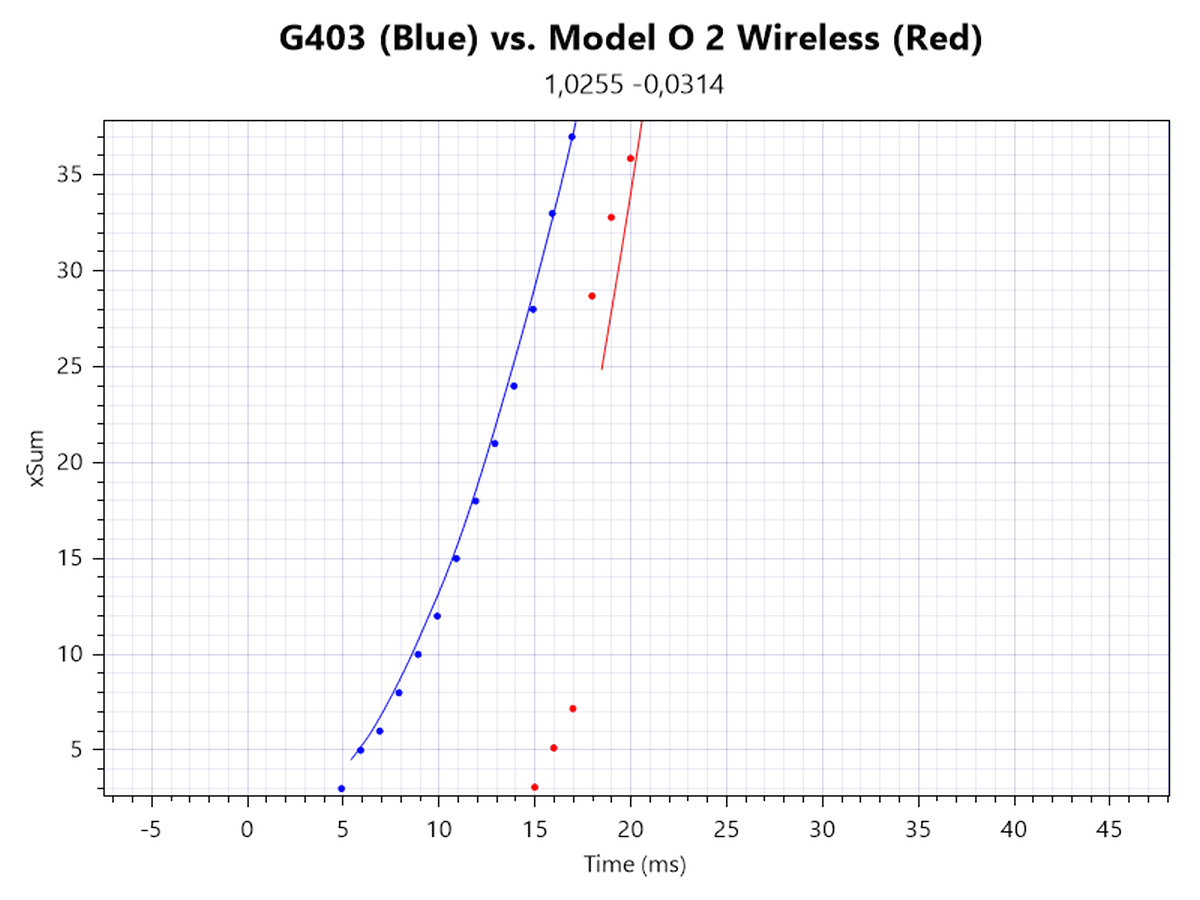
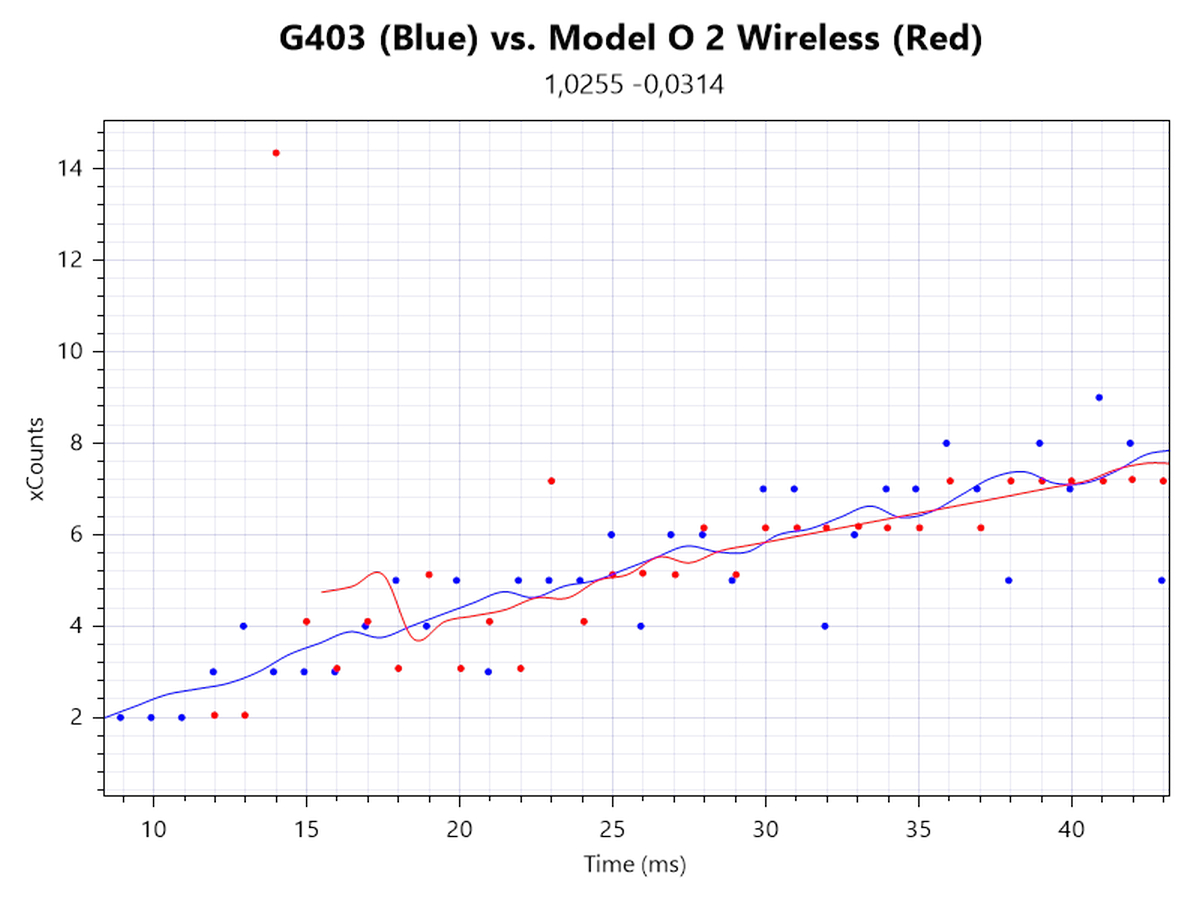
What people typically mean when they talk about "acceleration" is speed-related accuracy variance (or SRAV). It's not about the mouse having a set amount of inherent positive or negative acceleration, but about the cursor not traveling the same distance if the mouse is moved the same physical distance at different speeds. The easiest way to test this is by comparison with a control subject that is known to have very low SRAV, which in this case is the G403. As you can see from the plot, no displacement between the two cursor paths can be observed, which confirms that SRAV is very low.
Perfect Control Speed
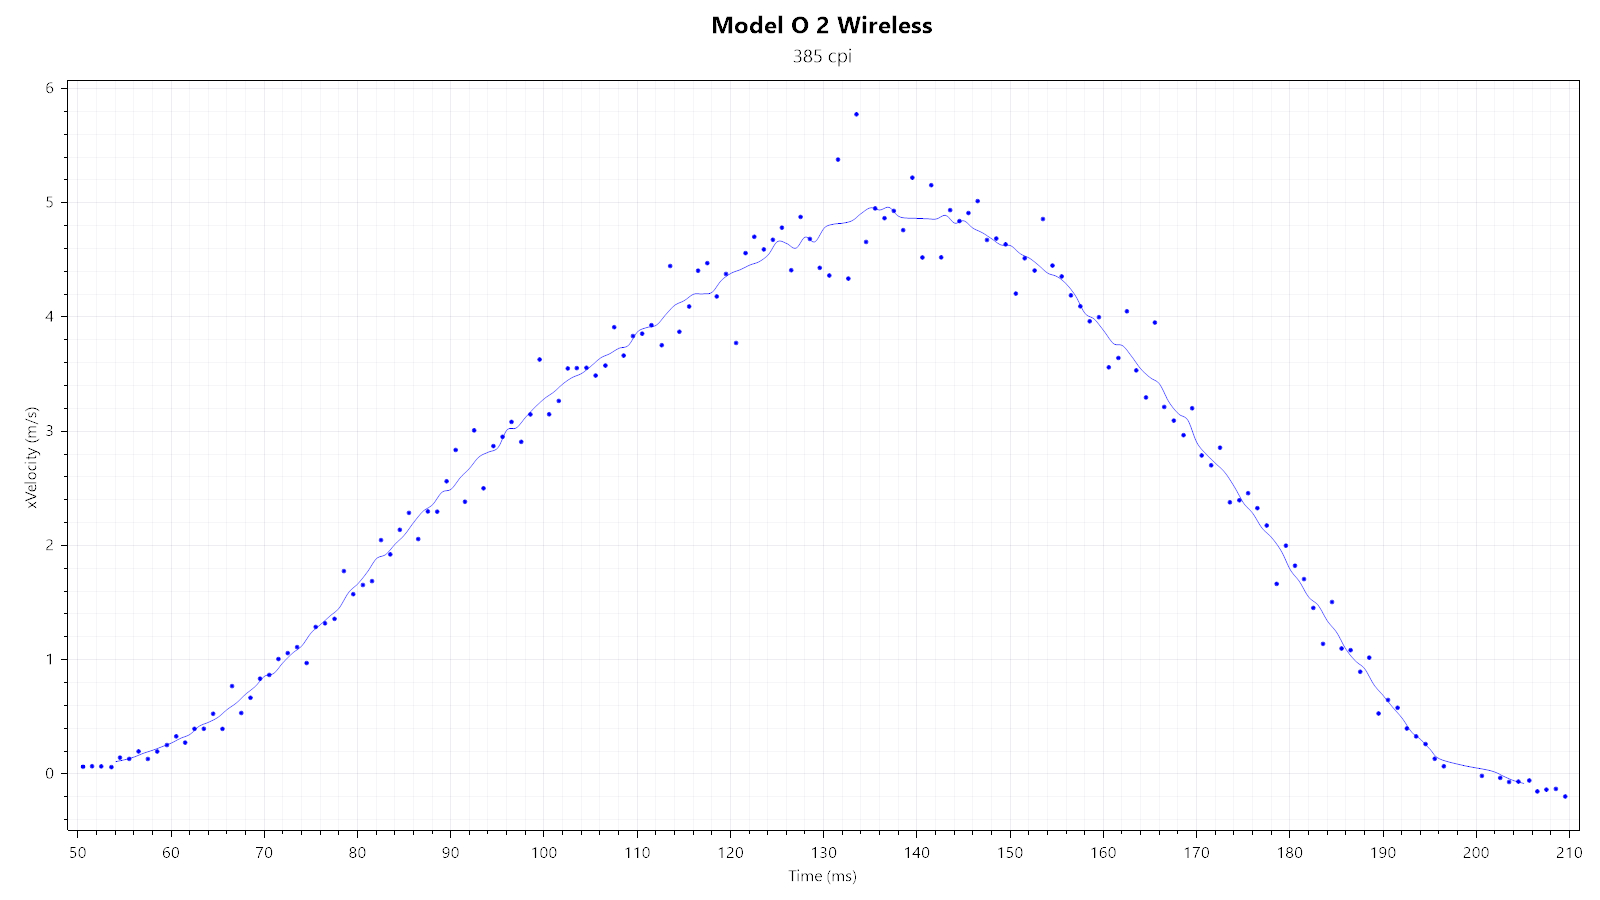
Perfect Control Speed (or PCS for short) is the maximum speed up to which the mouse and its sensor can be moved without the sensor malfunctioning in any way. I've only managed to hit a measly 5 m/s, which is within the proclaimed PCS range and causes no observable sensor malfunction.
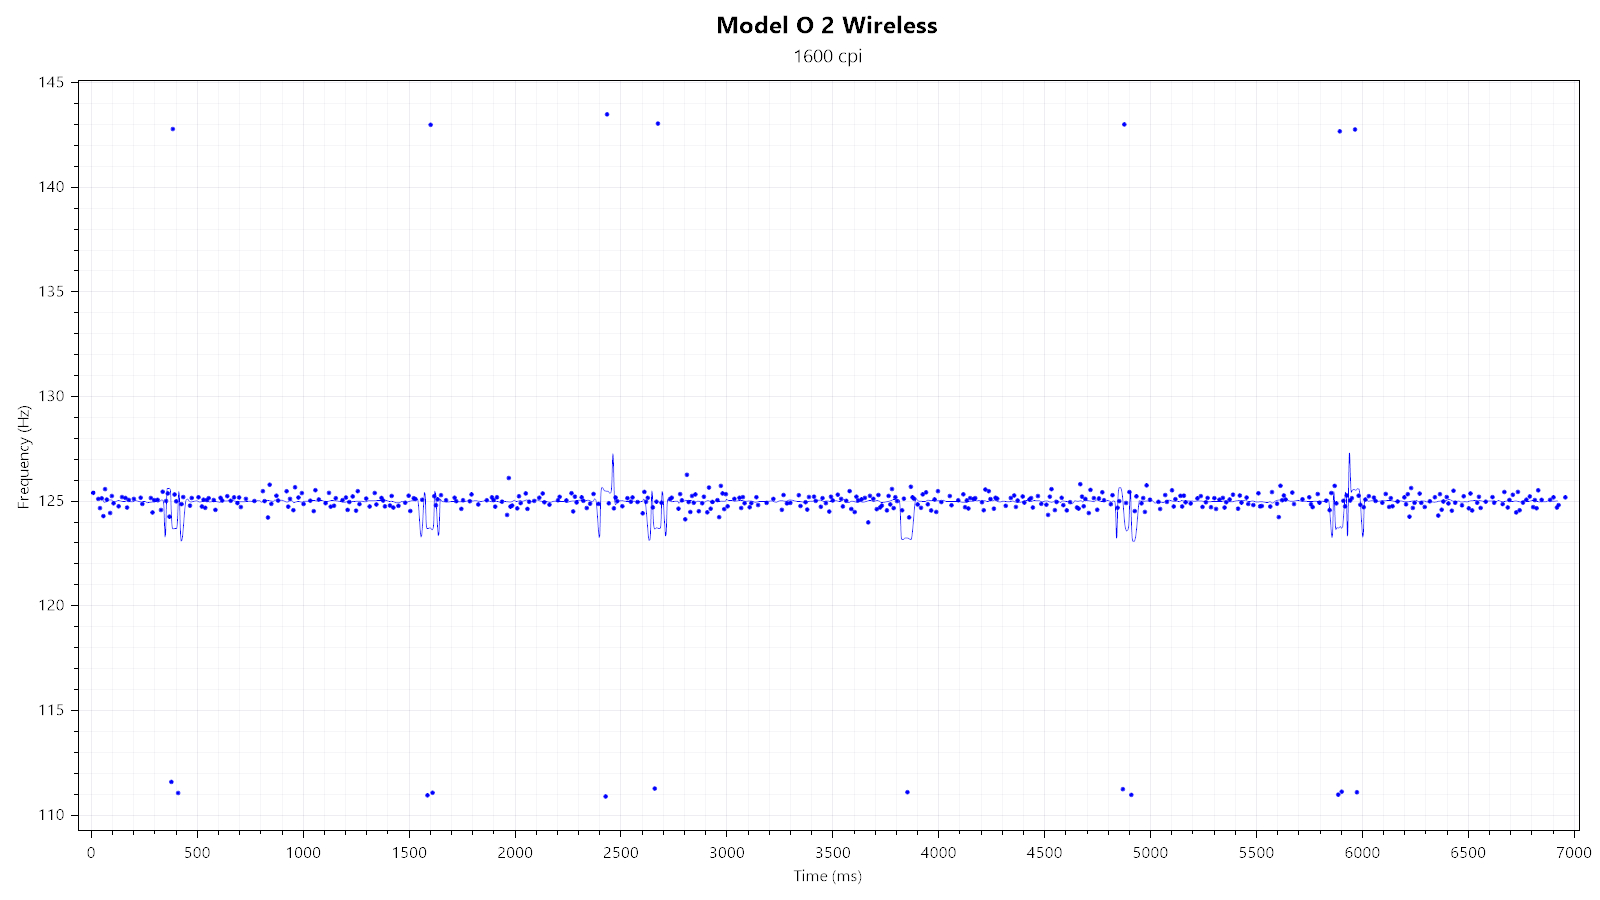
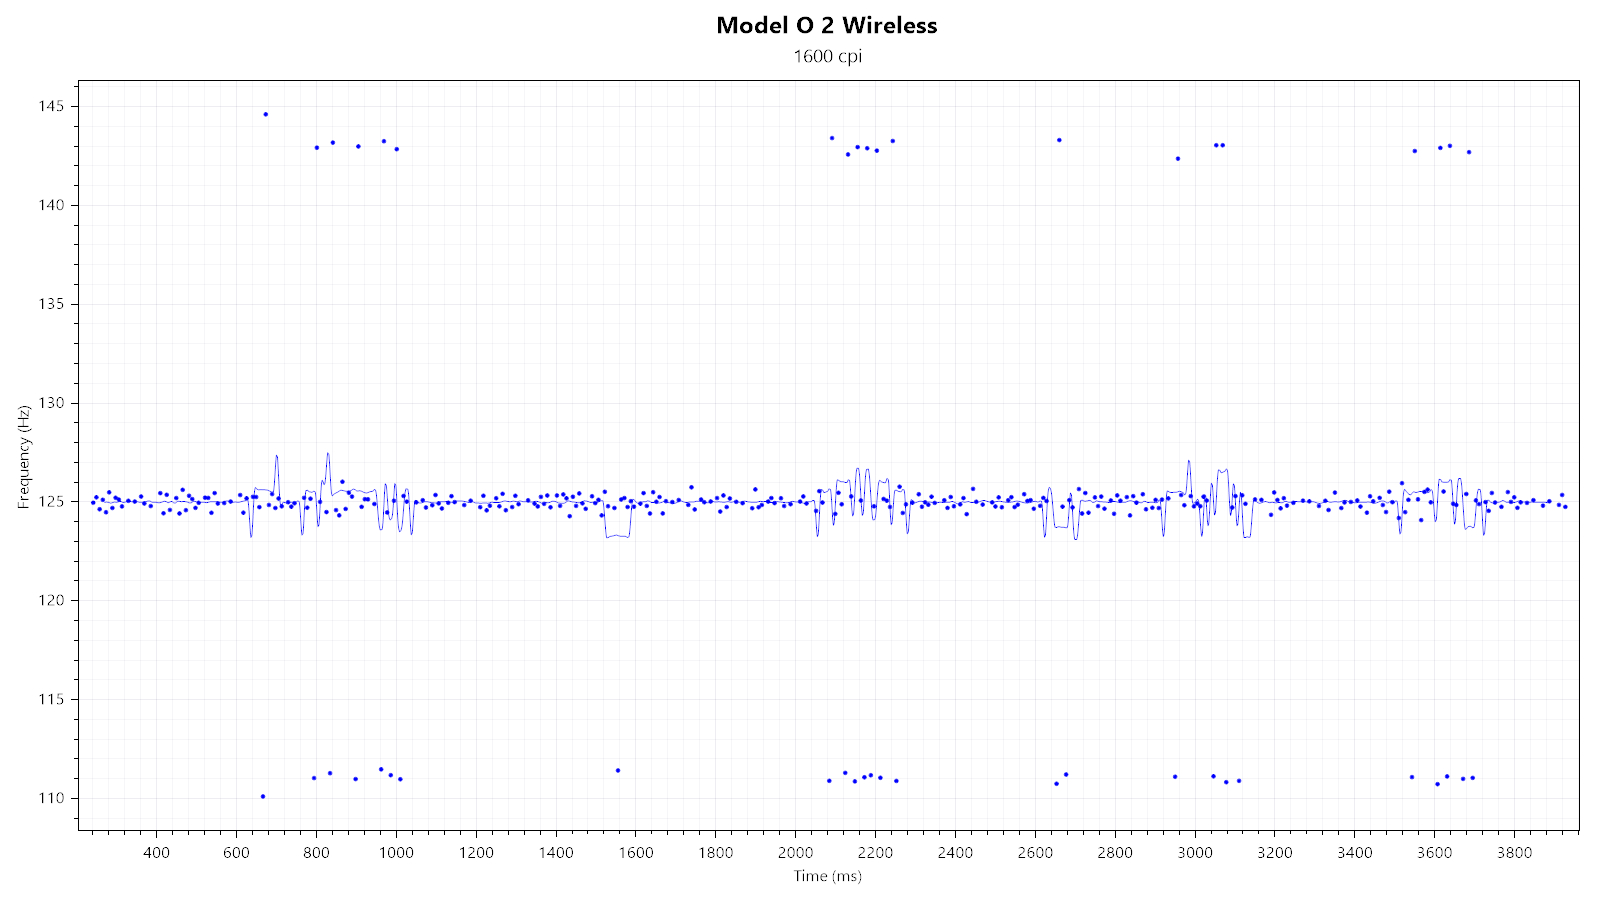
Polling Rate Stability
Considering the Model O 2 Wireless is usable as a wired mouse as well, I'll be testing polling rate stability for both wired and wireless use.Wired testing

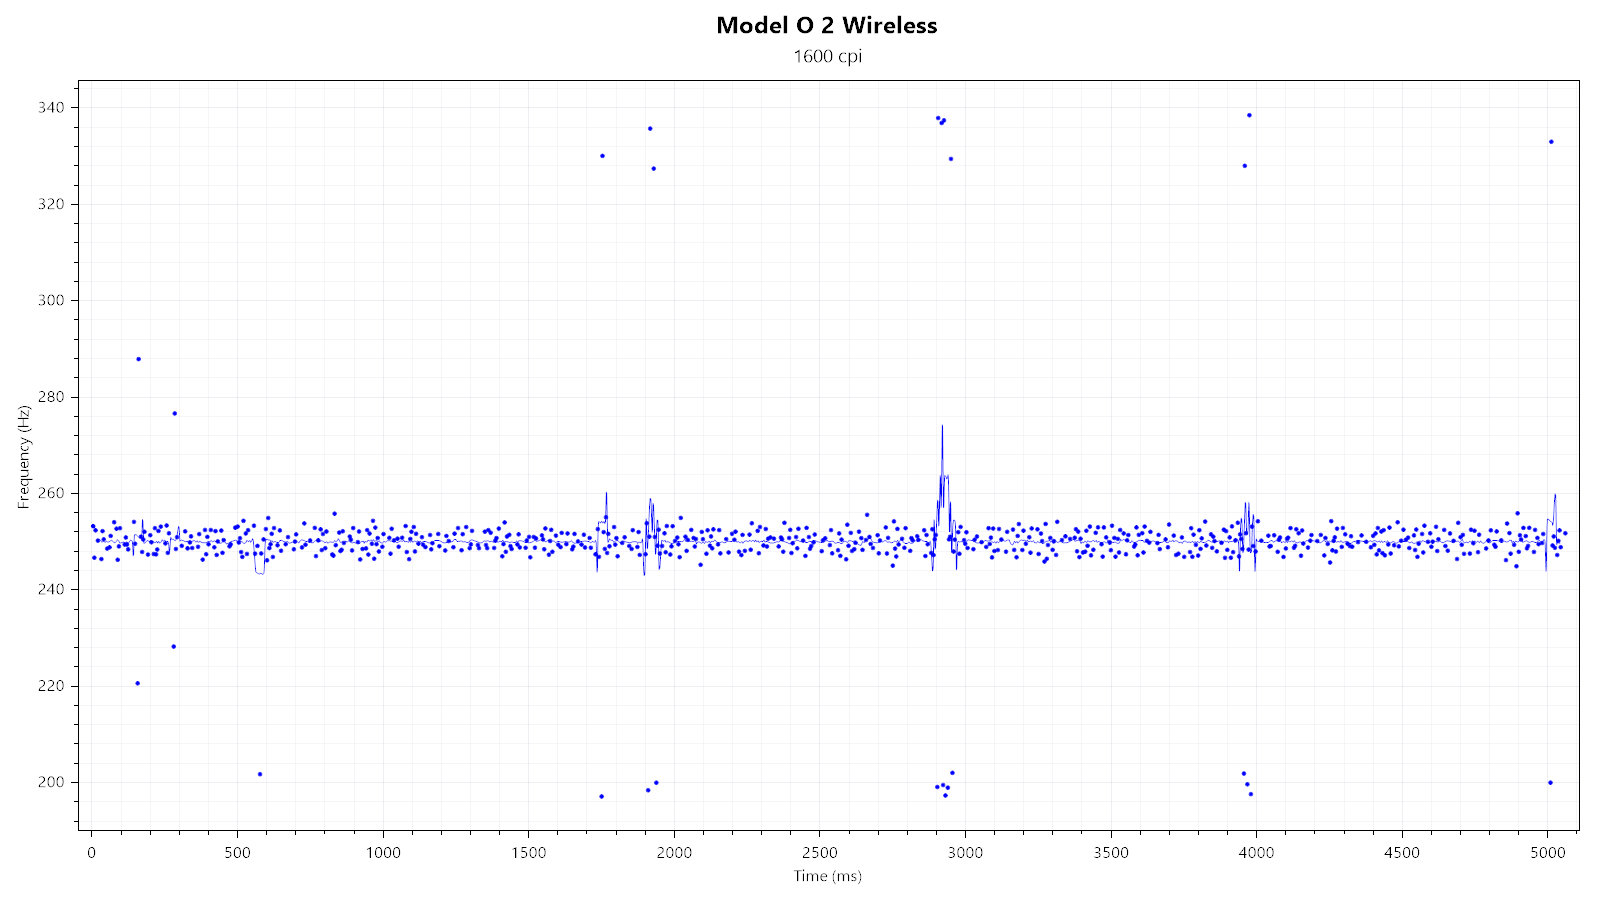
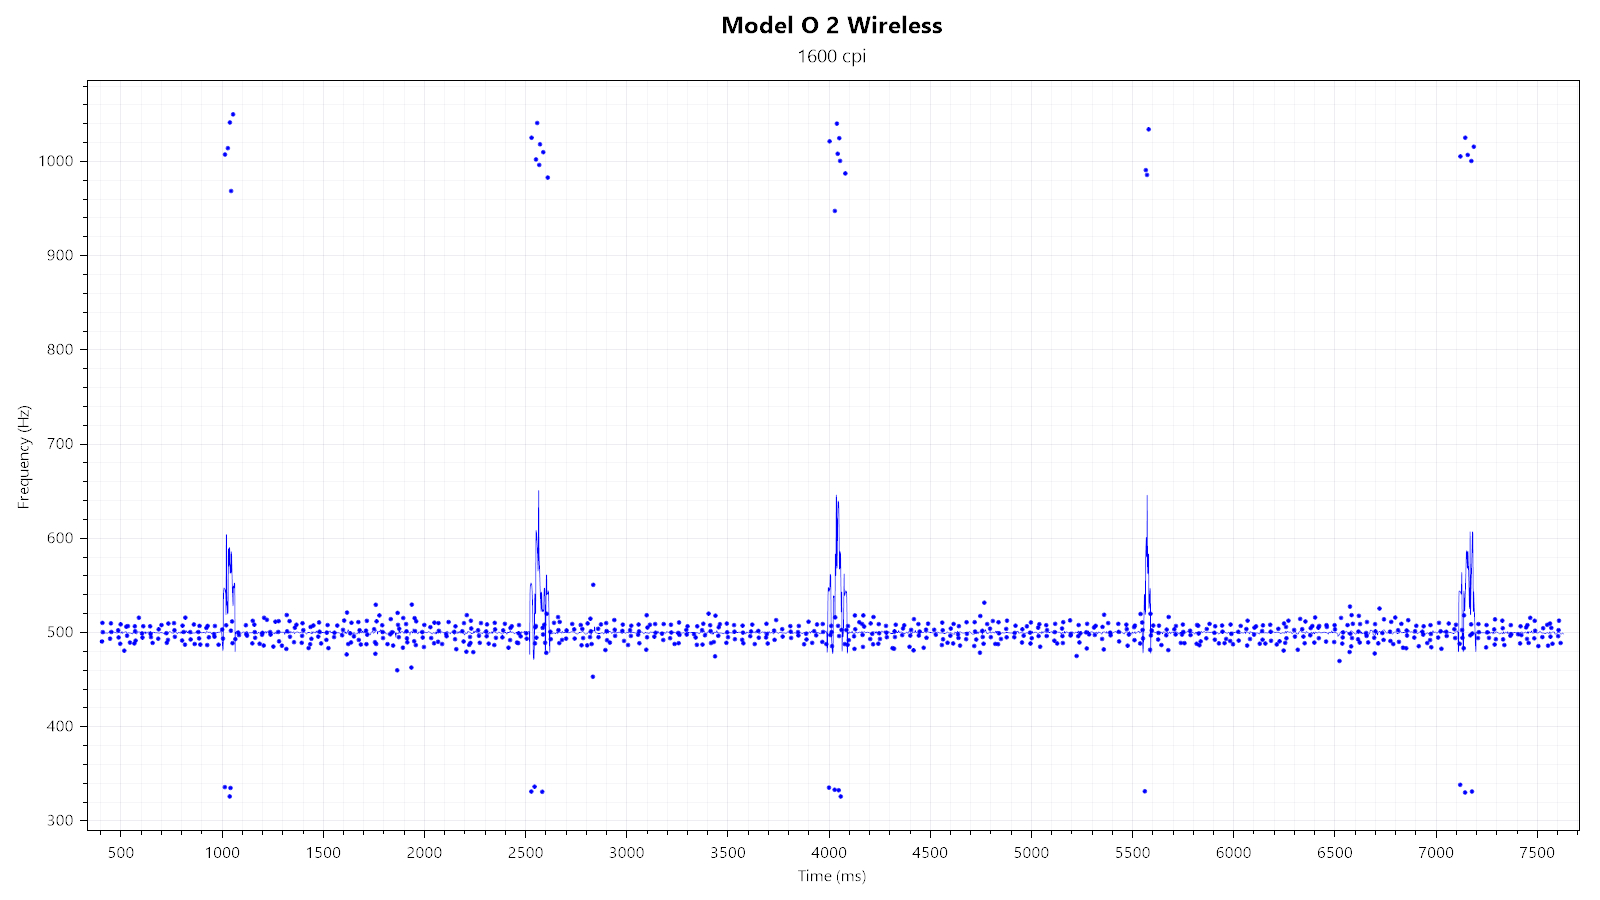
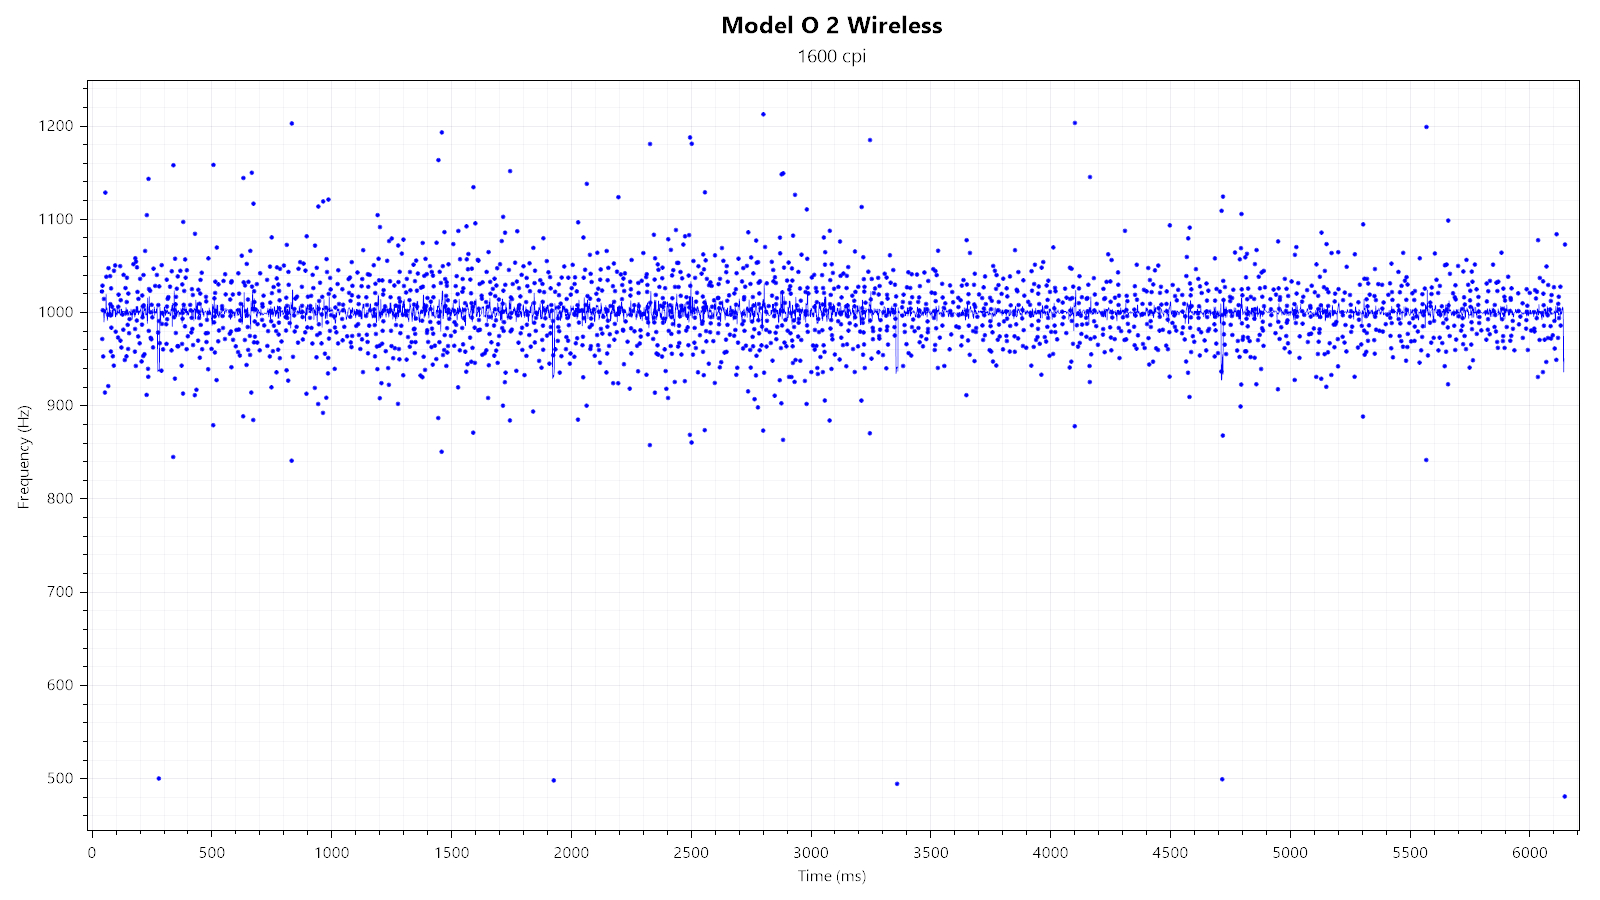
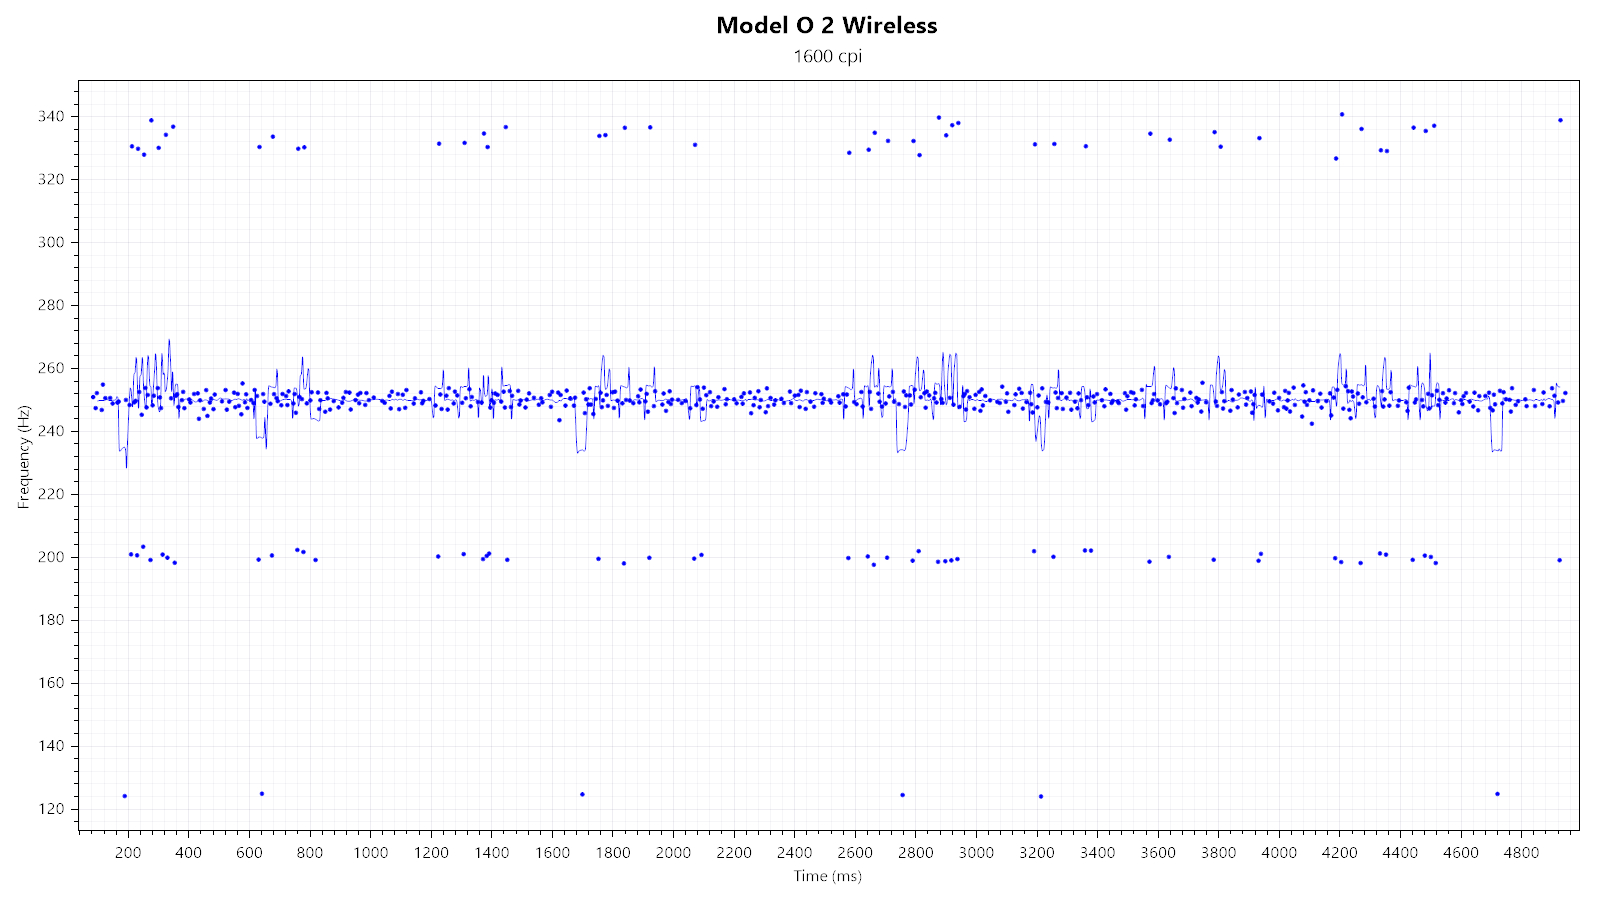
Of the available polling rates (125, 250, 500, and 1000 Hz), only 1000 Hz looks and performs fine, while all the others show periodic outliers. Polling stability is unaffected by any RGB lighting effect.
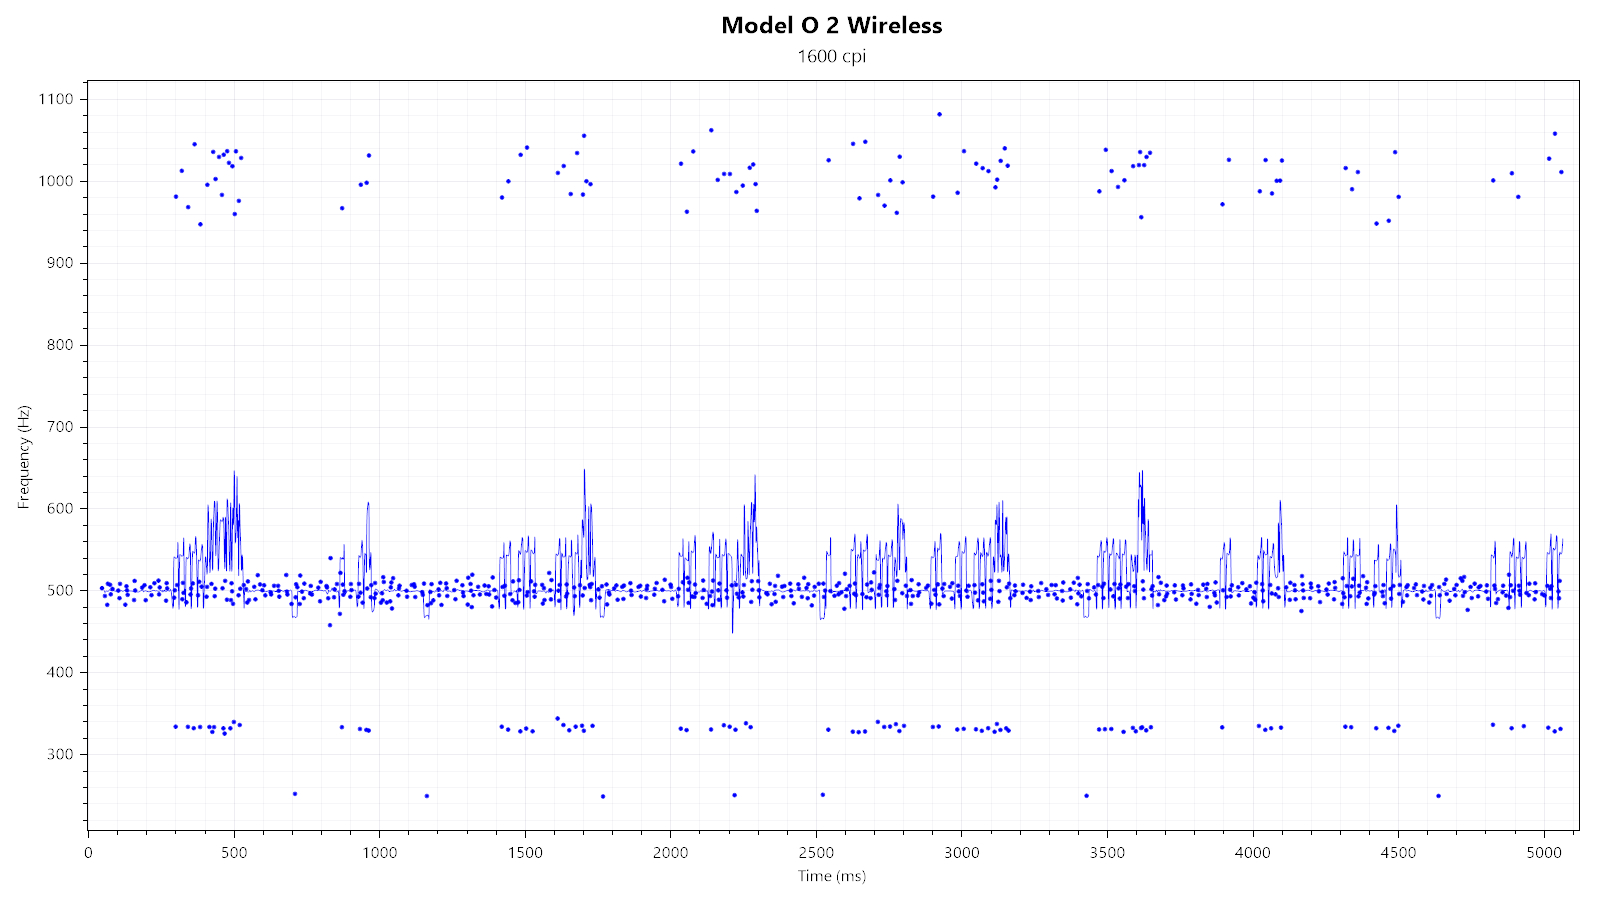
Wireless testing
For wired mice, polling rate stability merely concerns the wired connection between the mouse (SPI communication) and USB. For wireless mice, another device that needs to be kept in sync between the first two is added to the mix: the wireless dongle/wireless receiver. I'm unable to measure all stages of the entire end-to-end signal chain individually, so testing polling-rate stability at the endpoint (the USB) has to suffice here.
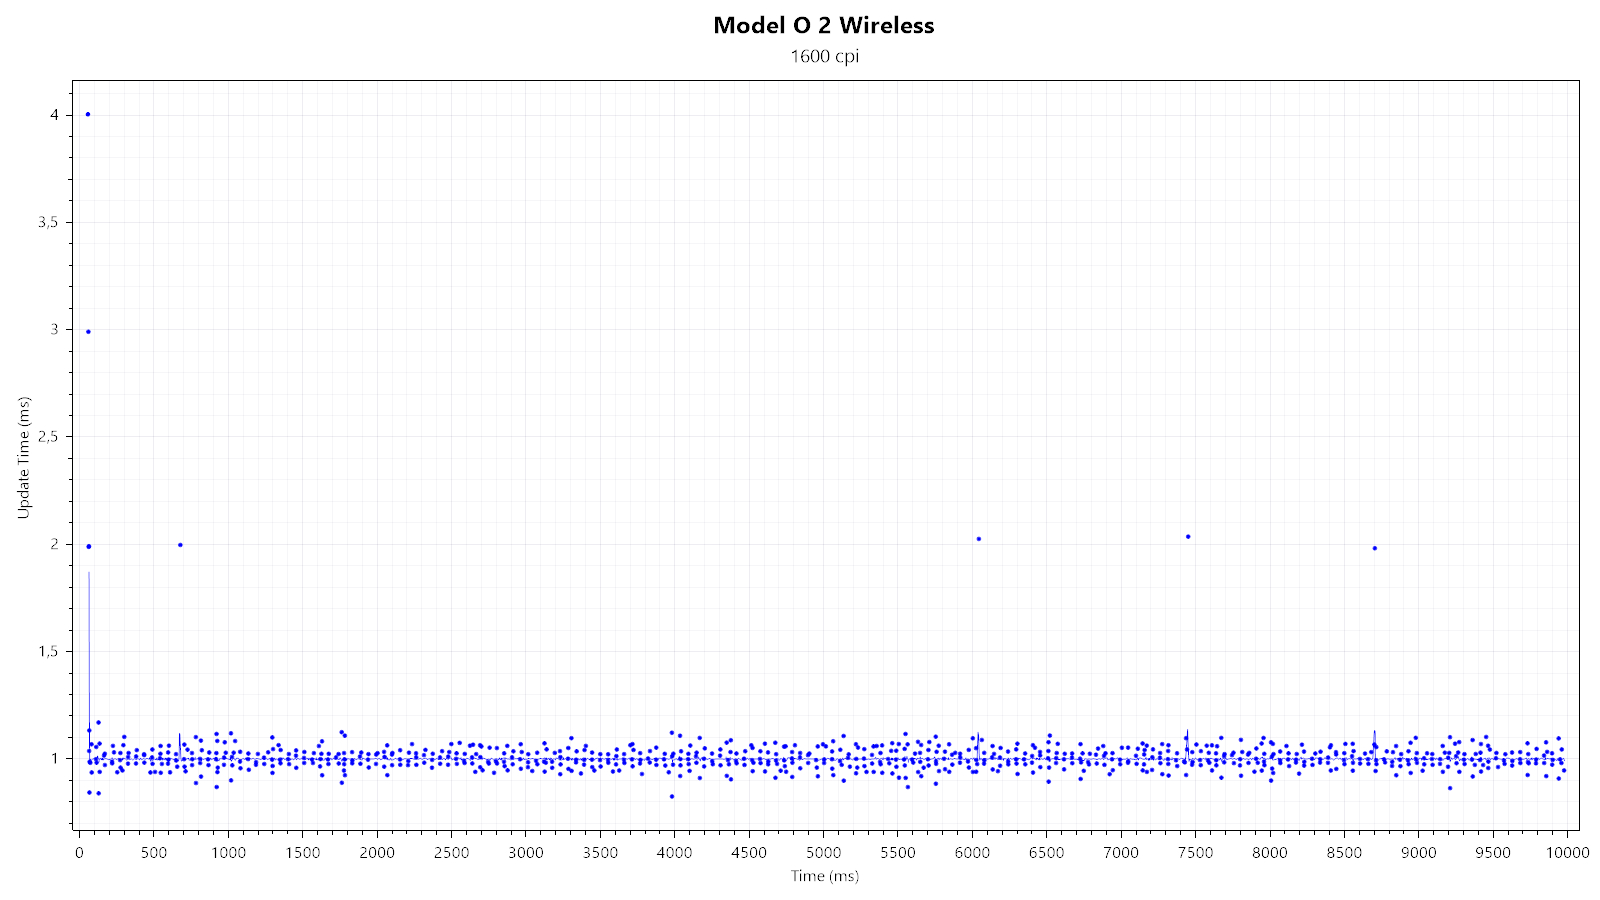
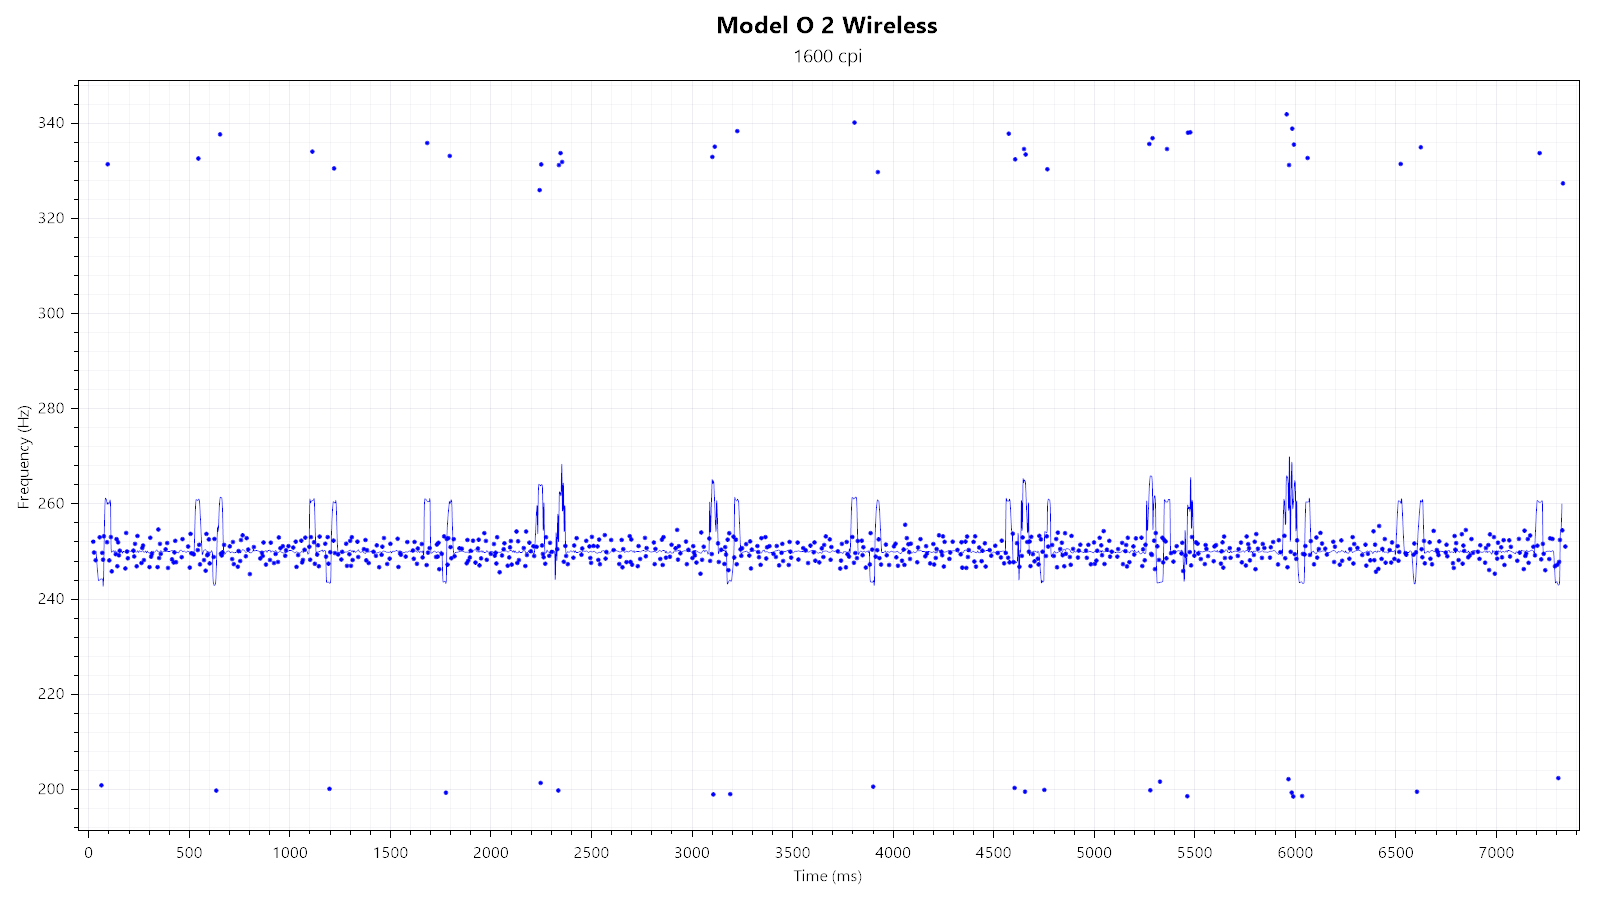
First, I'm testing whether SPI, wireless, and USB communication are synchronized. Any of these being out of sync would be indicated by at least one 2 ms report, which would be the result of any desynchronization drift accumulated over time. Several such 2 ms polls are visible, which may point towards a desynchronization drift.
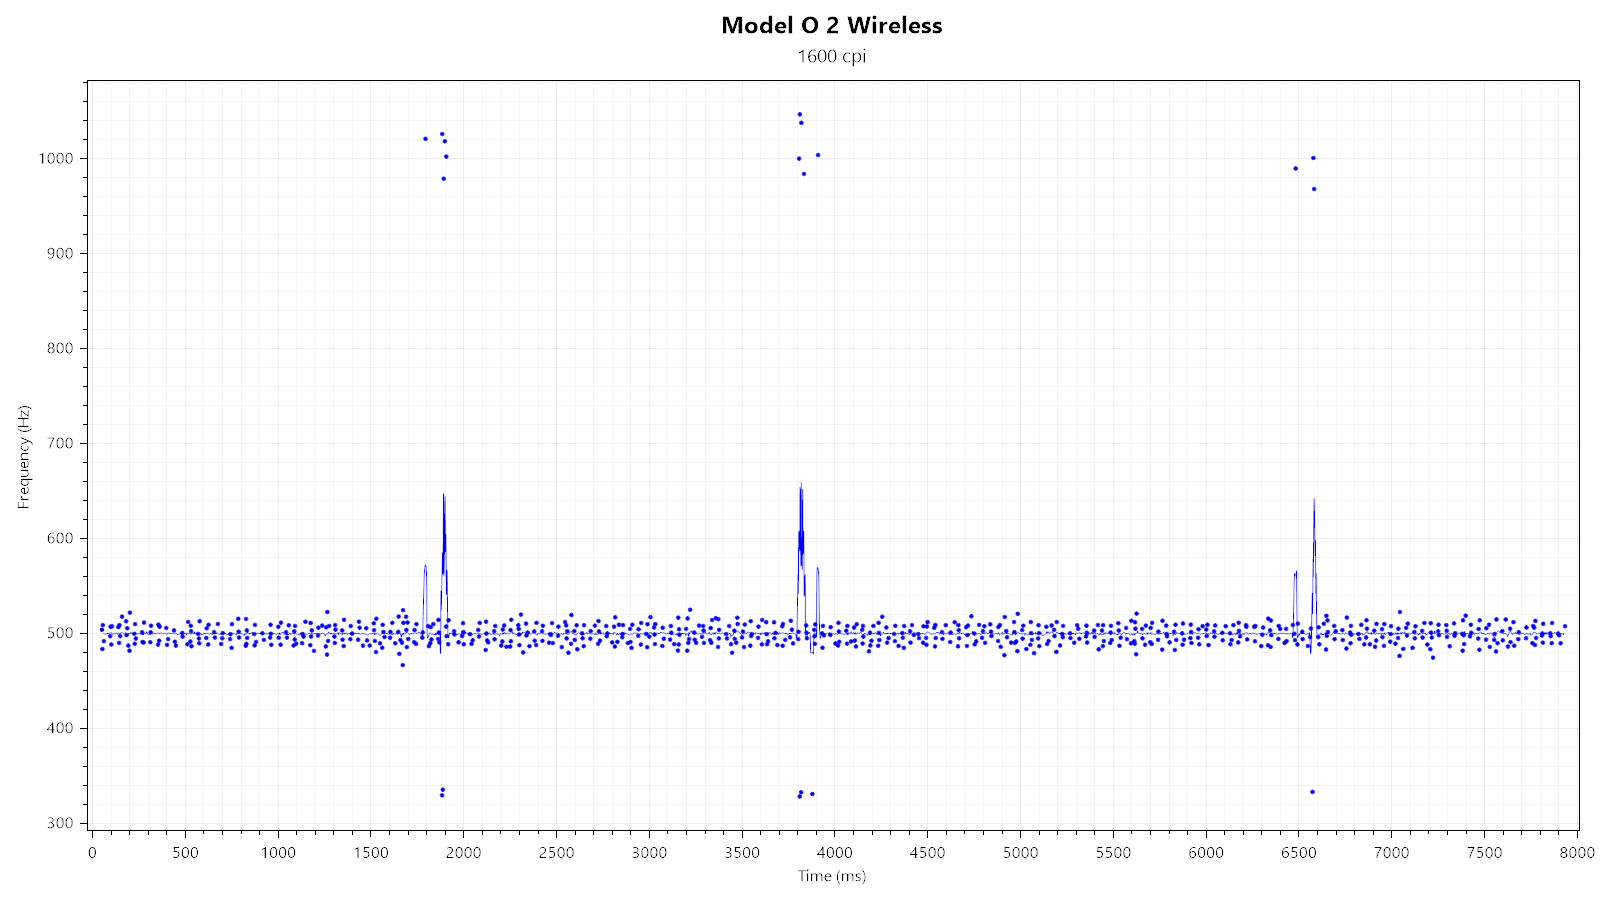
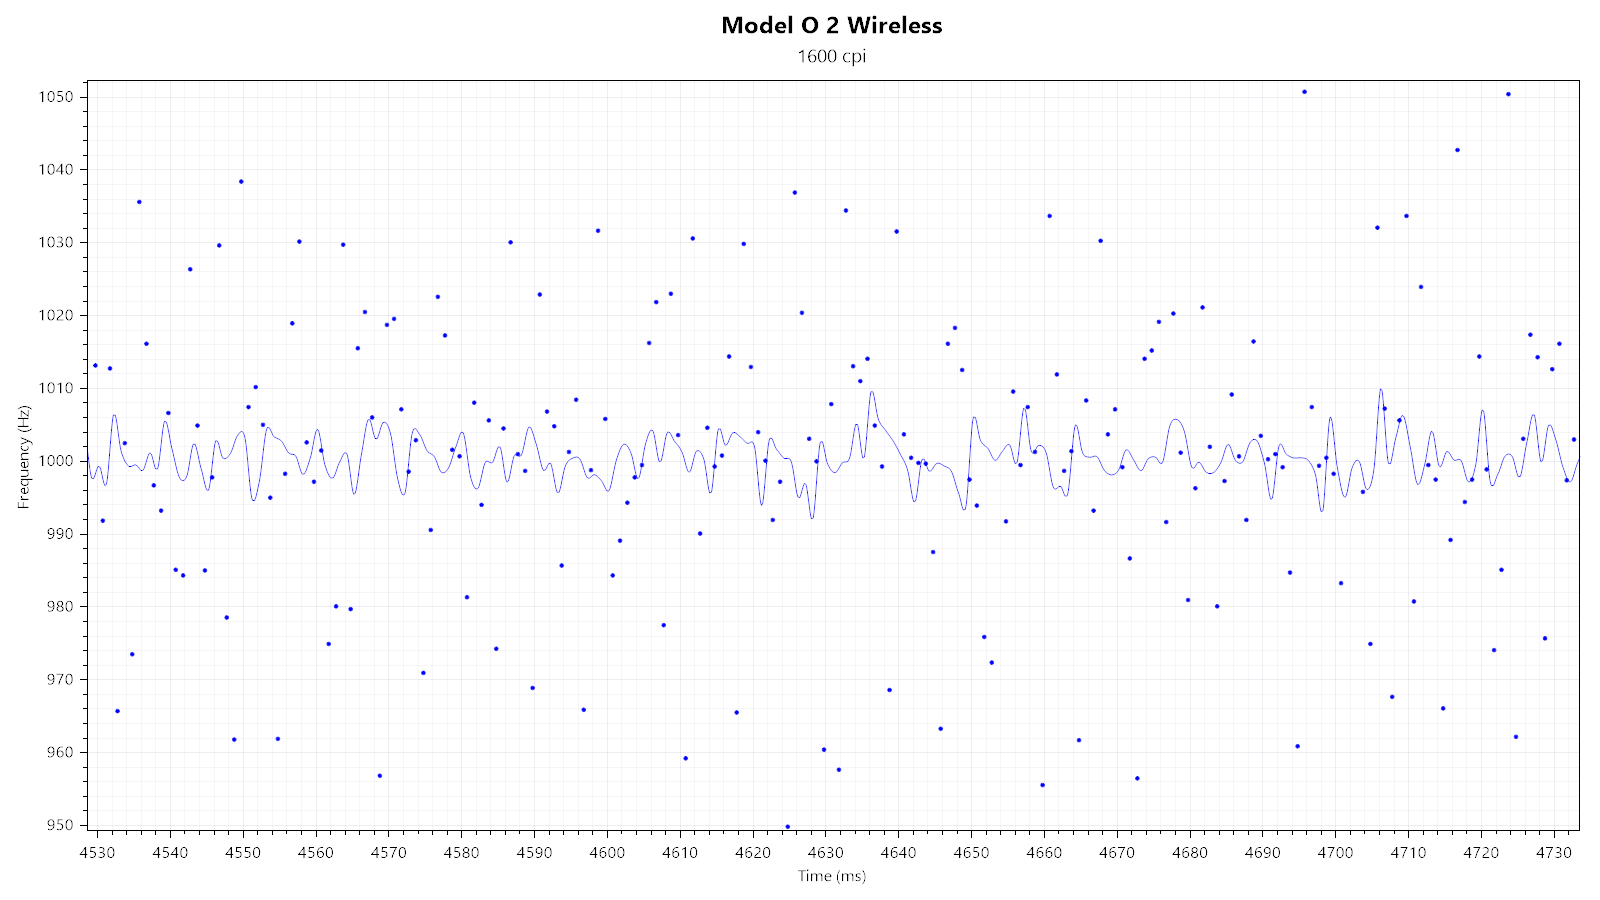
Second, I'm testing the general polling-rate stability of the individual polling rates in wireless mode. Running the Model O 2 Wireless at a lower polling rate can have the benefit of extending battery life. All polling rates show periodic outliers and general instability of various degrees.
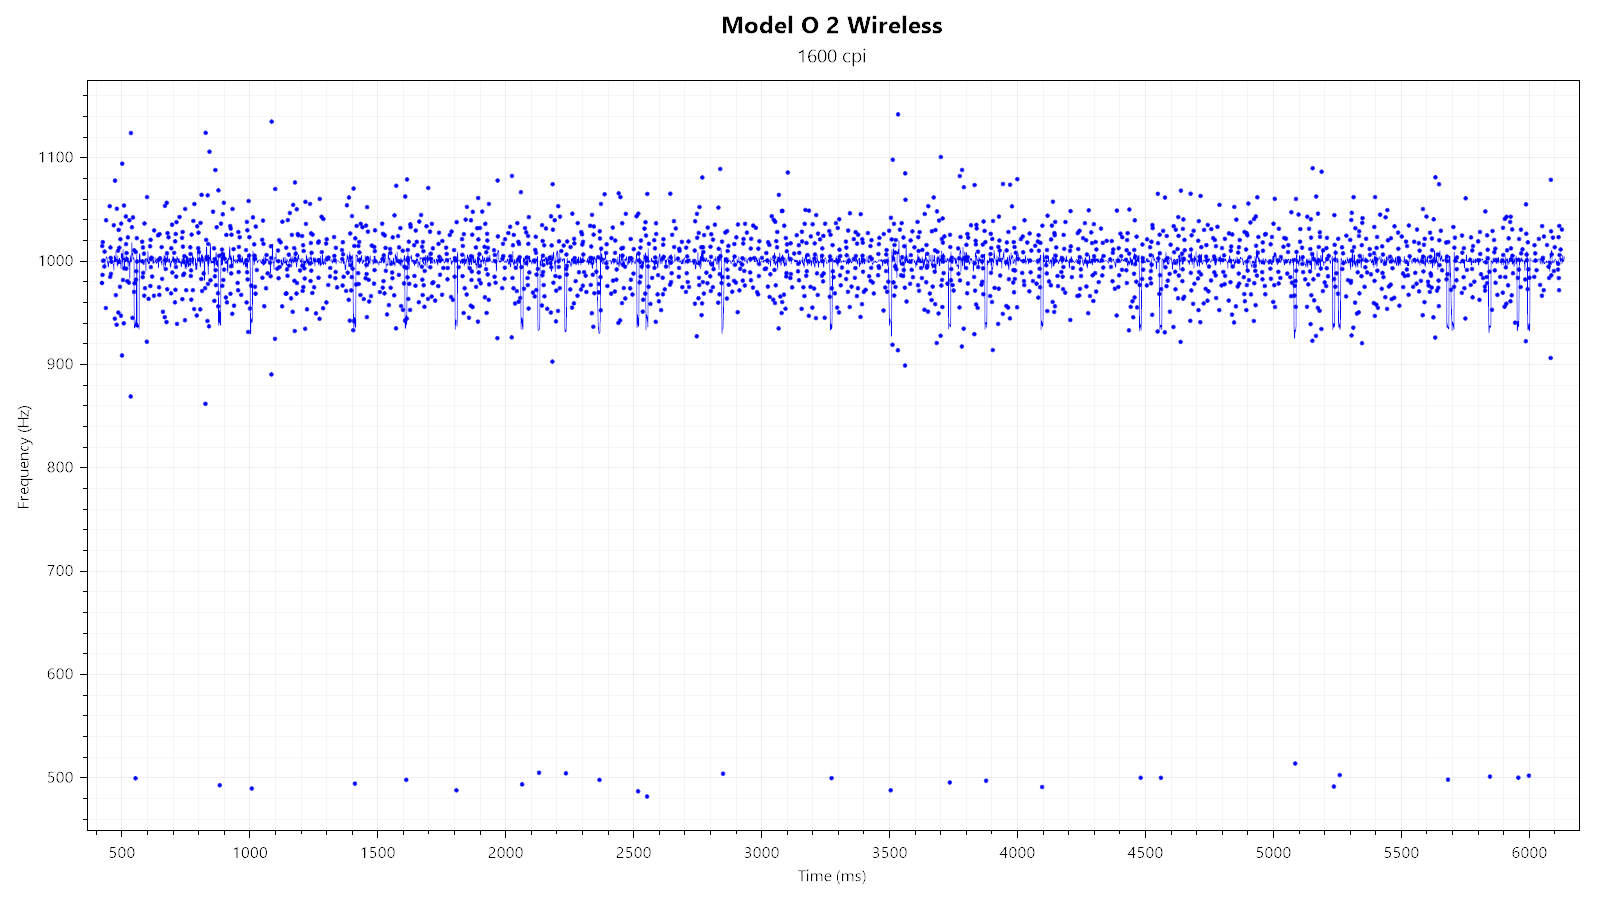
Upon enabling RGB lighting, the degree of instability increases across the board.
Paint Test
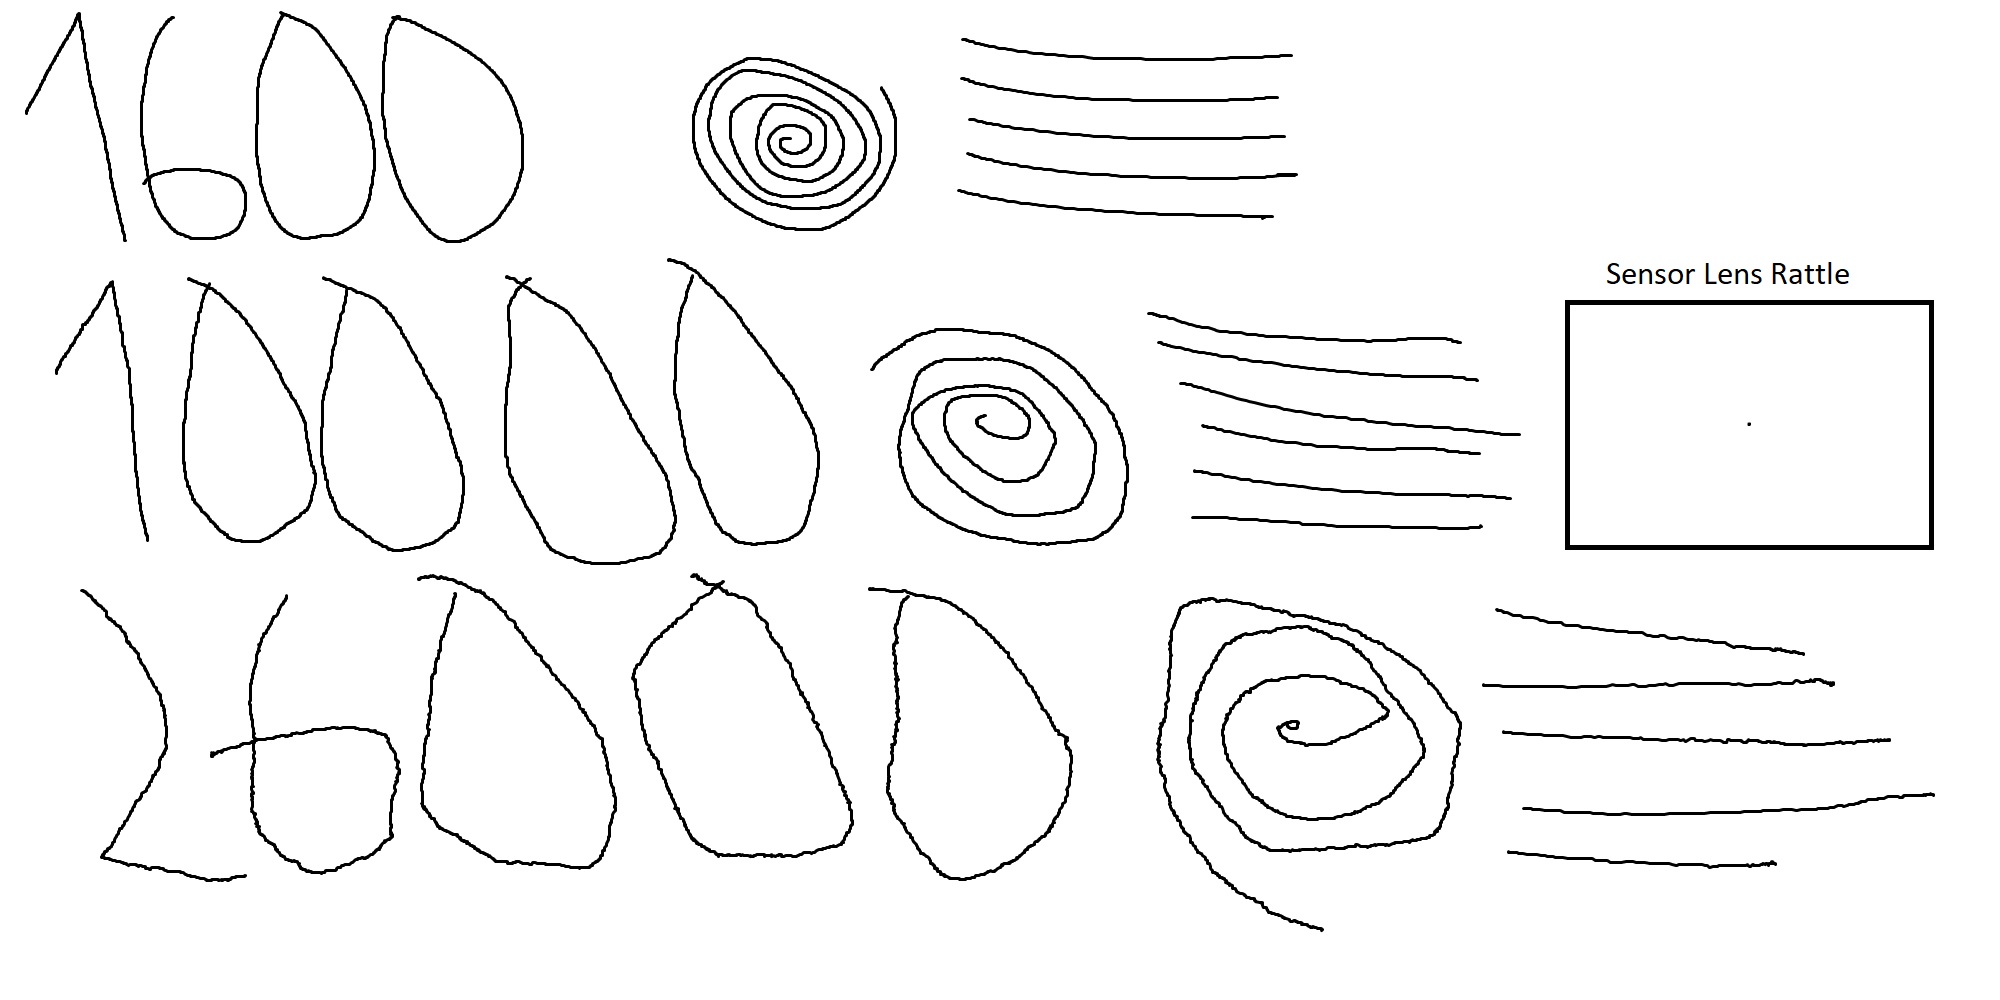
This test is used to indicate any potential issues with angle snapping (non-native straightening of linear motion) and jitter, along with any sensor lens rattle. As you can see, no issues with angle snapping can be observed. There is no jitter visible at 1600 CPI. 10,000 CPI already shows minor to moderate jitter, which is amplified to major levels at 26,000 CPI. This is in line with what to expect from a sensor lacking any smoothing. Lastly, there is no lens movement.
Lift-off Distance
The Model O 2 Wireless offers two pre-defined LOD levels. At the "1 mm" setting, the sensor does track at a height of 1 DVD, but not at a height of 2 DVDs (1.2<x<2.4 mm; x=LOD height). Using the "2 mm" setting, the sensor sporadically tracks at a height of 2 DVDs (2.4<x<3.6 mm; x=LOD height). Keep in mind that LOD may vary slightly depending on the mousing surface (pad) it is being used on.Click Latency

In most computer mice, debouncing is required to avoid double clicks, slam-clicks, or other unintended effects of switch bouncing. Debouncing typically adds a delay, which, along with any potential processing delay, shall be referred to as click latency. In order to measure click latency, the mouse has been interfaced with an NVIDIA LDAT (Latency Display Analysis Tool). Many thanks go to NVIDIA for providing an LDAT device. More specifically, the LDAT measures the time between the electrical activation of the left main button and the OS receiving the button-down message. Unless noted otherwise, the values presented in the graph refer to the lowest click latency possible on the mouse in question. If a comparison mouse is capable of both wired and wireless operation, only the result for wireless (2.4 GHz) operation will be listed.
In wired mode and using a debounce time of 0 ms, click latency has been measured to be 2.1 ms, with standard deviation being 0.49 ms. Using a debounce time of 2 ms, click latency has been measured to be 4.0 ms, with standard deviation being 0.53 ms. Finally, using a debounce time of 10 ms, click latency has been measured to be 11.8 ms, with standard deviation being 0.45 ms.
In wireless mode and using a debounce time of 0 ms, click latency has been measured to be 2.3 ms, with standard deviation being 0.49 ms. Using a debounce time of 2 ms, click latency has been measured to be 4.2 ms, with standard deviation being 0.54 ms. Finally, using a debounce time of 10 ms, click latency has been measured to be 12.0 ms, with standard deviation being 0.46 ms.
Keep in mind that these results have been gathered with an interval of 0.2 s between each sample. If there is an interval of at least 0.3 s between click events and no sensor activity throughout, latency of various degrees is added, provided the set debounce time is equal to or lower than 8 ms. Across multiple runs with debounce time set to 0 ms, I have gotten averages of 4.6, 6.5, and 6.8 ms. In principle, this behavior is similar to the idle delay observed on mice using the CX52850 MCU, albeit less consistent, and the threshold beyond which it occurs is significantly lower. Accordingly, the values given in the graph only apply under specific conditions, and may be considered "best case" numbers that aren't necessarily representative of actual usage.
The main button switches were measured to be running at 3.4 V. I'm not aware of the voltage specifications of the Kailh GM 8.0 (80 M) switches, but I consider it very likely that these are running within specifications.
Jul 12th, 2025 05:19 CDT
change timezone
Latest GPU Drivers
New Forum Posts
- Gigabyte graphic cards - TIM gel SLIPPAGE problem (146)
- What's your latest tech purchase? (24240)
- Best motherboards for XP gaming (103)
- ASUS ProArt GeForce RTX 4060 Ti OC Edition 16GB GDDR6 Gaming - nvflash64 VBIOS mismatch (3)
- Steam Deck Owners Clubhouse (535)
- What are you playing? (23923)
- Chrome has removed uBlock Origin 1.64.0 (remove google search suggestions) (0)
- Can you guess Which game it is? (227)
- Will you buy a RTX 5090? (645)
- 'NVIDIA App' not usable offline? (9)
Popular Reviews
- Fractal Design Epoch RGB TG Review
- Corsair FRAME 5000D RS Review
- Lexar NM1090 Pro 4 TB Review
- NVIDIA GeForce RTX 5050 8 GB Review
- NZXT N9 X870E Review
- Sapphire Radeon RX 9060 XT Pulse OC 16 GB Review - An Excellent Choice
- Our Visit to the Hunter Super Computer
- AMD Ryzen 7 9800X3D Review - The Best Gaming Processor
- Upcoming Hardware Launches 2025 (Updated May 2025)
- Chieftec Iceberg 360 Review
TPU on YouTube
Controversial News Posts
- Intel's Core Ultra 7 265K and 265KF CPUs Dip Below $250 (288)
- Some Intel Nova Lake CPUs Rumored to Challenge AMD's 3D V-Cache in Desktop Gaming (140)
- AMD Radeon RX 9070 XT Gains 9% Performance at 1440p with Latest Driver, Beats RTX 5070 Ti (131)
- NVIDIA Launches GeForce RTX 5050 for Desktops and Laptops, Starts at $249 (119)
- NVIDIA GeForce RTX 5080 SUPER Could Feature 24 GB Memory, Increased Power Limits (115)
- Microsoft Partners with AMD for Next-gen Xbox Hardware (105)
- Intel "Nova Lake‑S" Series: Seven SKUs, Up to 52 Cores and 150 W TDP (100)
- NVIDIA DLSS Transformer Cuts VRAM Usage by 20% (97)