Wednesday, July 25th 2018
BACKBLAZE Releases HDD Stats for Q2 2018
As of June 30, 2018 we had 100,254 spinning hard drives in Backblaze's data centers. Of that number, there were 1,989 boot drives and 98,265 data drives. This review looks at the quarterly and lifetime statistics for the data drive models in operation in our data centers. We'll also take another look at comparing enterprise and consumer drives, get a first look at our 14 TB Toshiba drives, and introduce you to two new SMART stats. Along the way, we'll share observations and insights on the data presented and we look forward to you doing the same in the comments.
Hard Drive Reliability Statistics for Q2 2018
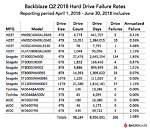
Of the 98,265 hard drives we were monitoring at the end of Q2 2018, we removed from consideration those drives used for testing purposes and those drive models for which we did not have at least 45 drives. This leaves us with 98,184 hard drives. The table below covers just Q2 2018.Notes and Observations
If a drive model has a failure rate of 0%, it just means that there were no drive failures of that model during Q2 2018.
The Annualized Failure Rate (AFR) for Q2 is just 1.08%, well below the Q1 2018 AFR and is our lowest quarterly AFR yet. That said, quarterly failure rates can be volatile, especially for models that have a small number of drives and/or a small number of Drive Days.
There were 81 drives (98,265 minus 98,184) that were not included in the list above because we did not have at least 45 of a given drive model. We use 45 drives of the same model as the minimum number when we report quarterly, yearly, and lifetime drive statistics. The use of 45 drives is historical in nature as that was the number of drives in our original Storage Pods.
Hard Drive Migrations Continue
The Q2 2018 Quarterly chart above was based on 98,184 hard drives. That was only 138 more hard drives than Q1 2018, which was based on 98,046 drives. Yet, we added nearly 40 PB of cloud storage during Q1. If we tried to store 40 PB on the 138 additional drives we added in Q2 then each new hard drive would have to store nearly 300 TB of data. While 300 TB hard drives would be awesome, the less awesome reality is that we replaced over 4,600 4 TB drives with nearly 4,800 12 TB drives.
The age of the 4 TB drives being replaced was between 3.5 and 4 years. In all cases their failure rates were 3% AFR (Annualized Failure Rate) or less, so why remove them? Simple, drive density - in this case three times the storage in the same cabinet space. Today, four years of service is the about the time where it makes financial sense to replace existing drives versus building out a new facility with new racks, etc. While there are several factors that go into the decision to migrate to higher density drives, keeping hard drives beyond that tipping point means we would be under utilizing valuable data center real estate.
Toshiba 14 TB drives and SMART Stats 23 and 24
In Q2 we added twenty 14 TB Toshiba hard drives (model: MG07ACA14TA) to our mix (not enough to be listed on our charts), but that will change as we have ordered an additional 1,200 drives to be deployed in Q3. These are 9-platter Helium filled drives which use their CMR/PRM (not SMR) recording technology.
In addition to being new drives for us, the Toshiba 14 TB drives also add two new SMART stat pairs: SMART 23 (Helium condition lower) and SMART 24 (Helium condition upper). Both attributes report normal and raw values, with the raw values currently being 0 and the normalized values being 100. As we learn more about these values, we'll let you know. In the meantime, those of you who utilize our hard drive test data will need to update your data schema and upload scripts to read in the new attributes.
By the way, none of the 20 Toshiba 14 TB drives have failed after 3 weeks in service, but it is way too early to draw any conclusions.
Lifetime Hard Drive Reliability Statistics
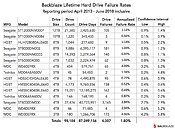
While the quarterly chart presented earlier gets a lot of interest, the real test of any drive model is over time. Below is the lifetime failure rate chart for all the hard drive models in operation as of June 30th, 2018. For each model, we compute its reliability starting from when it was first installed,Notes and Observations
The combined AFR for all of the larger drives (8-, 10- and 12 TB) is only 1.02%. Many of these drives were deployed in the last year, so there is some volatility in the data, but we would expect this overall rate to decrease slightly over the next couple of years.
The overall failure rate for all hard drives in service is 1.80%. This is the lowest we have ever achieved, besting the previous low of 1.84% from Q1 2018.
Enterprise versus Consumer Hard Drives
In our Q3 2017 hard drive stats review, we compared two Seagate 8 TB hard drive models: one a consumer class drive (model: ST8000DM002) and the other an enterprise class drive (model: ST8000NM0055). Let's compare the lifetime annualized failure rates from Q3 2017 and Q2 2018:
Lifetime AFR as of Q3 2017
Let's start with drive days, the total number of days all the hard drives of a given model have been operational.
Next we'll look at the confidence intervals for each model to see the range of possibilities within two deviations.
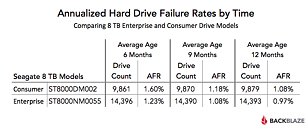
Finally we'll look at drive age - actually average drive age to be precise. This is the average time in operational service, in months, of all the drives of a given model. We'll will start with the point in time when each drive reached approximately the current number of drives. That way the addition of new drives (not replacements) will have a minimal effect.When you constrain for drive count and average age, the AFR (annualized failure rate) of the enterprise drive is consistently below that of the consumer drive for these two drive models - albeit not by much.
Whether every enterprise model is better than every corresponding consumer model is unknown, but below are a few reasons you might choose one class of drive over another:Backblaze is known to be "thrifty" when purchasing drives. When you purchase 100 drives at a time or are faced with a drive crisis, it makes sense to purchase consumer drives. When you starting purchasing 100 petabytes' worth of hard drives at a time, the price gap between enterprise and consumer drives shrinks to the point where the other factors come into play.
Source:
Backblaze
Hard Drive Reliability Statistics for Q2 2018
Of the 98,265 hard drives we were monitoring at the end of Q2 2018, we removed from consideration those drives used for testing purposes and those drive models for which we did not have at least 45 drives. This leaves us with 98,184 hard drives. The table below covers just Q2 2018.Notes and Observations
If a drive model has a failure rate of 0%, it just means that there were no drive failures of that model during Q2 2018.
The Annualized Failure Rate (AFR) for Q2 is just 1.08%, well below the Q1 2018 AFR and is our lowest quarterly AFR yet. That said, quarterly failure rates can be volatile, especially for models that have a small number of drives and/or a small number of Drive Days.
There were 81 drives (98,265 minus 98,184) that were not included in the list above because we did not have at least 45 of a given drive model. We use 45 drives of the same model as the minimum number when we report quarterly, yearly, and lifetime drive statistics. The use of 45 drives is historical in nature as that was the number of drives in our original Storage Pods.
Hard Drive Migrations Continue
The Q2 2018 Quarterly chart above was based on 98,184 hard drives. That was only 138 more hard drives than Q1 2018, which was based on 98,046 drives. Yet, we added nearly 40 PB of cloud storage during Q1. If we tried to store 40 PB on the 138 additional drives we added in Q2 then each new hard drive would have to store nearly 300 TB of data. While 300 TB hard drives would be awesome, the less awesome reality is that we replaced over 4,600 4 TB drives with nearly 4,800 12 TB drives.
The age of the 4 TB drives being replaced was between 3.5 and 4 years. In all cases their failure rates were 3% AFR (Annualized Failure Rate) or less, so why remove them? Simple, drive density - in this case three times the storage in the same cabinet space. Today, four years of service is the about the time where it makes financial sense to replace existing drives versus building out a new facility with new racks, etc. While there are several factors that go into the decision to migrate to higher density drives, keeping hard drives beyond that tipping point means we would be under utilizing valuable data center real estate.
Toshiba 14 TB drives and SMART Stats 23 and 24
In Q2 we added twenty 14 TB Toshiba hard drives (model: MG07ACA14TA) to our mix (not enough to be listed on our charts), but that will change as we have ordered an additional 1,200 drives to be deployed in Q3. These are 9-platter Helium filled drives which use their CMR/PRM (not SMR) recording technology.
In addition to being new drives for us, the Toshiba 14 TB drives also add two new SMART stat pairs: SMART 23 (Helium condition lower) and SMART 24 (Helium condition upper). Both attributes report normal and raw values, with the raw values currently being 0 and the normalized values being 100. As we learn more about these values, we'll let you know. In the meantime, those of you who utilize our hard drive test data will need to update your data schema and upload scripts to read in the new attributes.
By the way, none of the 20 Toshiba 14 TB drives have failed after 3 weeks in service, but it is way too early to draw any conclusions.
Lifetime Hard Drive Reliability Statistics
While the quarterly chart presented earlier gets a lot of interest, the real test of any drive model is over time. Below is the lifetime failure rate chart for all the hard drive models in operation as of June 30th, 2018. For each model, we compute its reliability starting from when it was first installed,Notes and Observations
The combined AFR for all of the larger drives (8-, 10- and 12 TB) is only 1.02%. Many of these drives were deployed in the last year, so there is some volatility in the data, but we would expect this overall rate to decrease slightly over the next couple of years.
The overall failure rate for all hard drives in service is 1.80%. This is the lowest we have ever achieved, besting the previous low of 1.84% from Q1 2018.
Enterprise versus Consumer Hard Drives
In our Q3 2017 hard drive stats review, we compared two Seagate 8 TB hard drive models: one a consumer class drive (model: ST8000DM002) and the other an enterprise class drive (model: ST8000NM0055). Let's compare the lifetime annualized failure rates from Q3 2017 and Q2 2018:
Lifetime AFR as of Q3 2017
- 8 TB consumer drives: 1.1% annualized failure rate
- 8 TB enterprise drives: 1.2% annualized failure rate
- TB consumer drives: 1.03% annualized failure rate
- TB enterprise drives: 0.97% annualized failure rate
Let's start with drive days, the total number of days all the hard drives of a given model have been operational.
- 8 TB consumer (model: ST8000DM002): 6,395,117 drive days
- 8 TB enterprise (model: ST8000NM0055): 5,279,564 drive days
Next we'll look at the confidence intervals for each model to see the range of possibilities within two deviations.
- TB consumer (model: ST8000DM002): Range 0.9% to 1.2%
- TB enterprise (model: ST8000NM0055): Range 0.8% to 1.1%
Finally we'll look at drive age - actually average drive age to be precise. This is the average time in operational service, in months, of all the drives of a given model. We'll will start with the point in time when each drive reached approximately the current number of drives. That way the addition of new drives (not replacements) will have a minimal effect.When you constrain for drive count and average age, the AFR (annualized failure rate) of the enterprise drive is consistently below that of the consumer drive for these two drive models - albeit not by much.
Whether every enterprise model is better than every corresponding consumer model is unknown, but below are a few reasons you might choose one class of drive over another:Backblaze is known to be "thrifty" when purchasing drives. When you purchase 100 drives at a time or are faced with a drive crisis, it makes sense to purchase consumer drives. When you starting purchasing 100 petabytes' worth of hard drives at a time, the price gap between enterprise and consumer drives shrinks to the point where the other factors come into play.


23 Comments on BACKBLAZE Releases HDD Stats for Q2 2018
Edit: Also, for anyone interested, I did an actual failure rate chart using their data. Just directly the number of drives of each model vs the number of failures.
You might notice the one drive that has more failures than drives, and think this is odd. They actually address this in one of their blog posts in the past. In situations where they have more failure than actual drives, it is because of warranty replacements. They only list the number of drives they bought, if a drive was replaced under warranty, they don't include the replacement drive in the number of drives. So if a warranty replacement drive fails after it has been replaced, it counts as two fails but only one drive. Yes, it is a stupid way to do things, and one of the many reasons their data is pretty useless.
They've talked about this in the past, and how they've had some models of drive that have 100% failure rates that they just don't include in the numbers, because they found out those drives just did not like to be run in RAID.
Some of their drives are marked failed due to SMART data, but some are also marked failed just because they won't run in a RAID. Without knowing the breakdown of which is which, the data is pretty useless to an average consumer that is just going to be running a single drive.
Worthwhile data can be found here:
www.hardware.fr/articles/962-6/disques-durs.html
Overall Brand Failure Rates are so close so as to be of no consequence - last 6 monthreporting period (previous 6 month reporting period) - Last year
- HGST 0,82% (1,13%) - 0.975 %
- Seagate 0,93% (0,72%) - 0.825
- Toshiba 1,06% (0,80%) - 0.930
- Western 1,26% ( 1,04%) - 1.150
More significant is individual model Failure Rates (> 2%)With that said, there is still some value with these reports that they provide being that it provides us consumers with a general idea of how robust specific hard drives are. Furthermore, some of us consumers apply these hard drives in RAID arrays. I'm unsure of which SMART attributes you are referring to.
Annualized failure rates make sense to me, even as a consumer. WD60EFRX is 10 times more likely to fail per year of operation compared to HMS5C4040BLE640. That tells me I shouldn't buy the WD60EFRX.
BlackBlazes' primary issue is that they buy lots of drives of few models. For example, my Seagate 6TB isn't represented (the NM version). They have a huge sample size of relatively small variety.
And, no, a drive that is kicked out from a RAID array is not necessarily a failed drive. It might be failed to them, but that drive might have never been considered failed on single drive consumer setup. RAID arrays are picky sometimes, and as I've said, I've experienced drives that just don't make the RAID controller happy and get kicked out. There is nothing wrong with the drive, they aren't faulty or failed, the controller just didn't like how long it took the drive to respond and kicked it out of the array.It is for these types of numbers. And at the same time, if they just put 45 drives in service a few months ago and one fails, the failure rate will look really bad when it really might not be. Yes, they tuck that little bit of explanation in the long article, but they should have to. Instead they should use good data from the beginning and only present good clean data with samples that have actually been in service long enough to matter.
If the errors are caused by vibrations and not response time, then one can easily argue that the drive's operating conditions are subpar: another reason not to get it.They are kept in a data center environment which means lots of cool AC air running past them. As a result, they stay well inside the manufacturers design limit. What's unique to storage pods compared to normal installation is the harmonic resonance 45+ drives can generate. Vibrations can lead to the head parking which can lead to failing to write in an orderly fashion.
However, the failure case of simply a RAID array kicking a drive out because it took too long to respond, for whatever reason, is not a failure case that affects the normal consumer. The normal consumer is not using these drives in RAID, they are buying single drive configurations. That is the target market for these drives, that is what they are designed to be used in, and that is where their failure numbers should be tested.
Server farms, when properly designed and built on secure racks bolted to thick concrete floors are not equipped with this feature. Putting a consumer drive with this feature into a a server rack is a bonehead move which only an extreme low budget outfit like BB would attempt. Consumer drives are rated for 250-500k "parks" ... far more than would ever be necessary on desktop usage. The very feature that protects consumer drives in a consumer environment is a death knell in a server farm because with the I/O server drives can blow thru the rated number of parks in a month. It also slows down the server as the arm is continually moving from parked to read positions.
It's like using "Ez clean wall latex paint" on a BBQ and then complaning cause it burnt off.
If you'd like an example of this in real world:
1. Every hard drives experience "wear and tear" from arm movement
2. Consumer hard drives are rated for a maximum of250 - 500k head parks.
3. Server drives can go thru that number of cycles in 90 days