 9
9
Cooler Master MM731 Review
Software, Lighting & Battery Life »Sensor and Performance
The Cooler Master MM731 is equipped with the PixArt PAW3370. According to specifications, the 3370 is capable of up to 19,000 CPI, as well as a maximum tracking speed of 400 IPS, which equals 10.16 m/s. Through the software, an interpolated maximum CPI of 38,000 can be set. Out of the box, seven pre-defined CPI steps are available: 400, 800, 1200, 1600, 3200, 8000, and 19,000.All testing was done on the latest firmware (2.3.4/1.4.6). As such, results obtained on earlier firmware versions may differ from those presented hereafter.
CPI Accuracy
"CPI" (short for counts per inch) describes the number of counts registered by the mouse if it is moved exactly an inch. There are several factors (firmware, mounting height of the sensor not meeting specifications, mouse feet thickness, mousing surface, among others) which may contribute to nominal CPI not matching actual CPI. It is impossible to always achieve a perfect match, but ideally, nominal and actual CPI should differ as little as possible. In this test, I'm determining whether this is the case or not. However, please keep in mind that said variance will still differ from unit to unit, so your mileage may vary.
I've restricted my testing to the four most common CPI steps, which are 400, 800, 1600, and 3200. As you can see, deviation is consistently positive and fairly significant. An average result overall. In order to account for the measured deviation, adjusted steps of 400, 800, 1500, and 3100 CPI have been used for testing. Curiously, the software only allows for adjustments in increments of 100 even though the sensor would be capable of increments of 50 at and below 10,000 CPI.
Motion Delay
"Motion delay" encompasses all kinds of sensor lag. Any further sources of input delay will not be recorded in this test. The main thing I'll be looking for in this test is sensor smoothing, which describes an averaging of motion data across several capture frames in order to reduce jitter at higher CPI values, increasing motion delay along with it. The goal here is to have as little smoothing as possible. As there is no way to accurately measure motion delay absolutely, it can only be done by comparison with a control subject that has been determined to have the lowest possible motion delay. In this case, the control subject is a G403, whose 3366 has no visible smoothing across the entire CPI range. Note that the G403 is moved first and thus receives a slight head start.Testing is restricted to 2.4 GHz mode as Bluetooth is not suitable for non-casual gaming applications.
Wired Testing
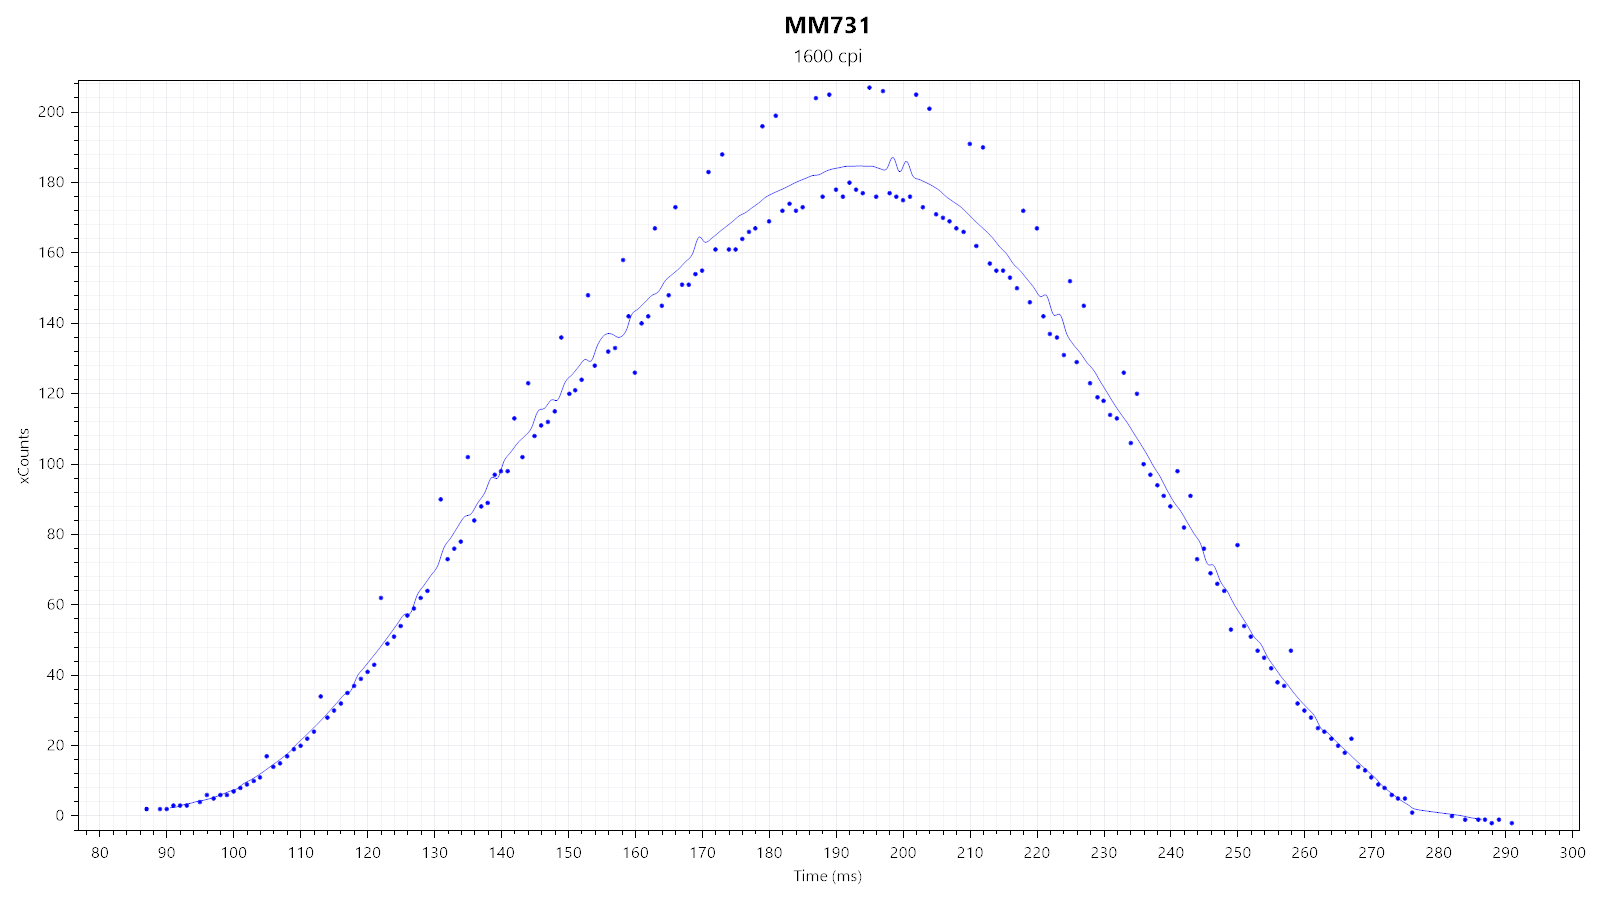

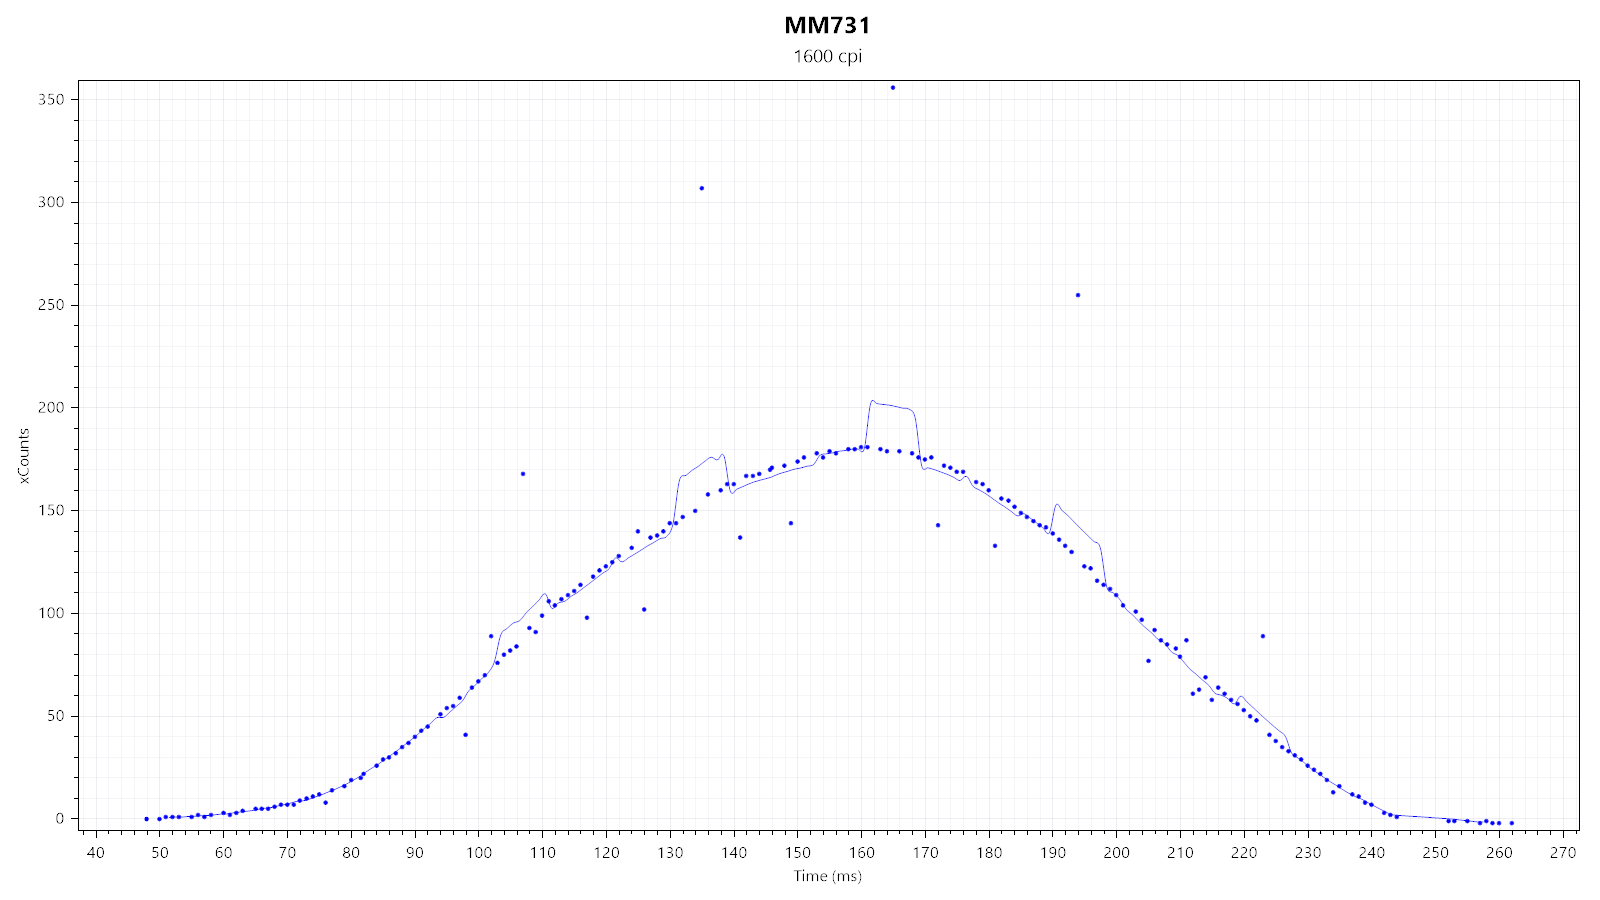
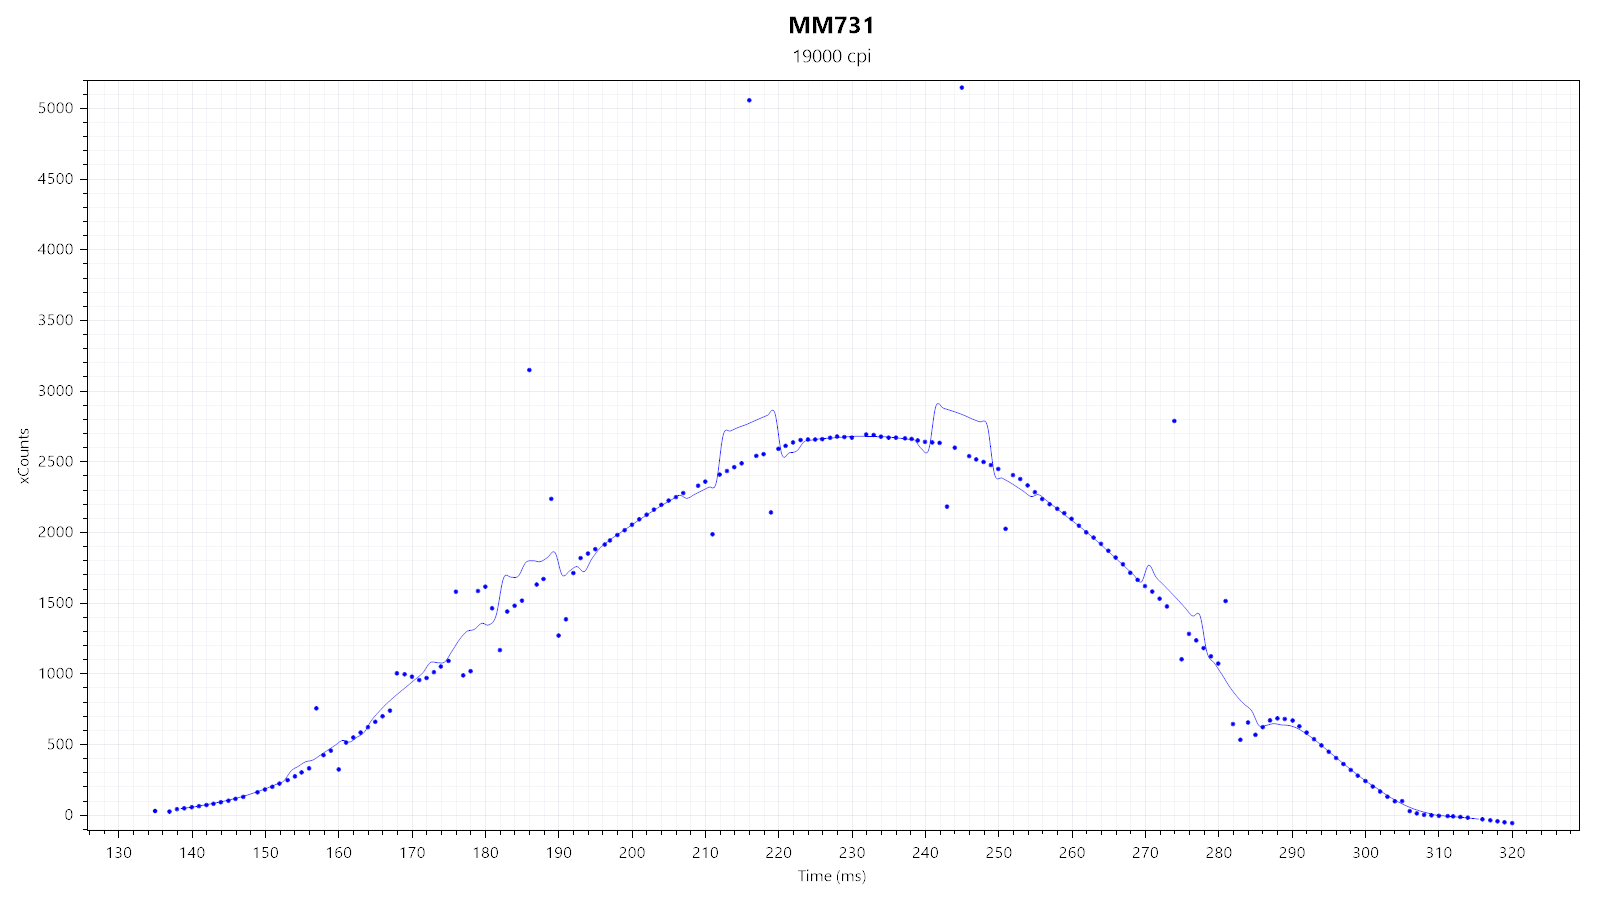
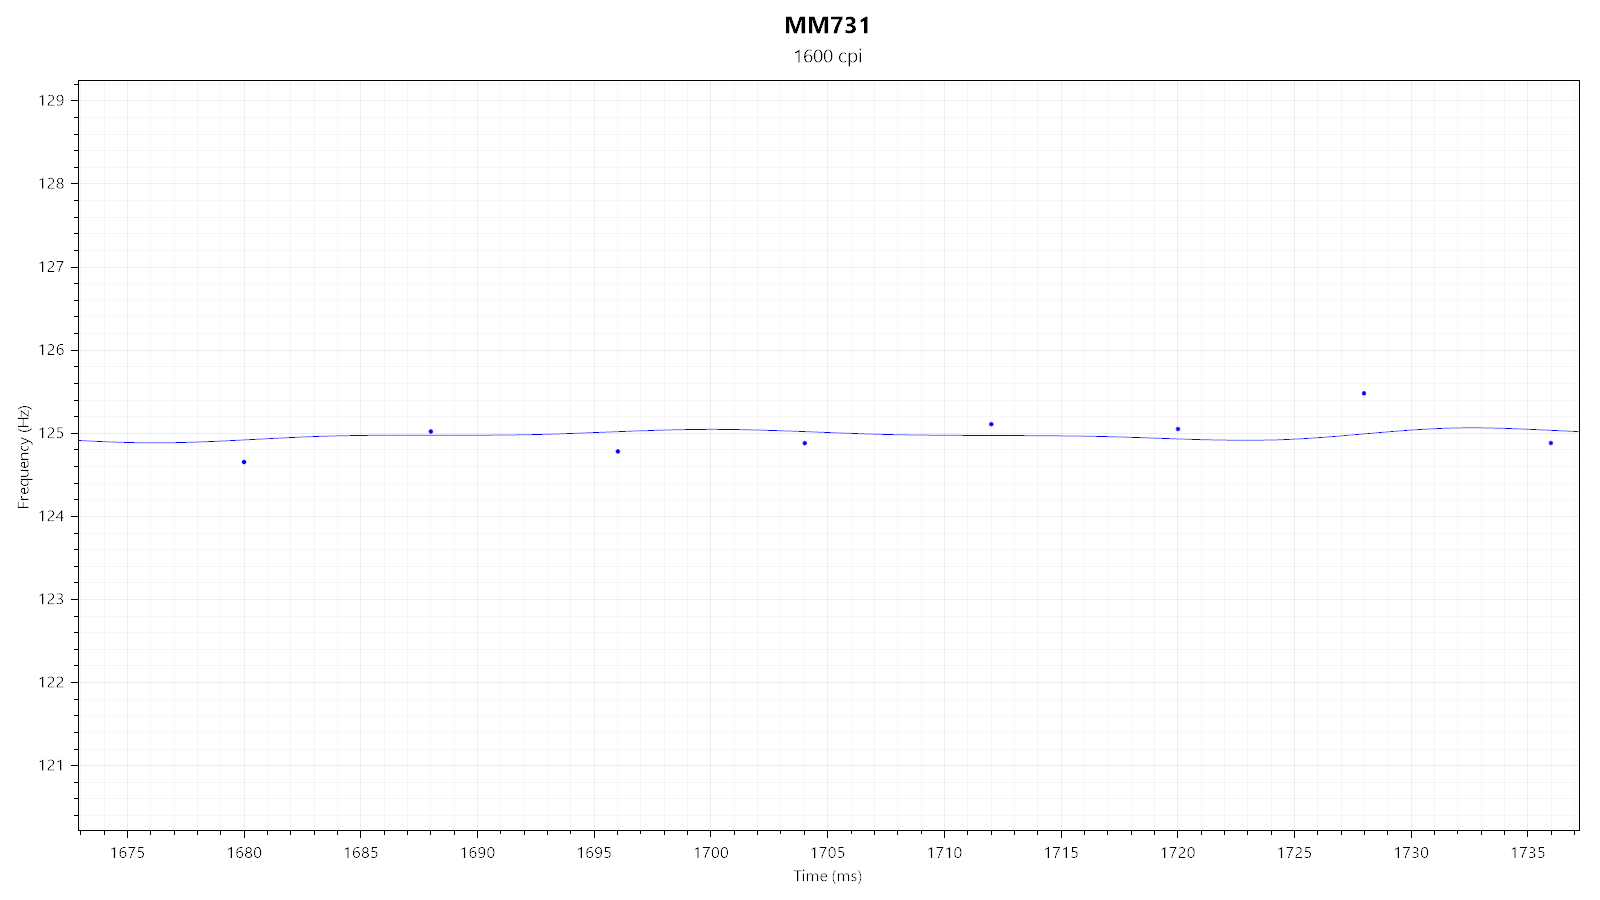
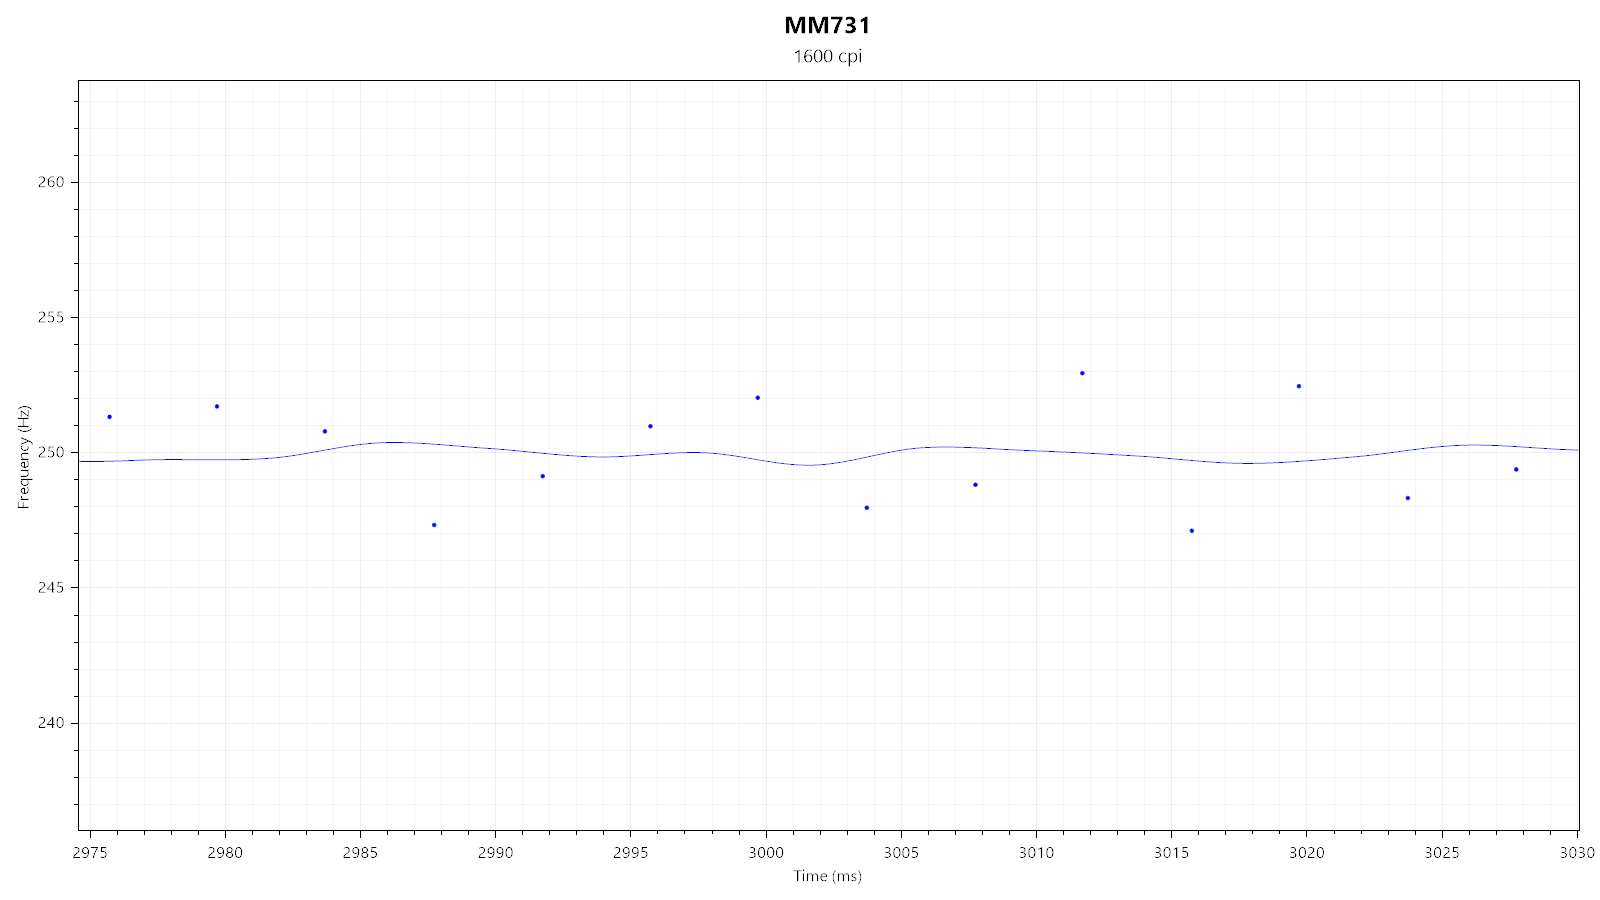
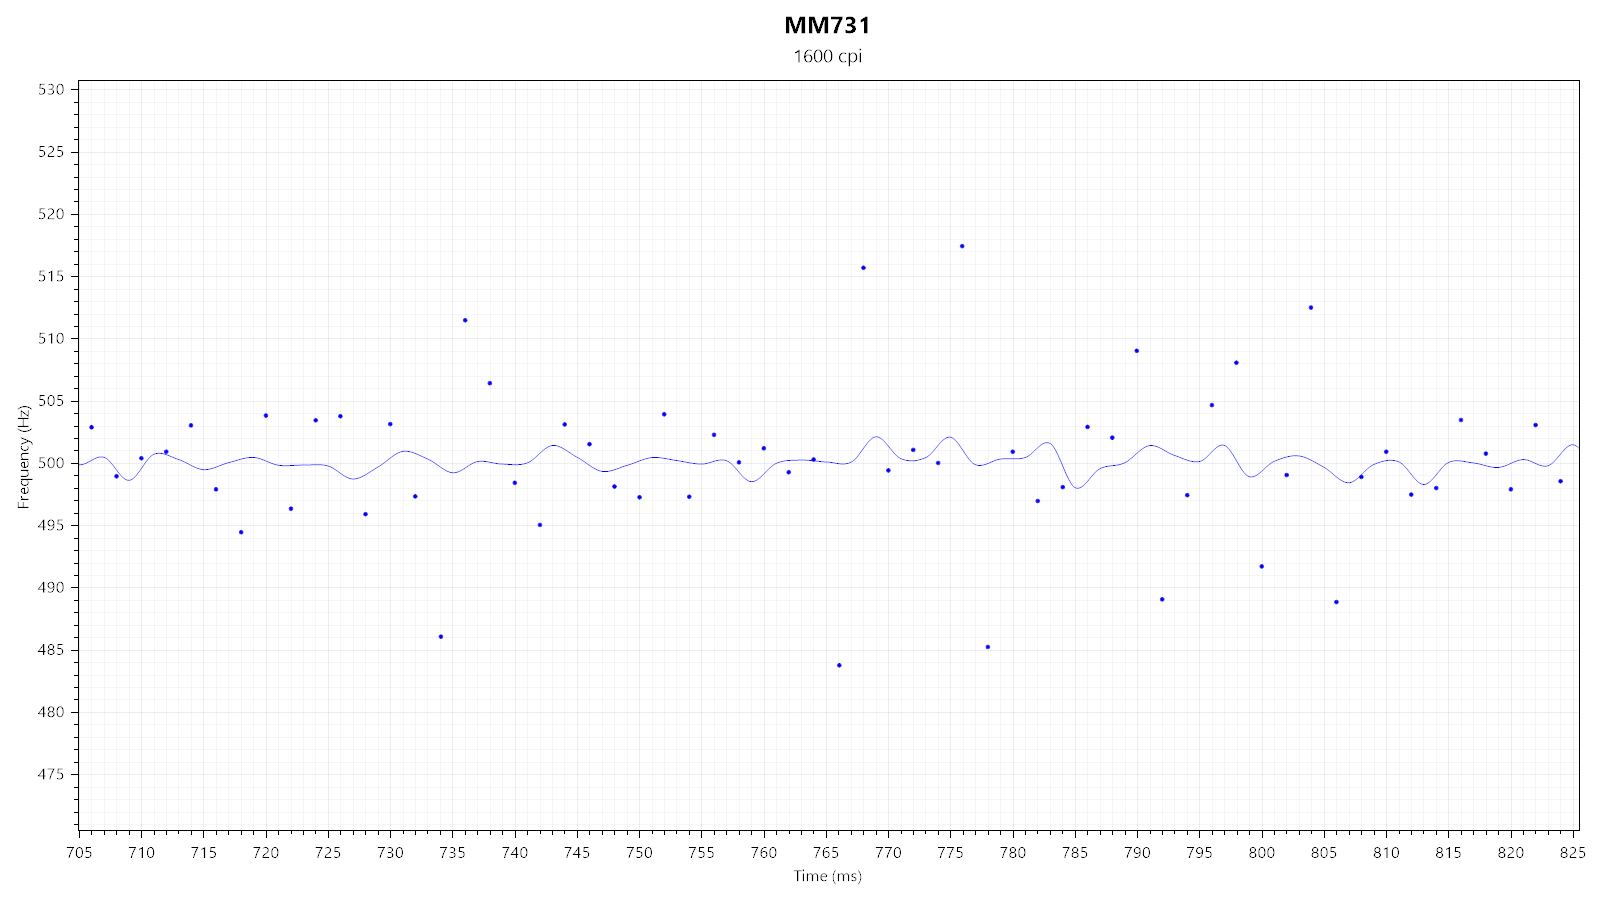
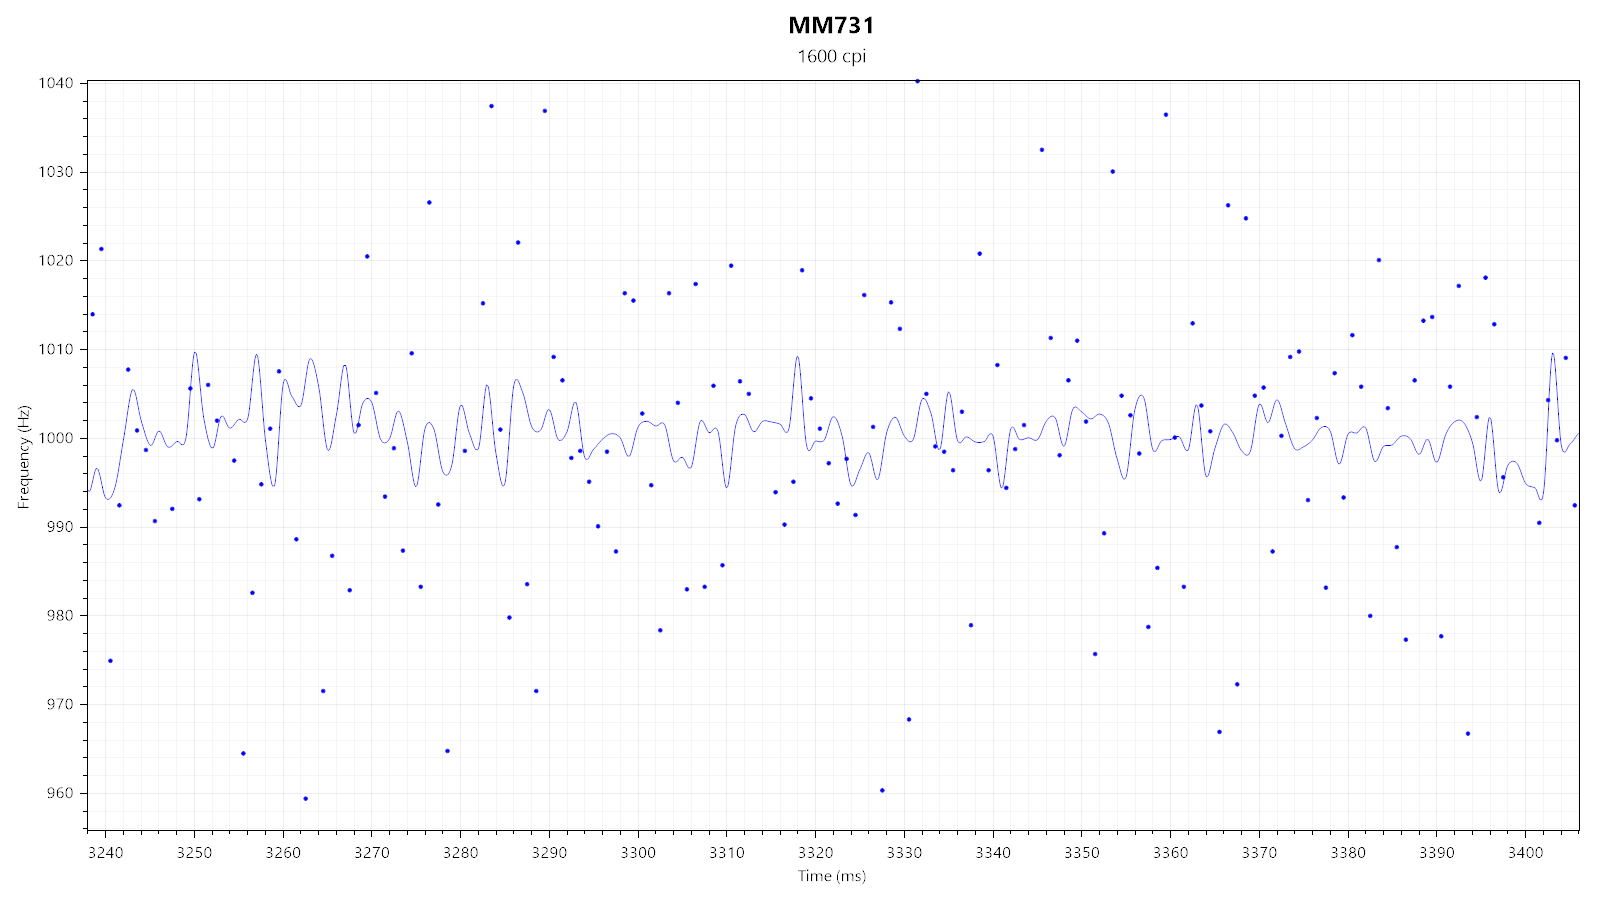
First, I'm looking at two xCounts plots—generated at 1600 and 19,000 CPI—to quickly gauge whether there is any smoothing, which would be indicated by any visible "kinks." As you can see, such kinks are on display in the second plot, which indicates there being smoothing.
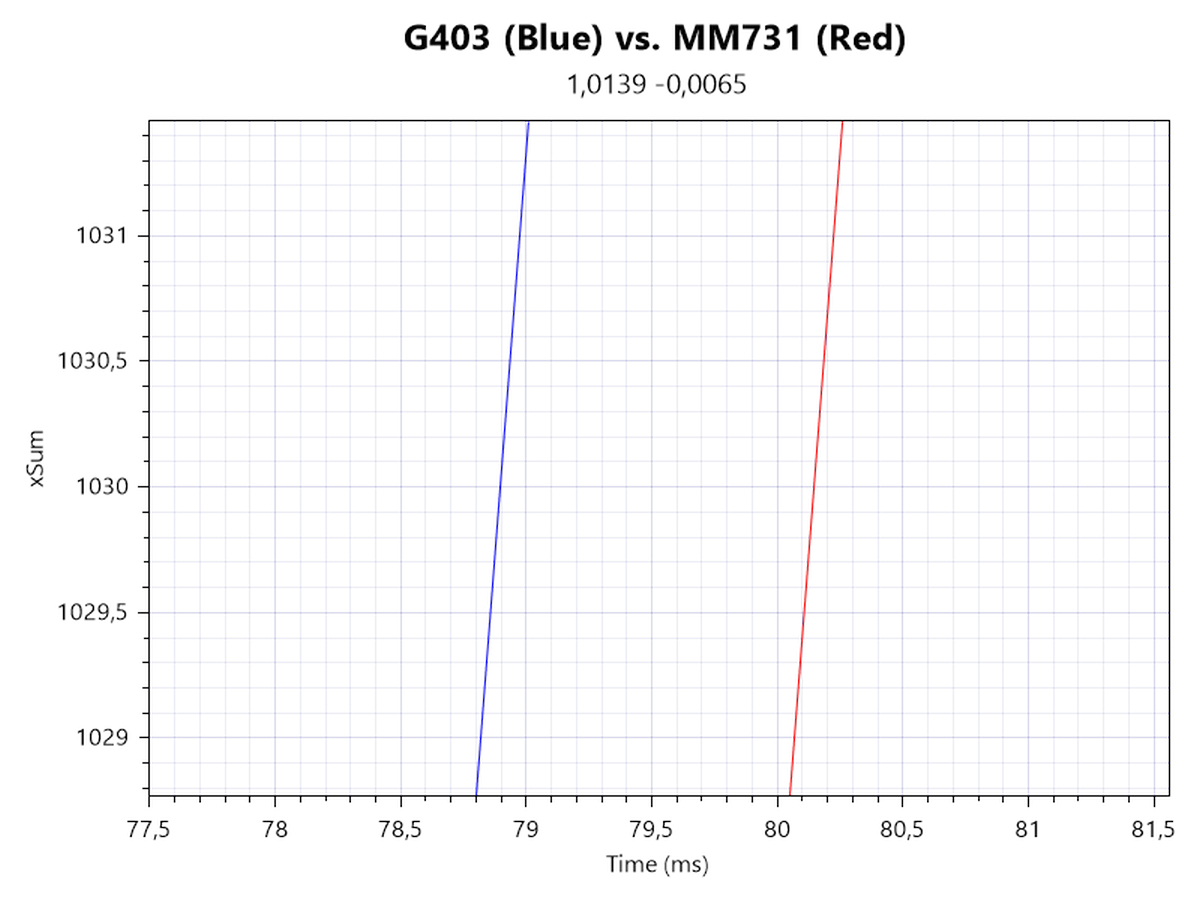
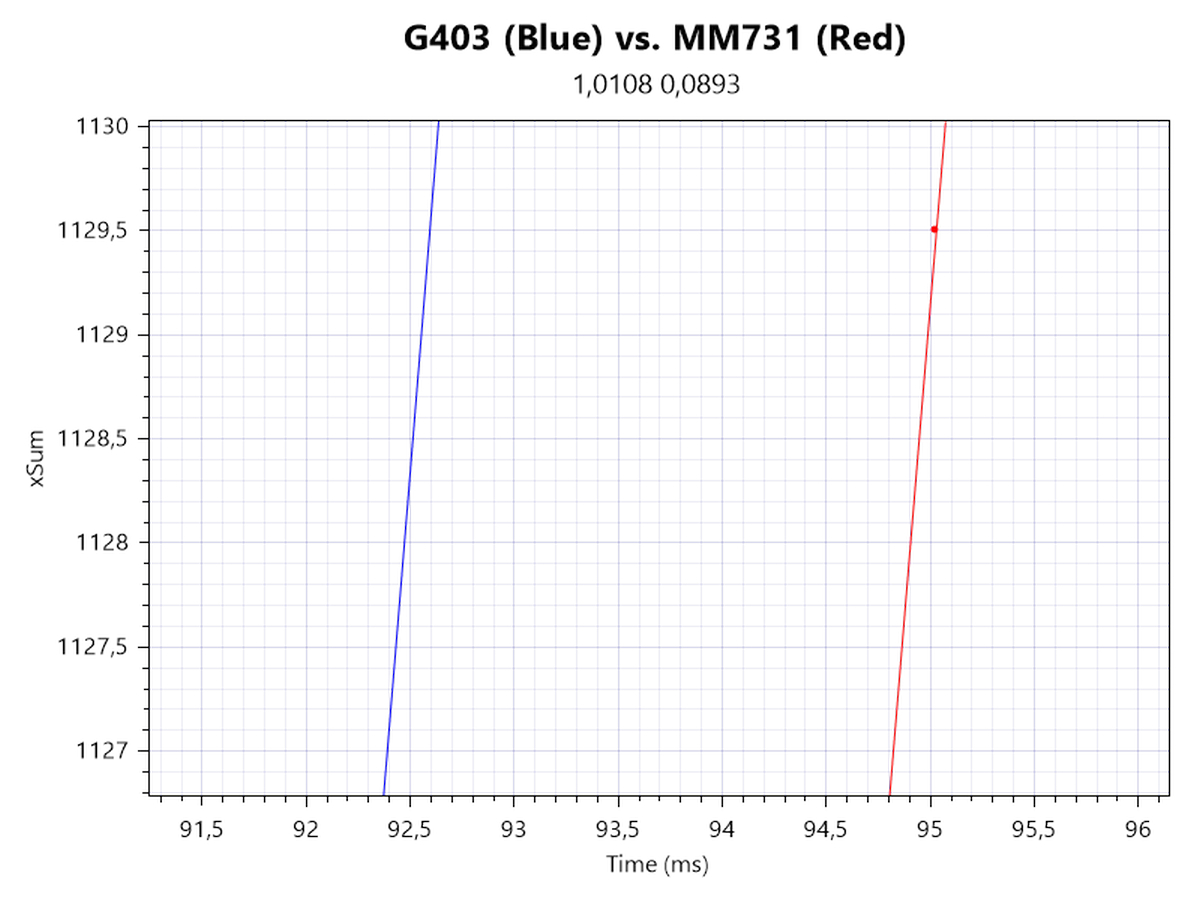
In order to determine motion delay, I'm looking at xSum plots generated at 1600, 6500, and 19,000 CPI. The line further to the left denotes the sensor with less motion delay. At 1600 CPI, I can measure a motion delay differential of roughly 1 ms. Smoothing is first applied at and above 6500 CPI, resulting in a motion delay differential of roughly 3 ms, which holds true all the way until 19,000 CPI. Onset motion delay is marginal to where it may as well not exist.
Wireless Testing
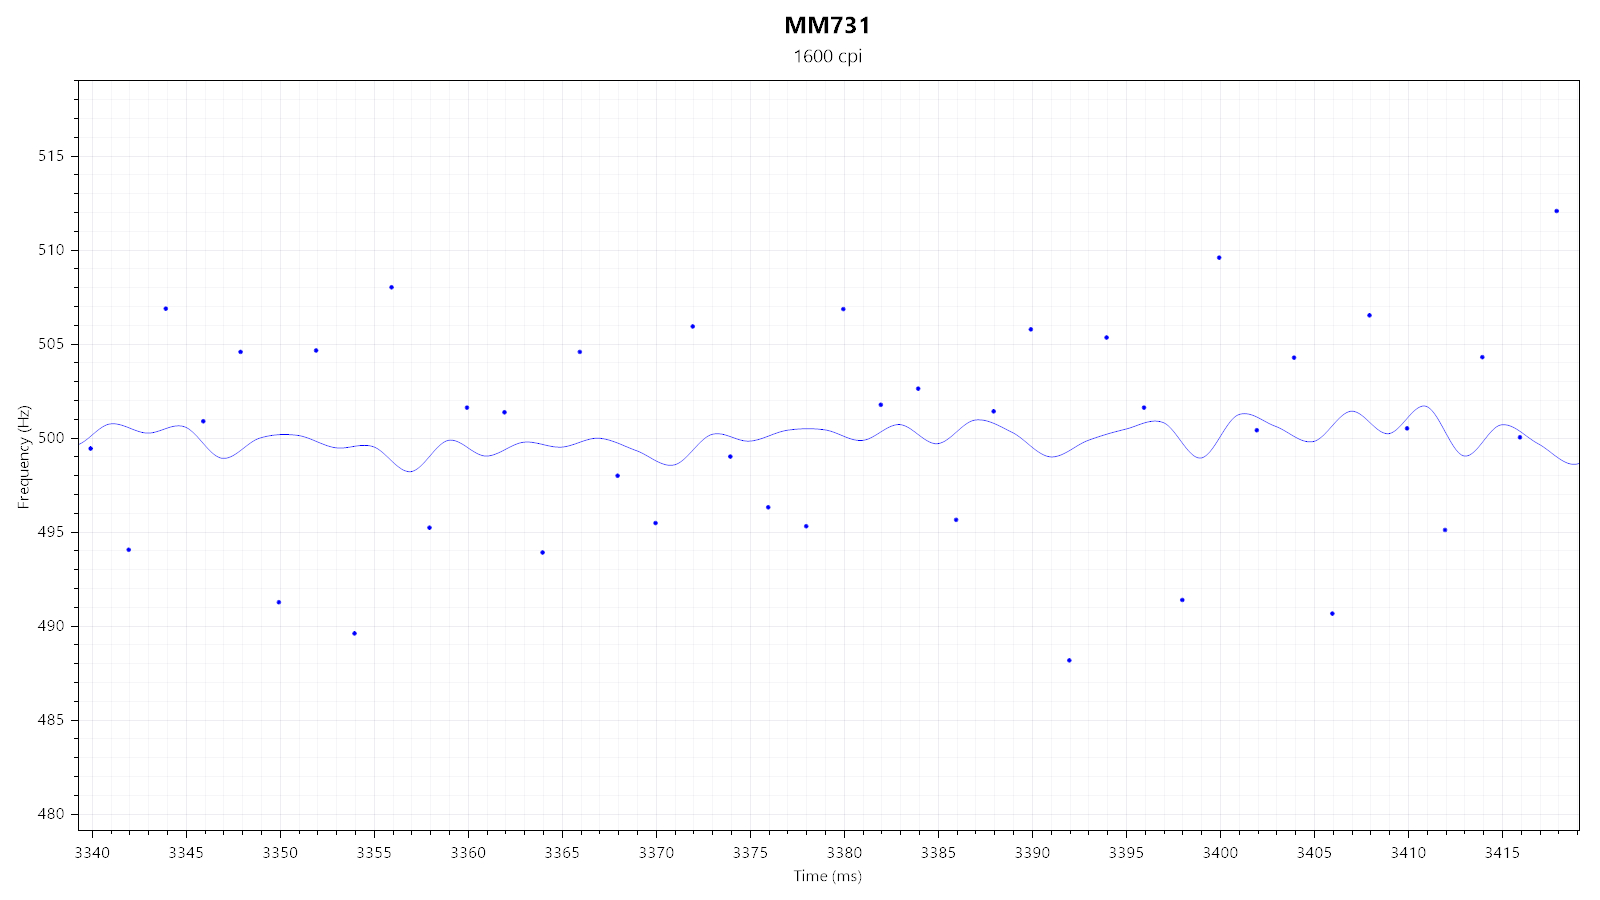
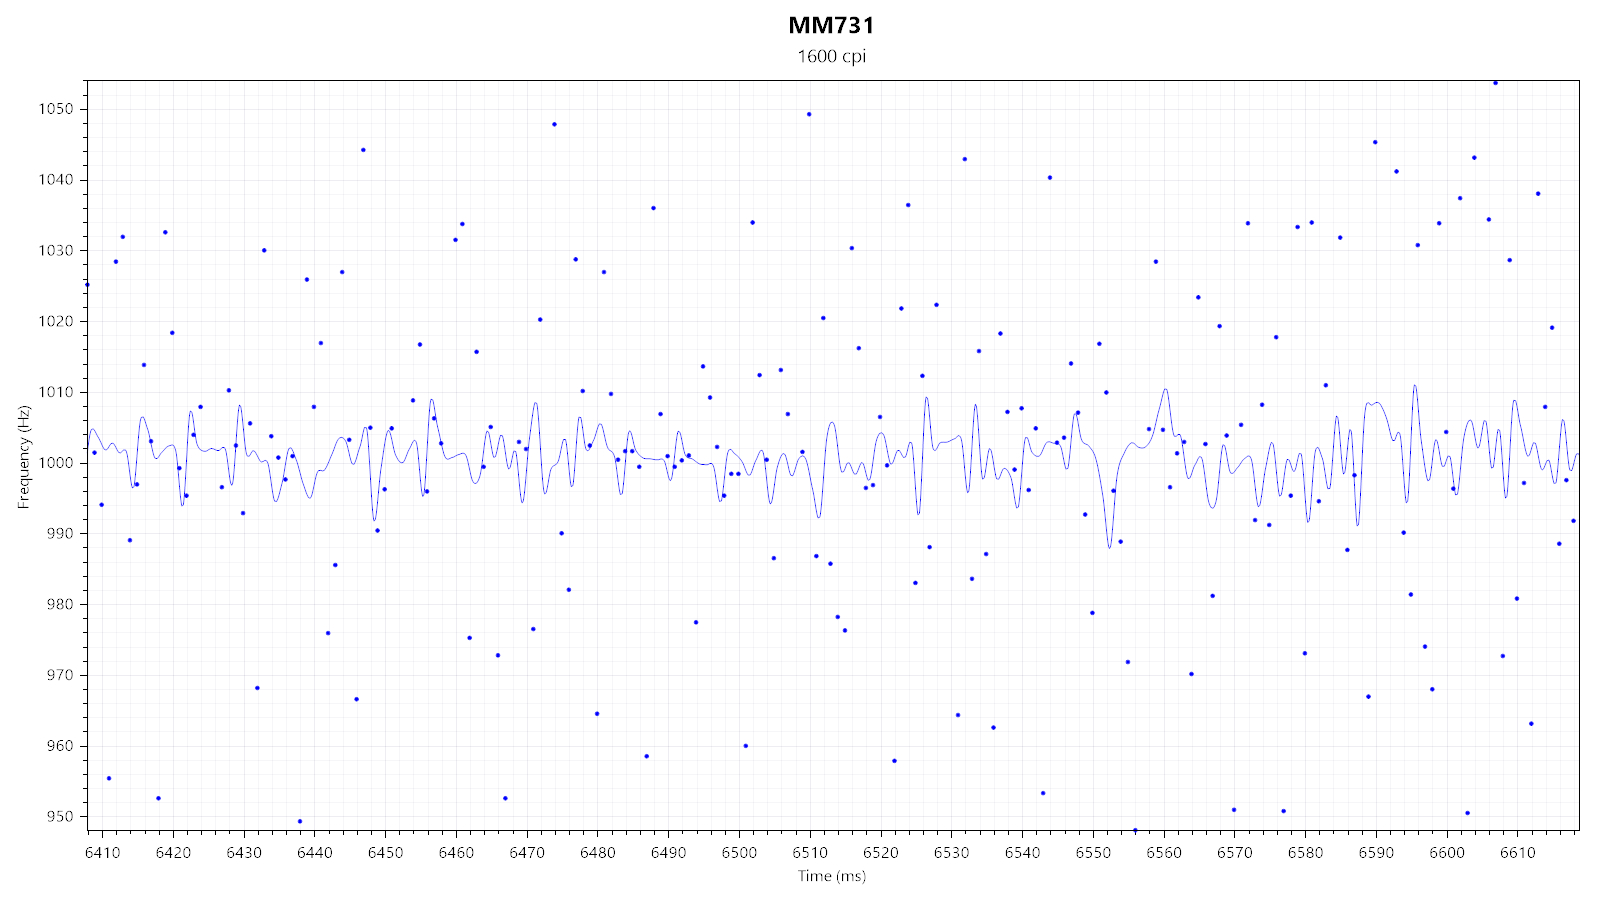
Aside from periodic and possibly polling-related outliers, tracking is largely unaffected by the switch to wireless.
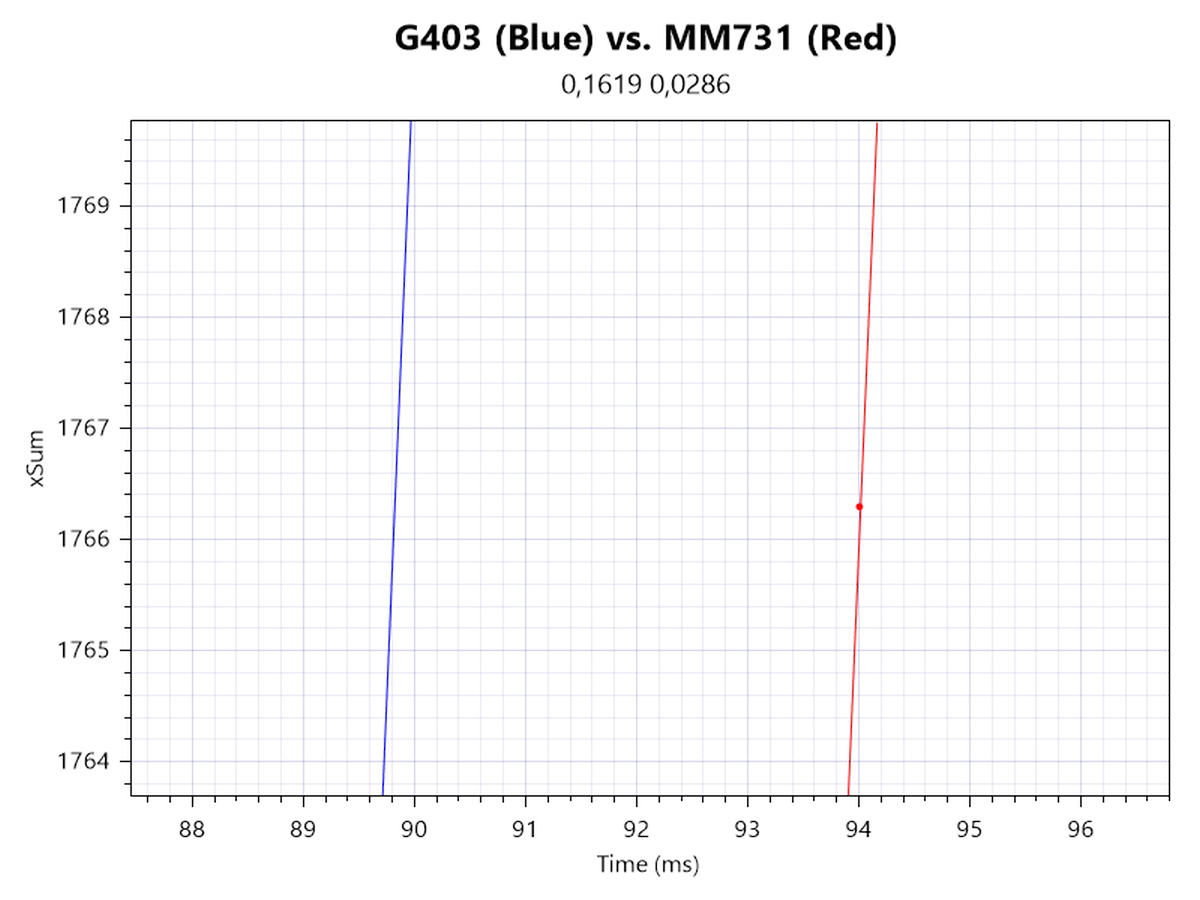
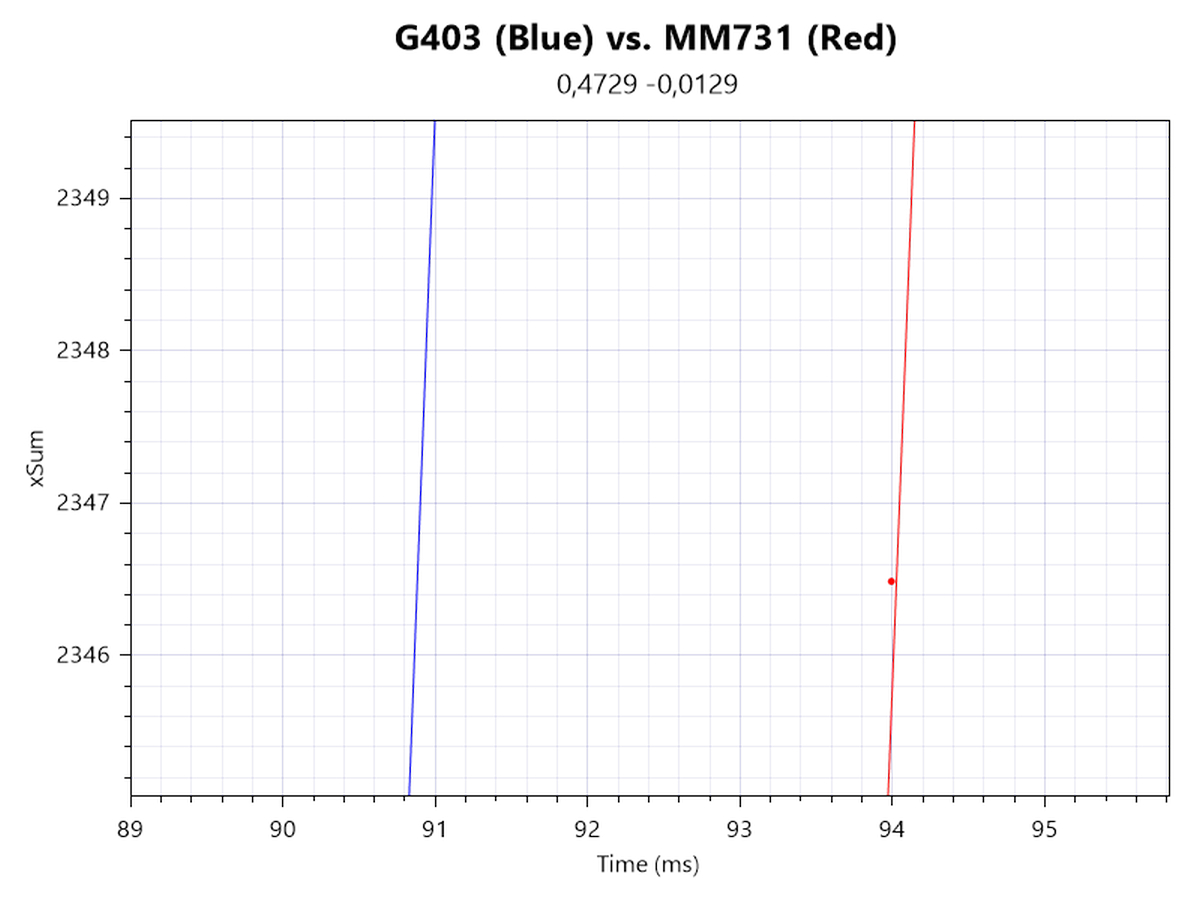
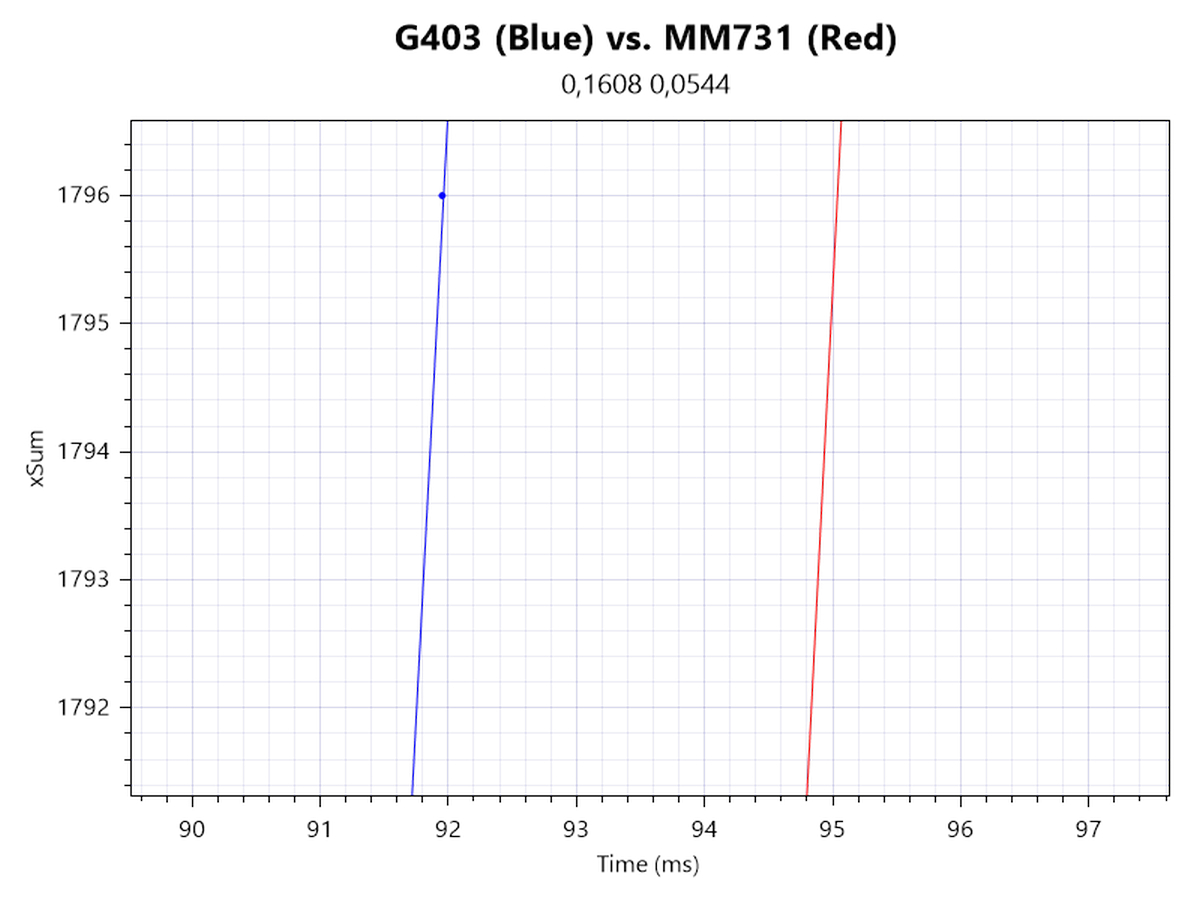
I'm again looking at xSum plots generated at 1600 and 19,000 CPI. Onset motion delay is still kept at a minimum, but the outliers introduce minor delay variance. Keeping that and the wired delay established above in mind, I can measure an isolated motion delay of roughly 1.5 ms. At 1600 CPI, the cumulated motion delay is roughly 2–2.5 ms, whereas at 19,000 CPI, it is roughly 4–4.5 ms.
Speed-related Accuracy Variance (SRAV)
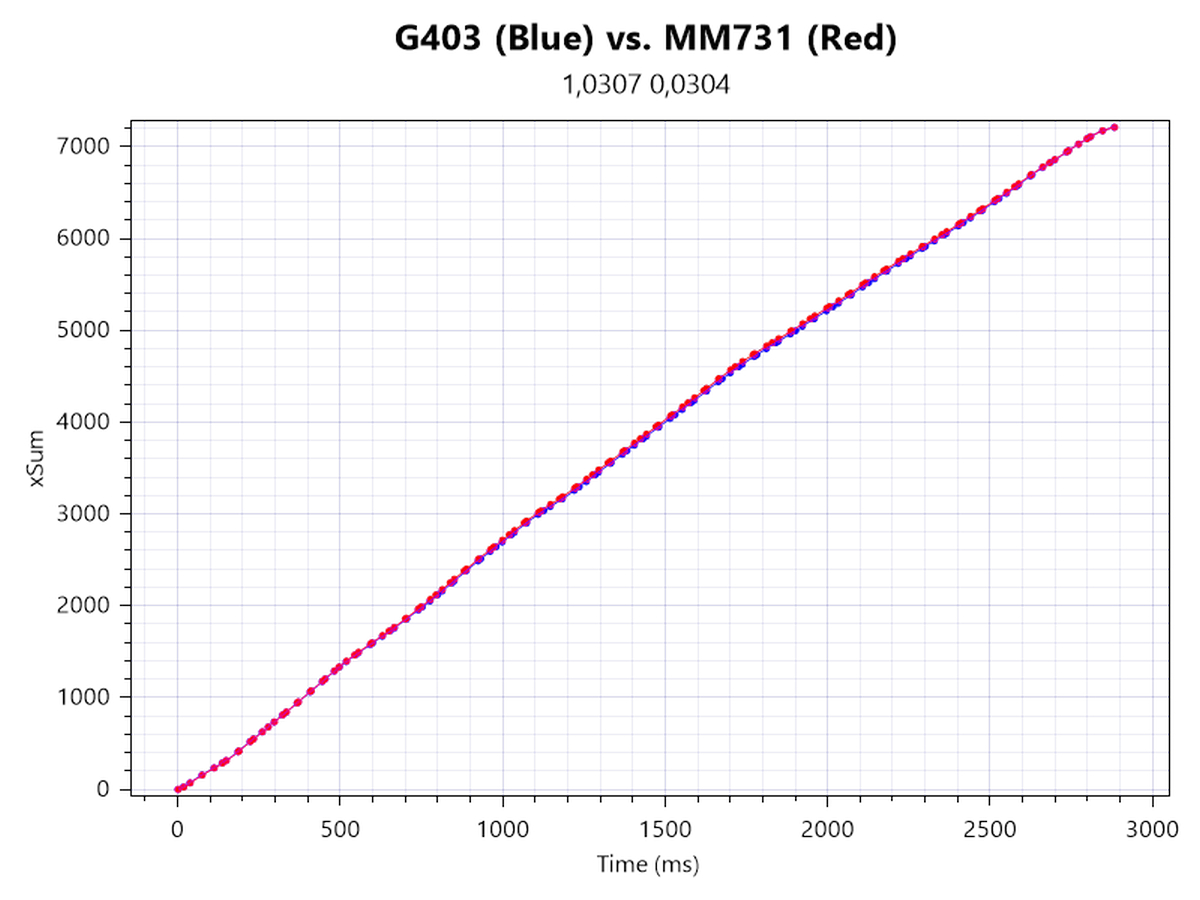
What people typically mean when they talk about "acceleration" is speed-related accuracy variance (or short SRAV). It's not about the mouse having a set amount of inherent positive or negative acceleration, but about the cursor not traveling the same distance if the mouse is moved the same physical distance at different speeds. The easiest way to test this is by comparison with a control subject that is known to have very low SRAV, which in this case is the G403. As you can see from the plot, no displacement between the two cursor paths can be observed, which confirms that SRAV is very low.
Perfect Control Speed
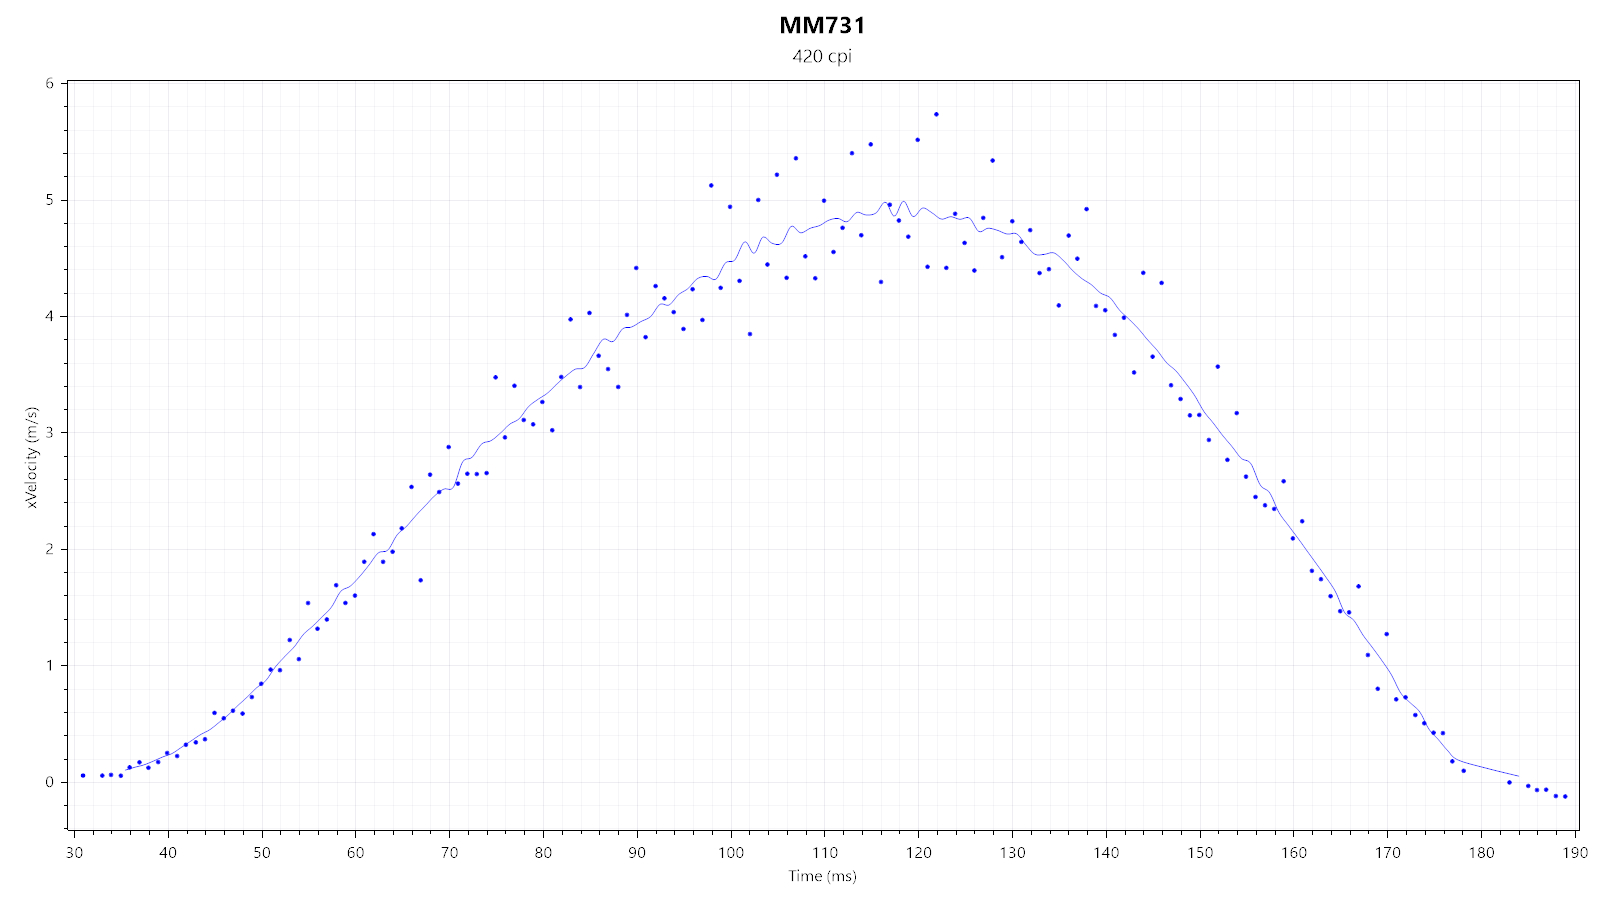
Perfect Control Speed (or PCS for short) is the maximum speed up to which the mouse and its sensor can be moved without the sensor malfunctioning in any way. I've only managed to hit a measly 5 m/s, which is within the proclaimed PCS range and causes no observable sensor malfunction.
Polling Rate Stability
Considering the MM731 is usable as a regular wired mouse as well, I'll be testing polling rate stability for both wired and wireless use.Wired Testing
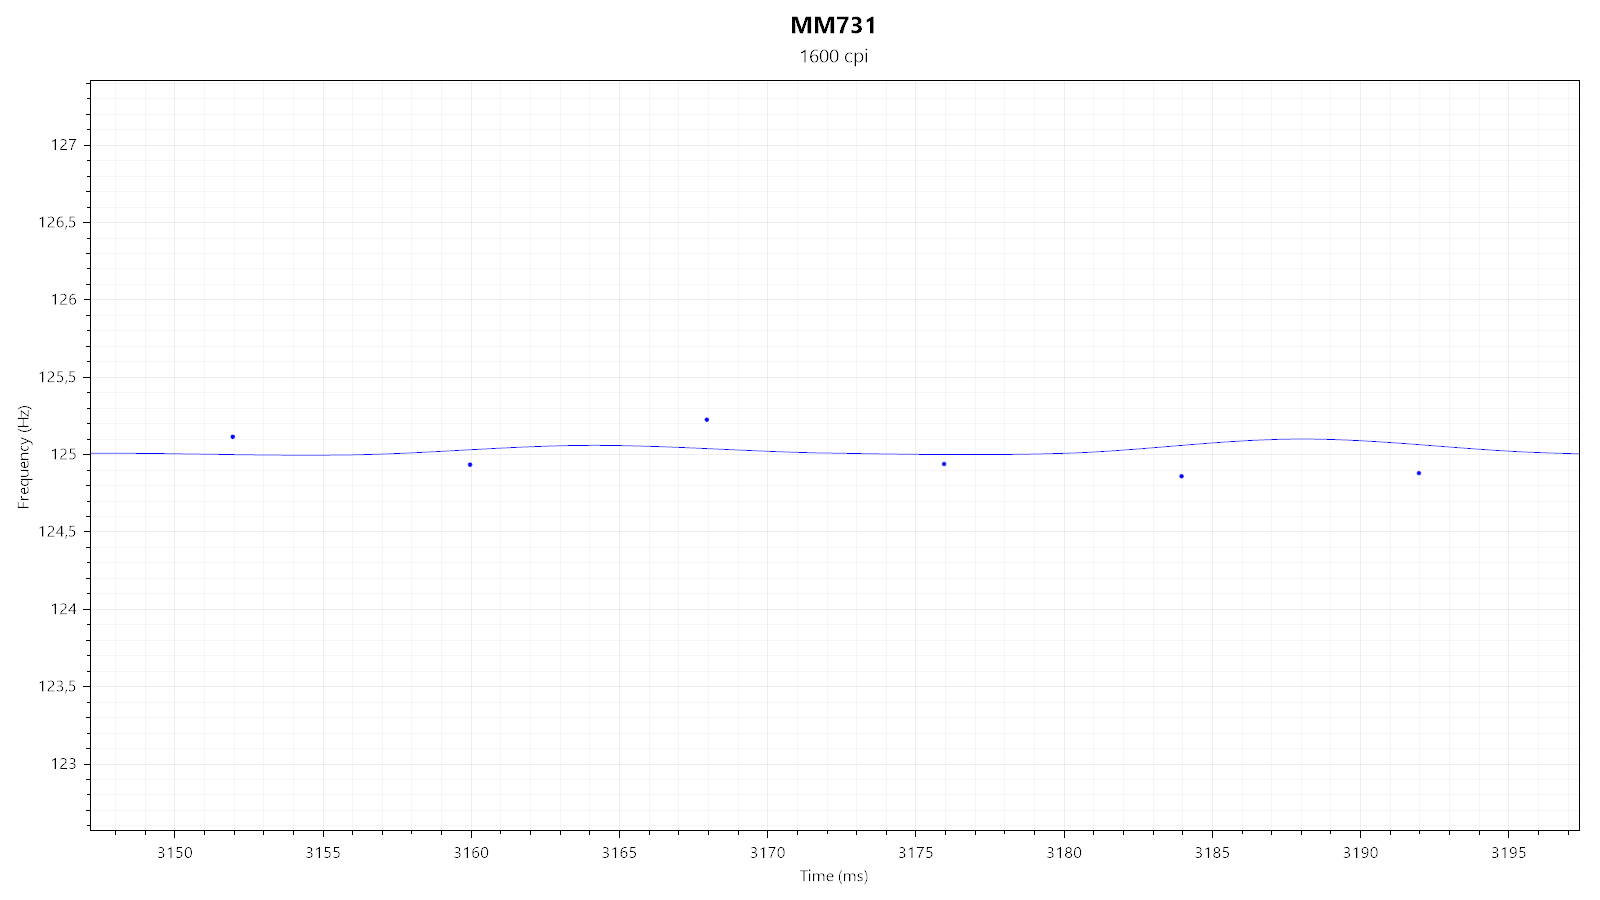
All of the available polling rate settings (125/250/500/1000 Hz) look and perform fine. Polling stability is unaffected by any of the available RGB lighting effects.
Wireless Testing
For wired mice, polling-rate stability merely concerns the wired connection between the mouse (SPI communication) and the USB. For wireless mice, another device that needs to be kept in sync between the first two is added to the mix: the wireless dongle/wireless receiver. I'm unable to measure all stages of the entire end-to-end signal chain individually, so testing polling-rate stability at the endpoint (the USB) has to suffice here.
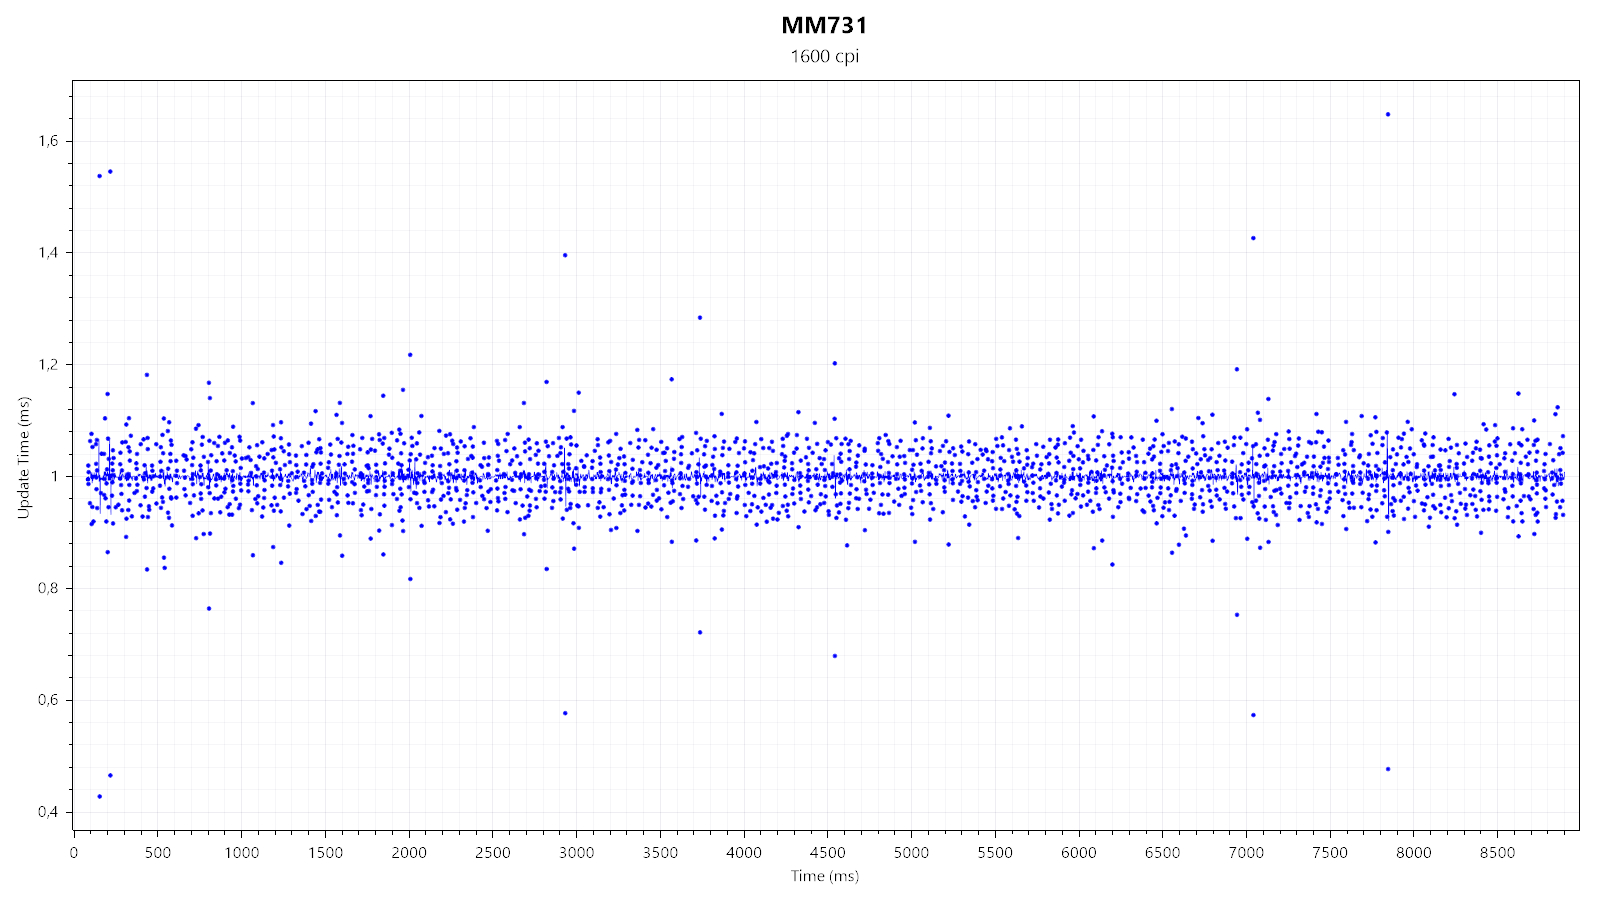
First, I'm testing whether SPI, wireless, and USB communication are synchronized. Any of these being out of sync would be indicated by at least one 2 ms report, which would be the result of any desynchronization drift accumulated over time. While several outliers are visible, they do not show up periodically, which leads me to believe they are not caused by a desynchronization drift.
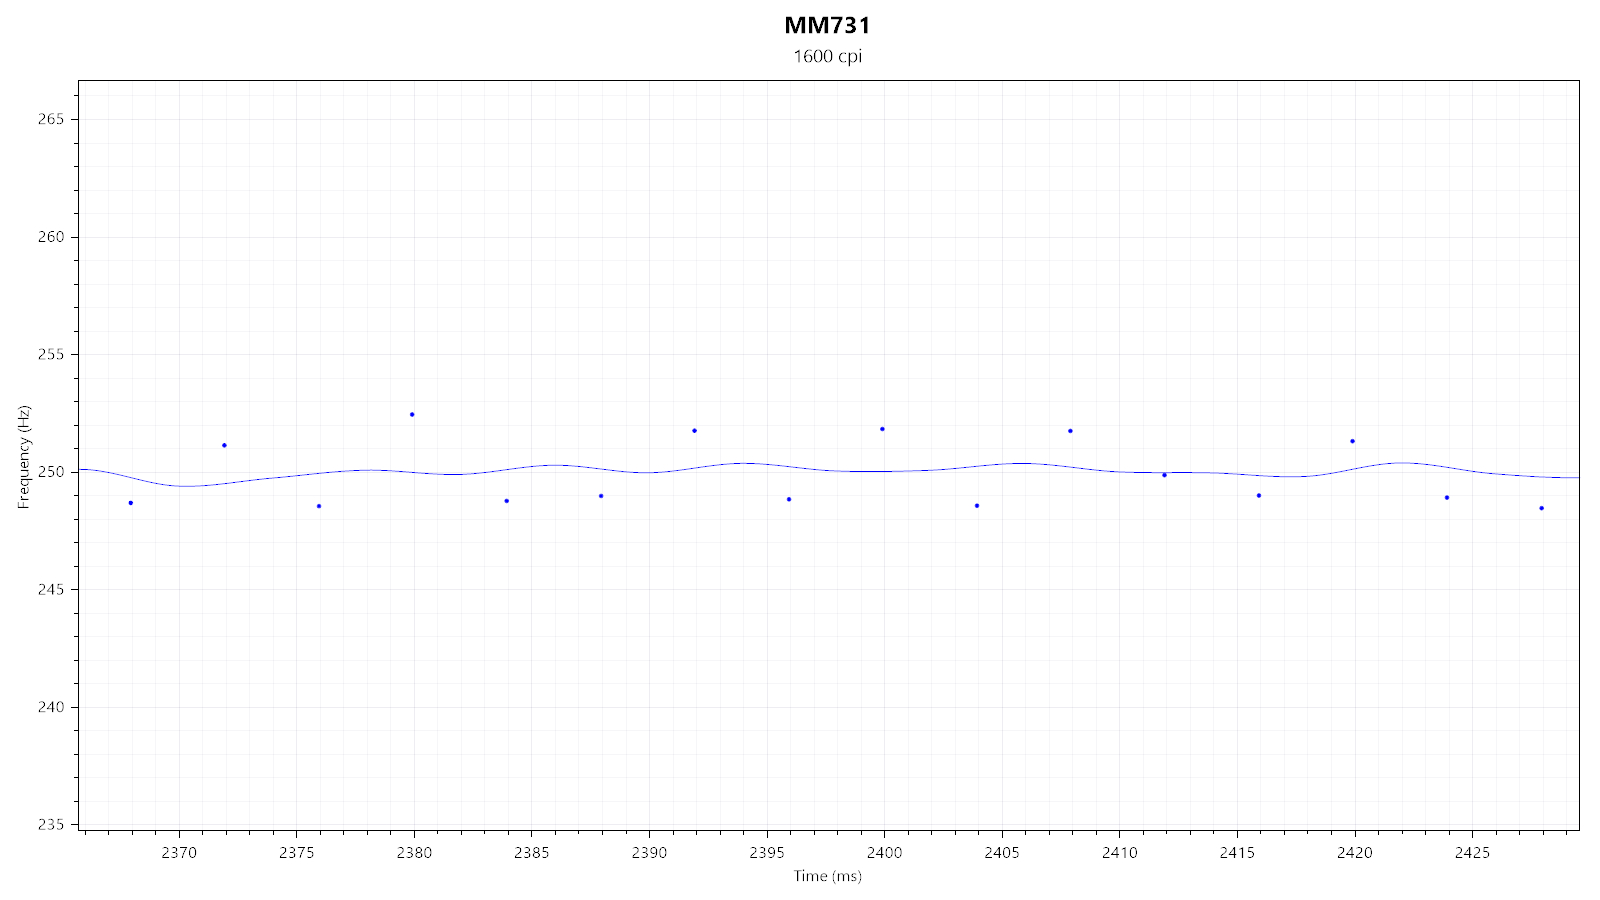
Second, I'm testing the general polling-rate stability of the individual polling rates in wireless mode. Running the MM731 at a lower polling rate can have the benefit of extending battery life. Aside from occasional outliers, all available polling rates are stable.
Paint Test
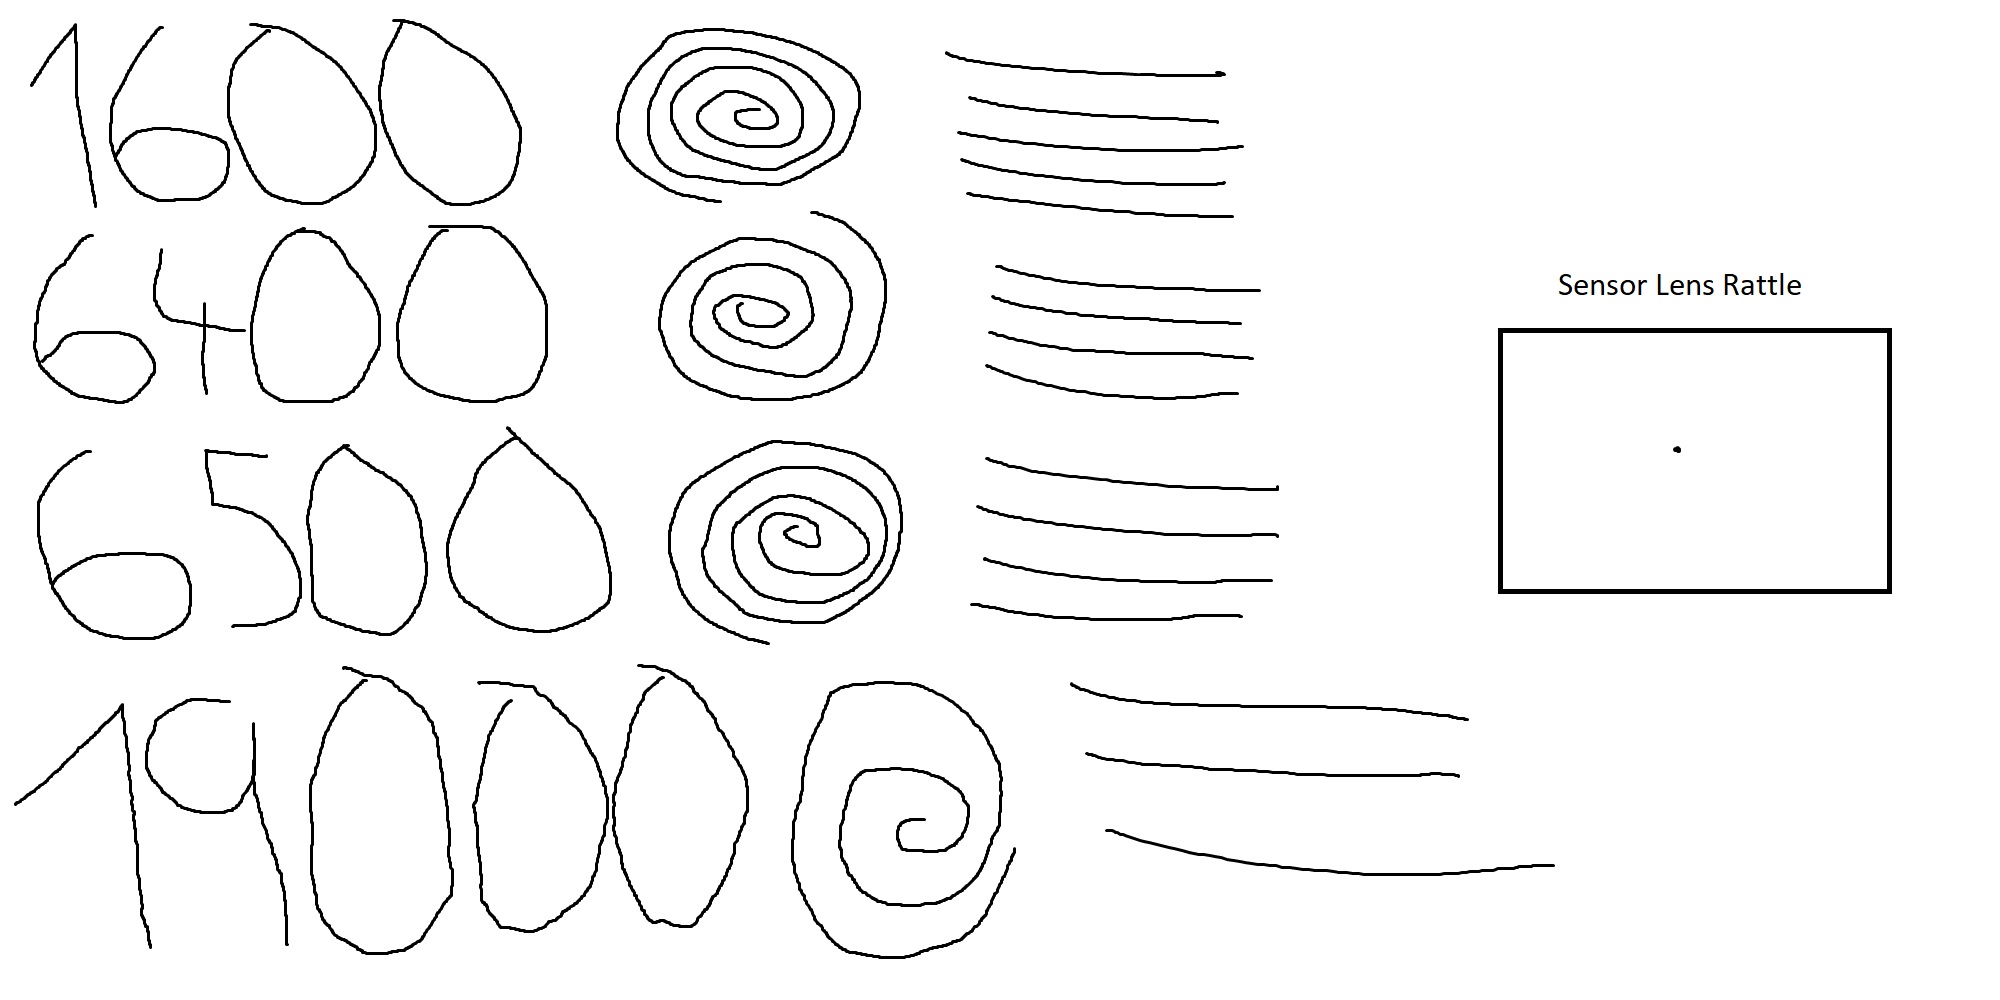
This test is used to indicate any potential issues with angle snapping (non-native straightening of linear motion) and jitter, along with any sensor lens rattle. As you can see, no issues with angle snapping can be observed. No jitter is visible at 1600 CPI. The little jitter visible at 6400 CPI is taken care of at 6500 CPI, where smoothing is first applied. 19,000 CPI shows significant jitter regardless. Lastly, there is minor lens movement.
Lift-off Distance
The MM731 offers two pre-defined LOD levels to choose from. Using the "Low" preset, the sensor does not track at a height of 1 DVD (<1.2 mm). Using the "High" setting, the sensor does track at a height of 1 DVD, but not at a height of 2 DVDs (1.2 mm<x<2.4 mm, x being LOD). Keep in mind that LOD may vary slightly depending on the mousing surface (pad) it is being used on.Click Latency

Most gaming mice use mechanical switches for their buttons. By wiring the switches of the test subject together with the switches of a control subject, I'm able to measure click latency very accurately; i.e., standard error of around 0.05 ms. However, this method is not applicable to mice with non-mechanical switches and wireless-only mice in general. As such, other methods ought to be employed, one of which is NVIDIA's Latency Display Analysis Tool (LDAT). The LDAT allows me to measure the entire end-to-end latency between the mouse click and photon transition on the monitor. By establishing the relative difference to a control subject, I'm able to provide values I consider sufficiently accurate; i.e., standard error of around 0.2 ms. Many thanks go to NVIDIA for providing me an LDAT v2 device.
Using a button response time of 1 ms, click latency has been measured to be roughly +3.7 ms when compared to the Razer Viper 8K, which is considered as the baseline with 0 ms. Standard deviation is 2.5 ms, but since the indicated value is neither the absolute click latency nor the measured end-to-end latency, standard deviation ends up looking disproportionally large. With button response set to 6 ms, click latency has been measured to be +8.7 ms, with standard deviation being 2.4 ms. Comparison data comes from my own testing and has been exclusively gathered with the LDAT.
Jul 15th, 2025 16:33 CDT
change timezone
Latest GPU Drivers
New Forum Posts
- No offense, here are some things that bother me about your understanding of fans. (145)
- Stupid things one has done with hardware (65)
- RTX 5070 discussion (11)
- I would give anything for Valve's Steam to have an option to disable the Big Picture Mode button. How many times have I accidently clicked it, fml (52)
- Choosing the right motherboard (6)
- Solidigm NVMe Custom Modded Driver for All NVMe Brands SSDs & Any NVMe SSDs (229)
- Recommend me a decent budget card :) (33)
- What's your latest tech purchase? (24278)
- TOS 6 on Ugreen NAS (0)
- Folding Pie and Milestones!! (9620)
Popular Reviews
- MSI GeForce RTX 5060 Gaming OC Review
- Our Visit to the Hunter Super Computer
- Lexar NM1090 Pro 4 TB Review
- SilverStone SETA H2 Review
- NVIDIA GeForce RTX 5050 8 GB Review
- Fractal Design Epoch RGB TG Review
- Sapphire Radeon RX 9060 XT Pulse OC 16 GB Review - An Excellent Choice
- AMD Ryzen 7 9800X3D Review - The Best Gaming Processor
- Upcoming Hardware Launches 2025 (Updated May 2025)
- Corsair FRAME 5000D RS Review
TPU on YouTube
Controversial News Posts
- Intel's Core Ultra 7 265K and 265KF CPUs Dip Below $250 (288)
- Some Intel Nova Lake CPUs Rumored to Challenge AMD's 3D V-Cache in Desktop Gaming (140)
- AMD Radeon RX 9070 XT Gains 9% Performance at 1440p with Latest Driver, Beats RTX 5070 Ti (131)
- NVIDIA Launches GeForce RTX 5050 for Desktops and Laptops, Starts at $249 (122)
- NVIDIA GeForce RTX 5080 SUPER Could Feature 24 GB Memory, Increased Power Limits (115)
- Microsoft Partners with AMD for Next-gen Xbox Hardware (105)
- Intel "Nova Lake‑S" Series: Seven SKUs, Up to 52 Cores and 150 W TDP (100)
- NVIDIA DLSS Transformer Cuts VRAM Usage by 20% (99)