 10
10
Corsair M65 RGB Ultra Review
Testing 8000 Hz »Sensor and Performance
The Corsair M65 RGB Ultra is equipped with the Marksman sensor, whose designation is PixArt PAW3393-T4QU, and which I believe to be based on the PAW3399. According to specifications, the Marksman is capable of up to 26,000 CPI, as well as a maximum tracking speed of 650 IPS, which equals 16.51 m/s. Out of the box, five pre-defined CPI steps are available: 400, 800, 1200, 1600, and 3000.All testing was done on the latest firmware (1.16.41). As such, results obtained on earlier firmware versions may differ from those presented hereafter.
CPI Accuracy
"CPI" (short for counts per inch) describes the number of counts registered by the mouse if it is moved exactly an inch. There are several factors (firmware, mounting height of the sensor not meeting specifications, mouse feet thickness, mousing surface, among others) which may contribute to nominal CPI not matching actual CPI. It is impossible to always achieve a perfect match, but ideally, nominal and actual CPI should differ as little as possible. In this test, I'm determining whether this is the case or not. However, please keep in mind that said variance will still differ from unit to unit, so your mileage may vary.
I've restricted my testing to the four most common CPI steps, which are 400, 800, 1600, and 3200. As you can see, deviation is exclusively positive and very low, which is a very good result overall.
Motion Delay
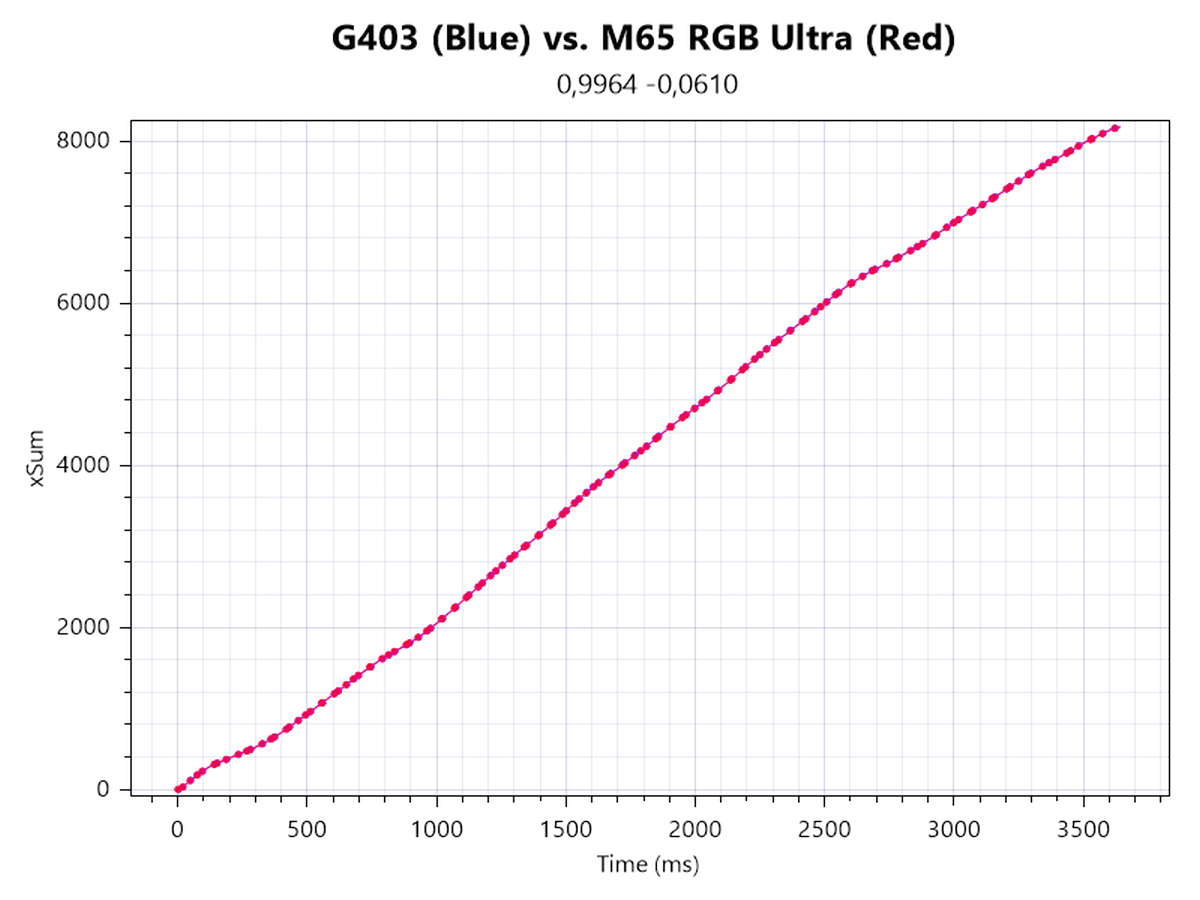
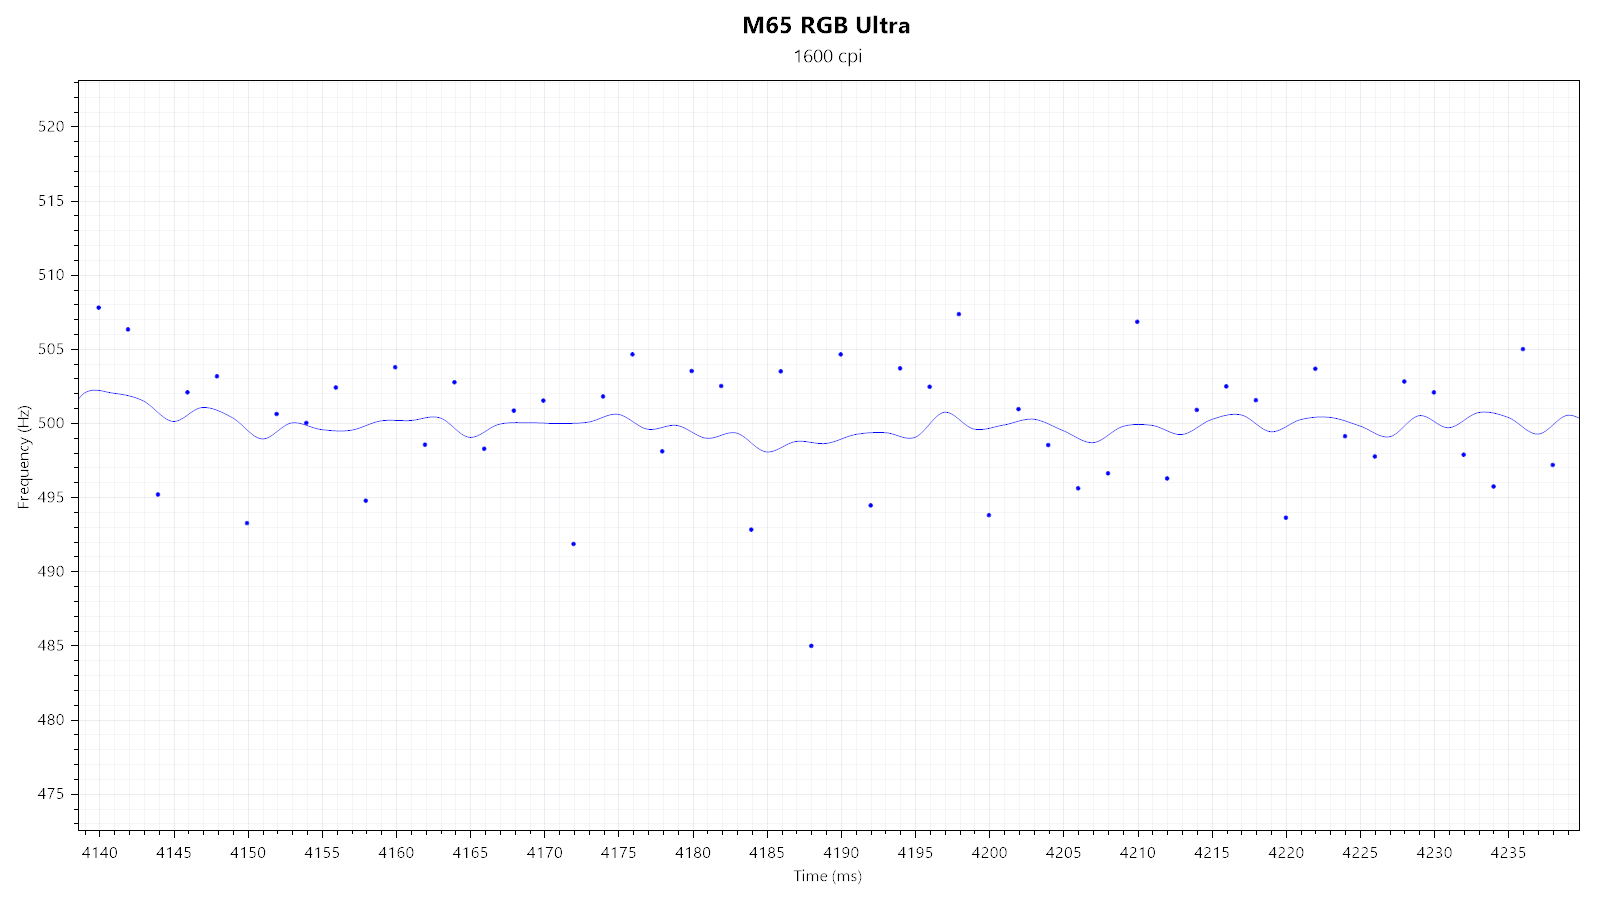
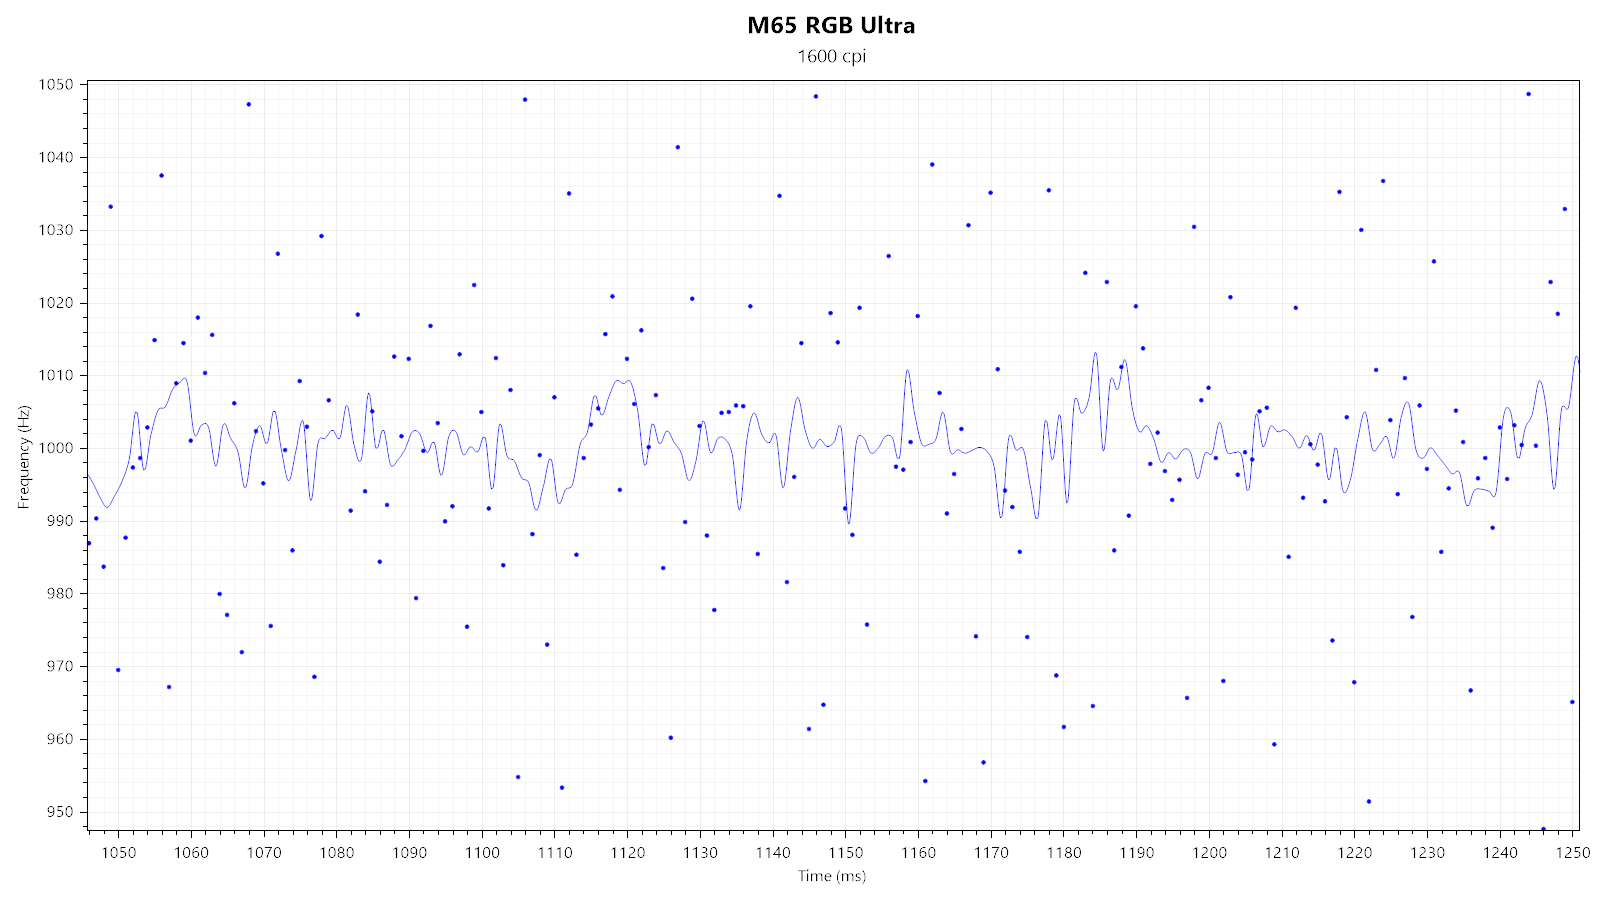
"Motion delay" encompasses all kinds of sensor lag. Any further sources of input delay will not be recorded in this test. The main thing I'll be looking for in this test is sensor smoothing, which describes an averaging of motion data across several capture frames in order to reduce jitter at higher CPI values, increasing motion delay along with it. The goal here is to have as little smoothing as possible. As there is no way to accurately measure motion delay absolutely, it can only be done by comparison with a control subject that has been determined to have among the lowest possible motion delay. In this case, the control subject is a G403, whose PMW3366 has no visible smoothing across the entire CPI range. Note that the M65 RGB Ultra is moved first and thus receives a slight head start.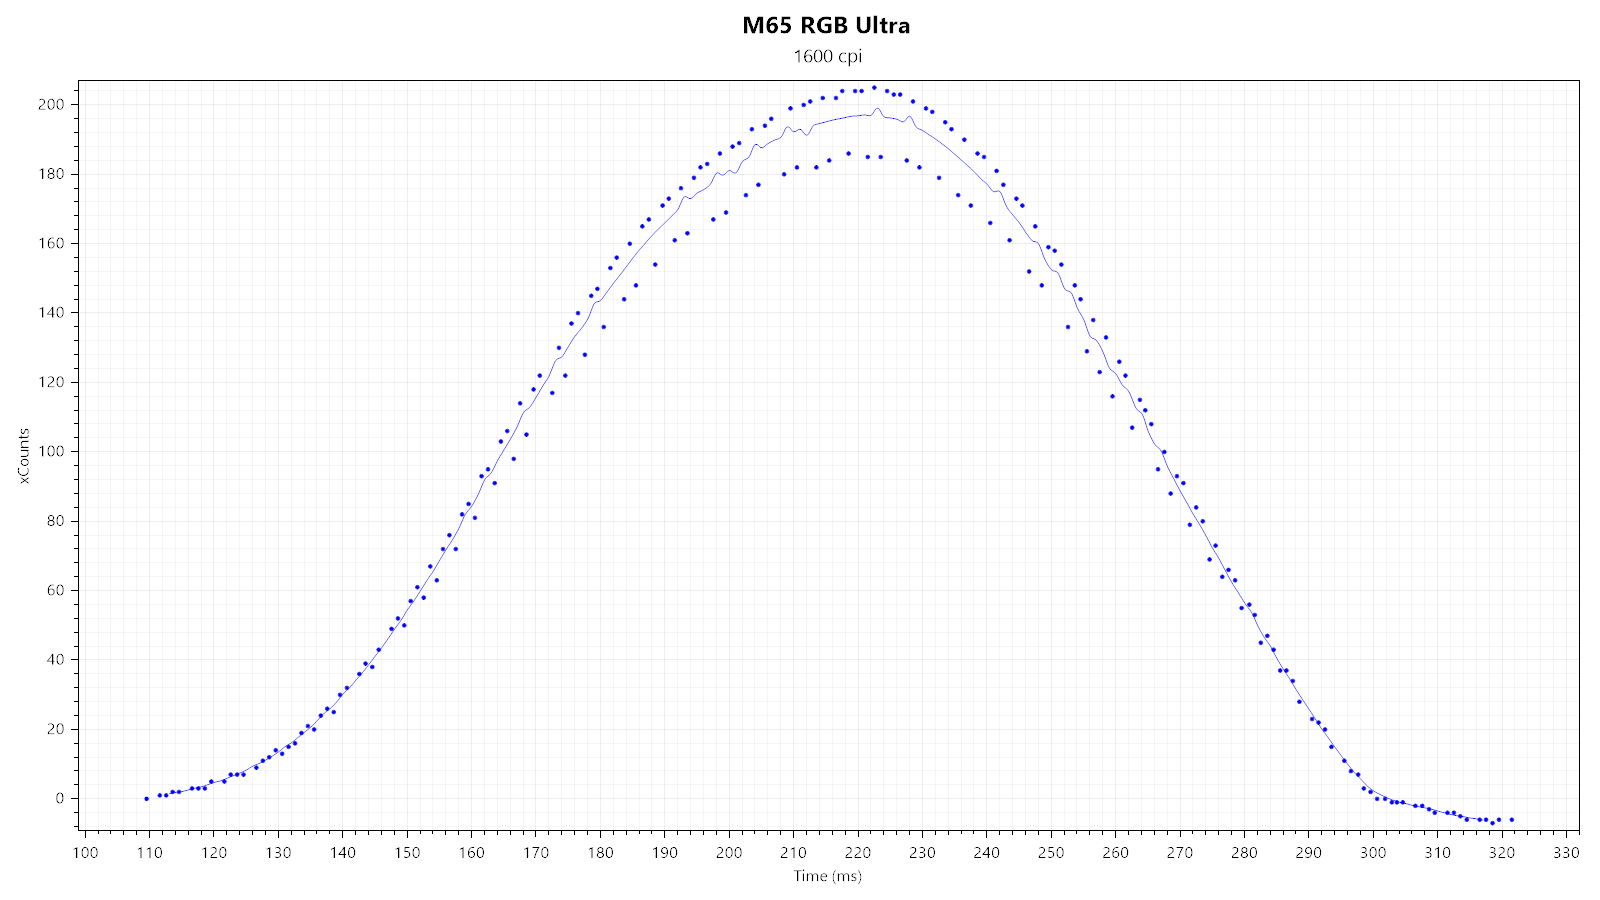
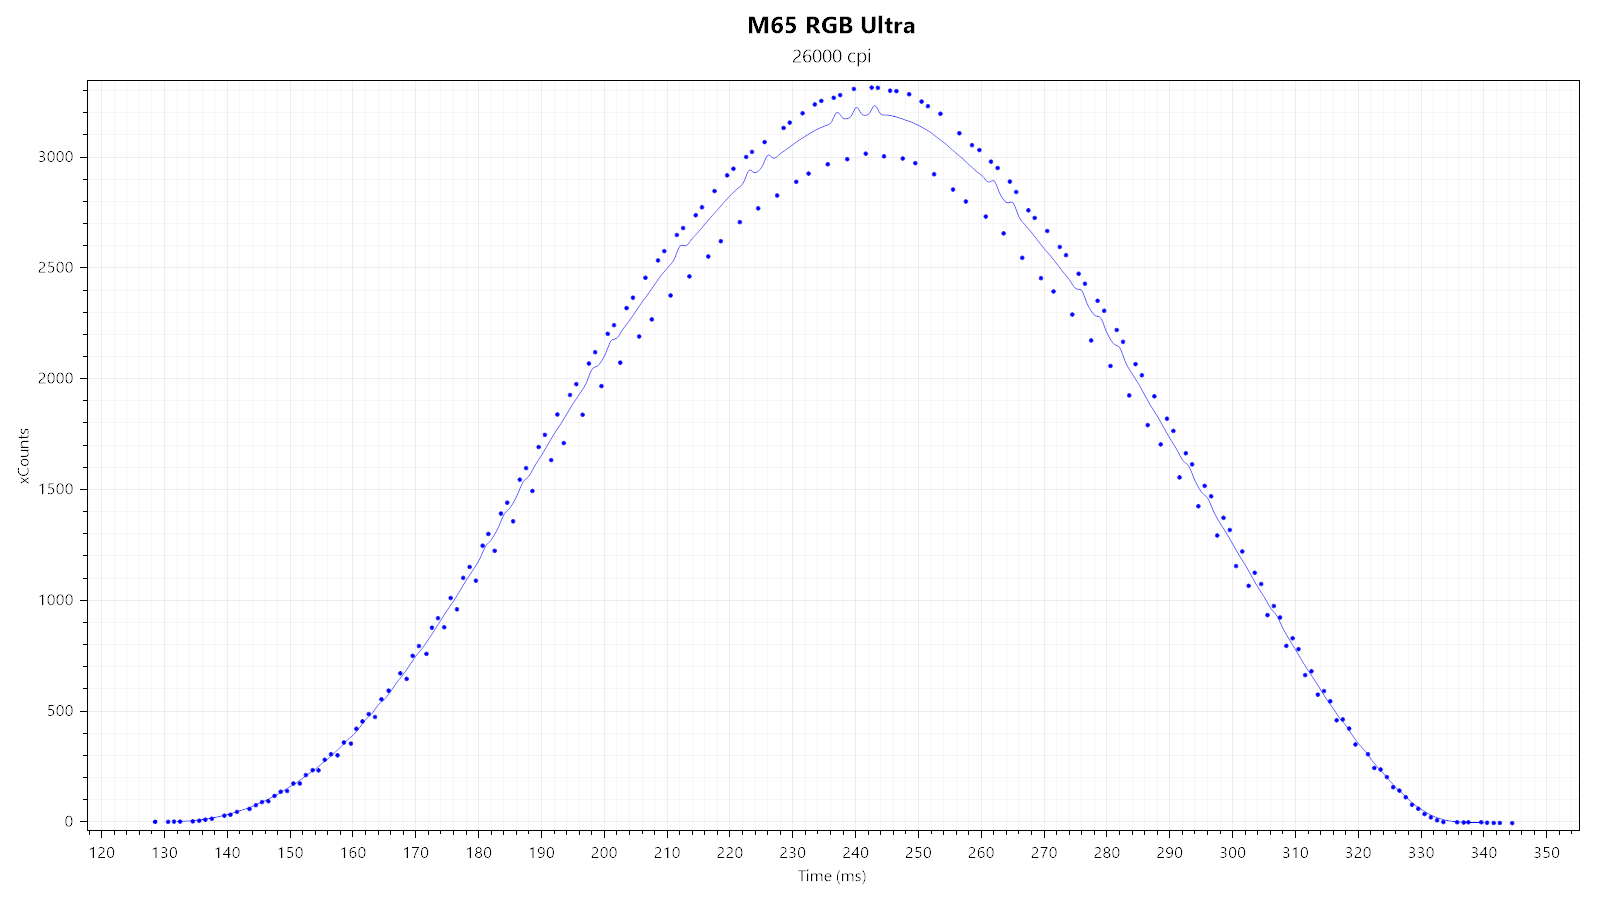
First, I'm looking at two xCounts plots—generated at 1600 and 26,000 CPI—to quickly gauge whether there is any smoothing, which would be indicated by any visible "kinks." As you can see, there are no kinks to be seen anywhere, which strongly suggests that there is no smoothing. We can also see virtually flawless SPI timing, no doubt owing to MotionSync.
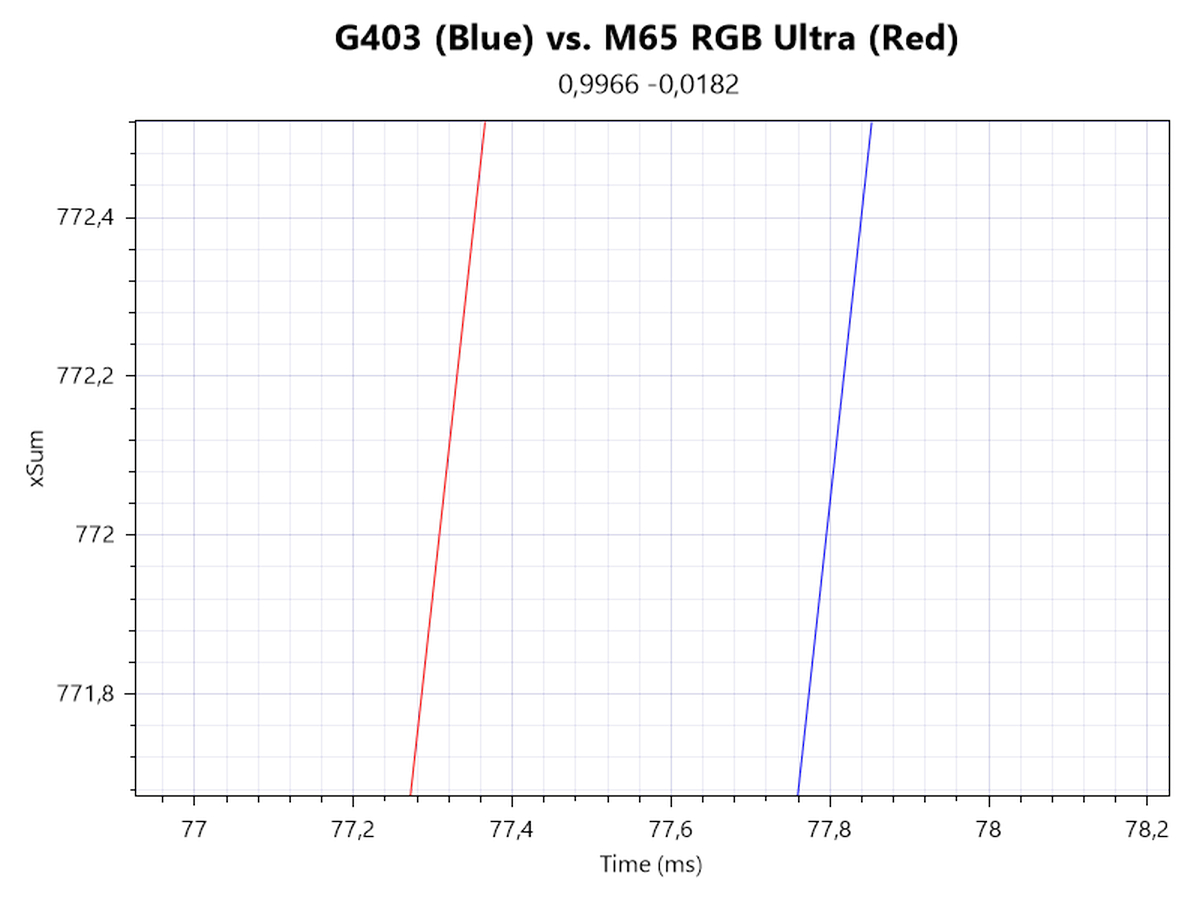
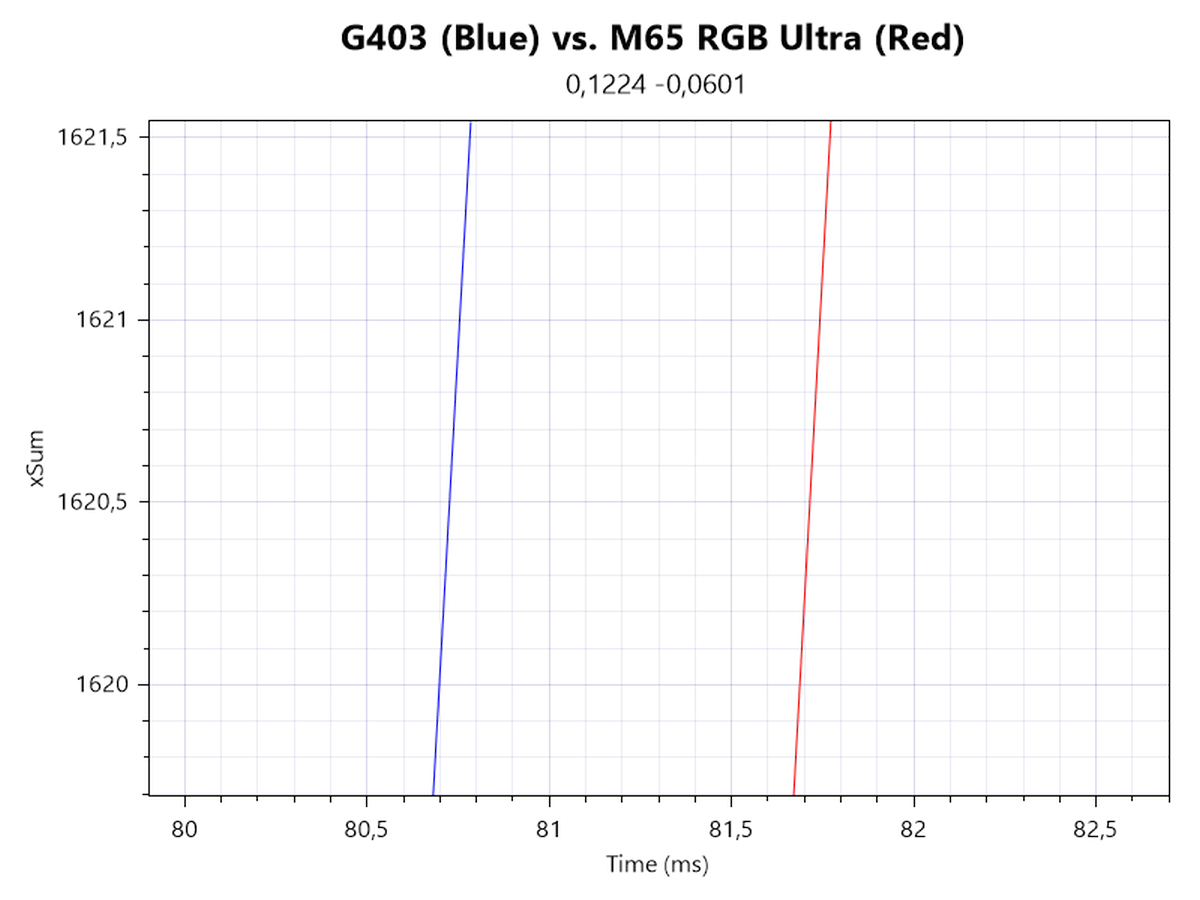
In order to determine motion delay, I'm looking at xSum plots generated at 1600 and 26,000 CPI. The line further to the left denotes the sensor with less motion delay. 1600 CPI shows a slight advantage for the M65 RGB Ultra already. The reverse is true at 26,000 CPI, where the M65 RGB Ultra is trailing by roughly 1 ms.
Speed-related Accuracy Variance (SRAV)
What people typically mean when they talk about "acceleration" is speed-related accuracy variance (or SRAV). It's not about the mouse having a set amount of inherent positive or negative acceleration, but about the cursor not traveling the same distance if the mouse is moved the same physical distance at different speeds. The easiest way to test this is by comparison with a control subject that is known to have very low SRAV, which in this case is the G403. As you can see from the plot, no displacement between the two cursor paths can be observed, which confirms that SRAV is very low.
Perfect Control Speed
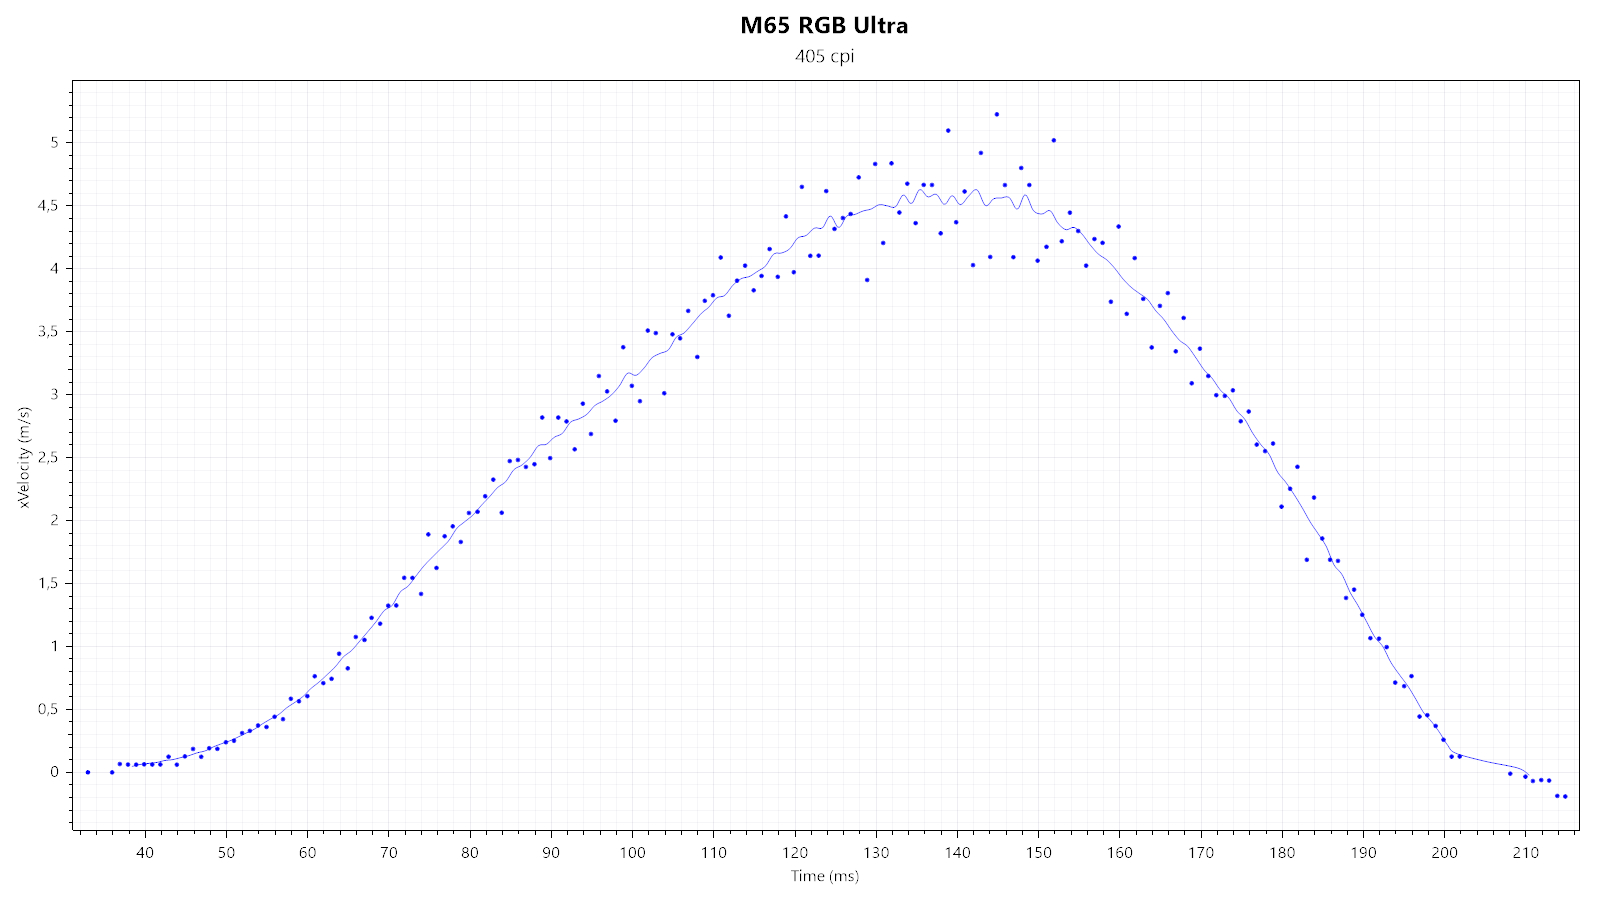
Perfect Control Speed (or PCS for short) is the maximum speed up to which the mouse and its sensor can be moved without the sensor malfunctioning in any way. I've only managed to hit a measly 4.5 m/s (which is within the proclaimed PCS range), at which no sign of the sensor malfunctioning can be observed.
Polling Rate Stability
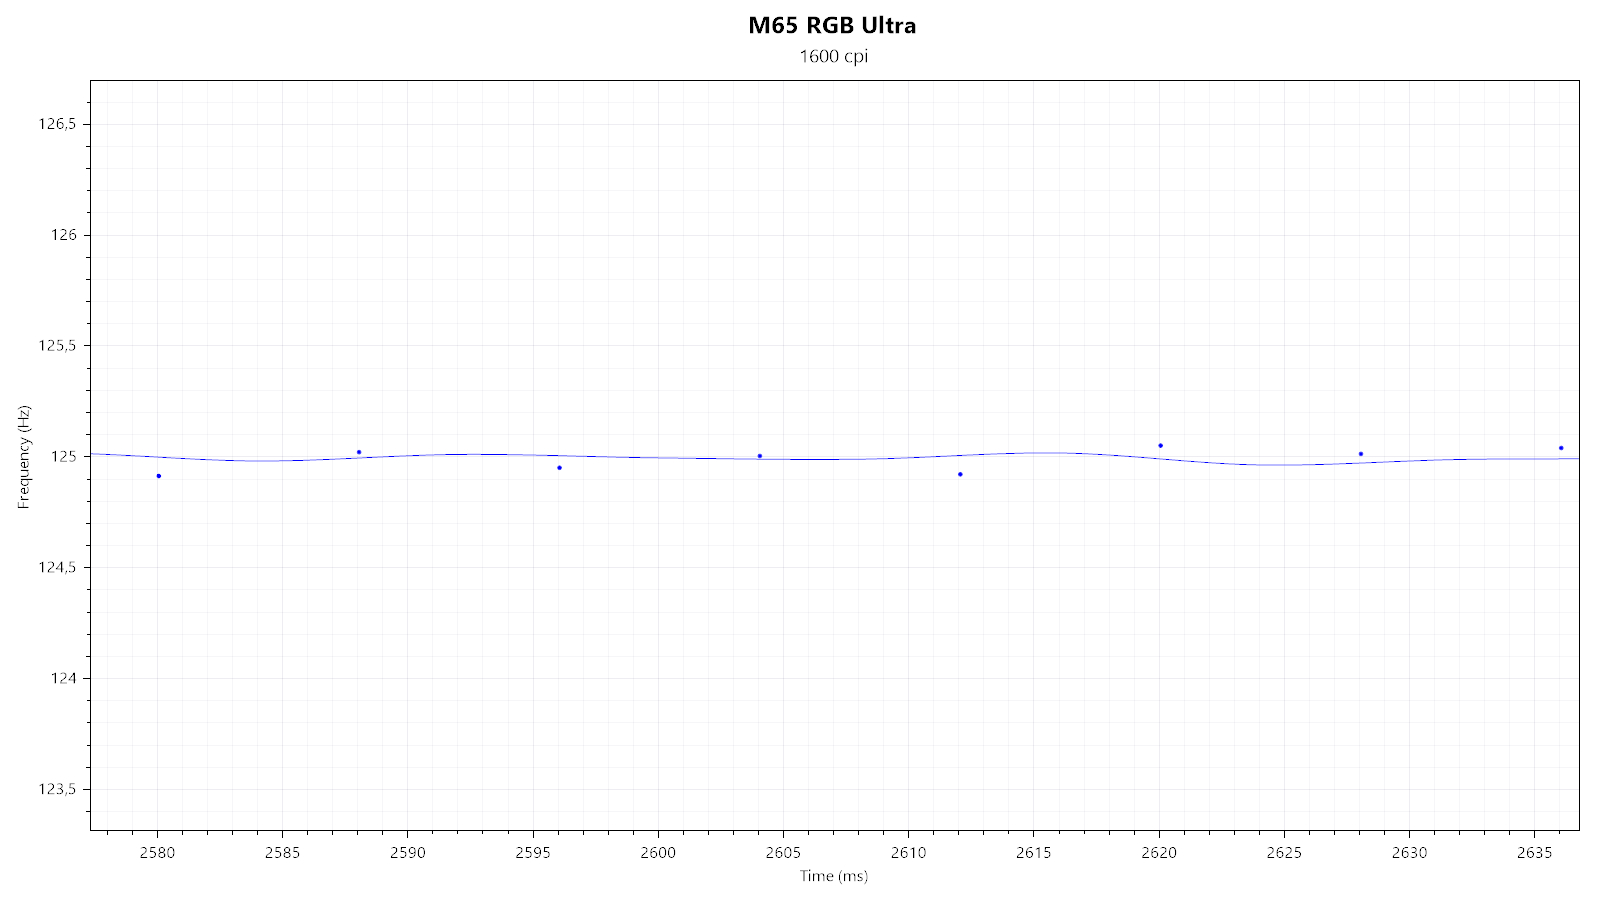
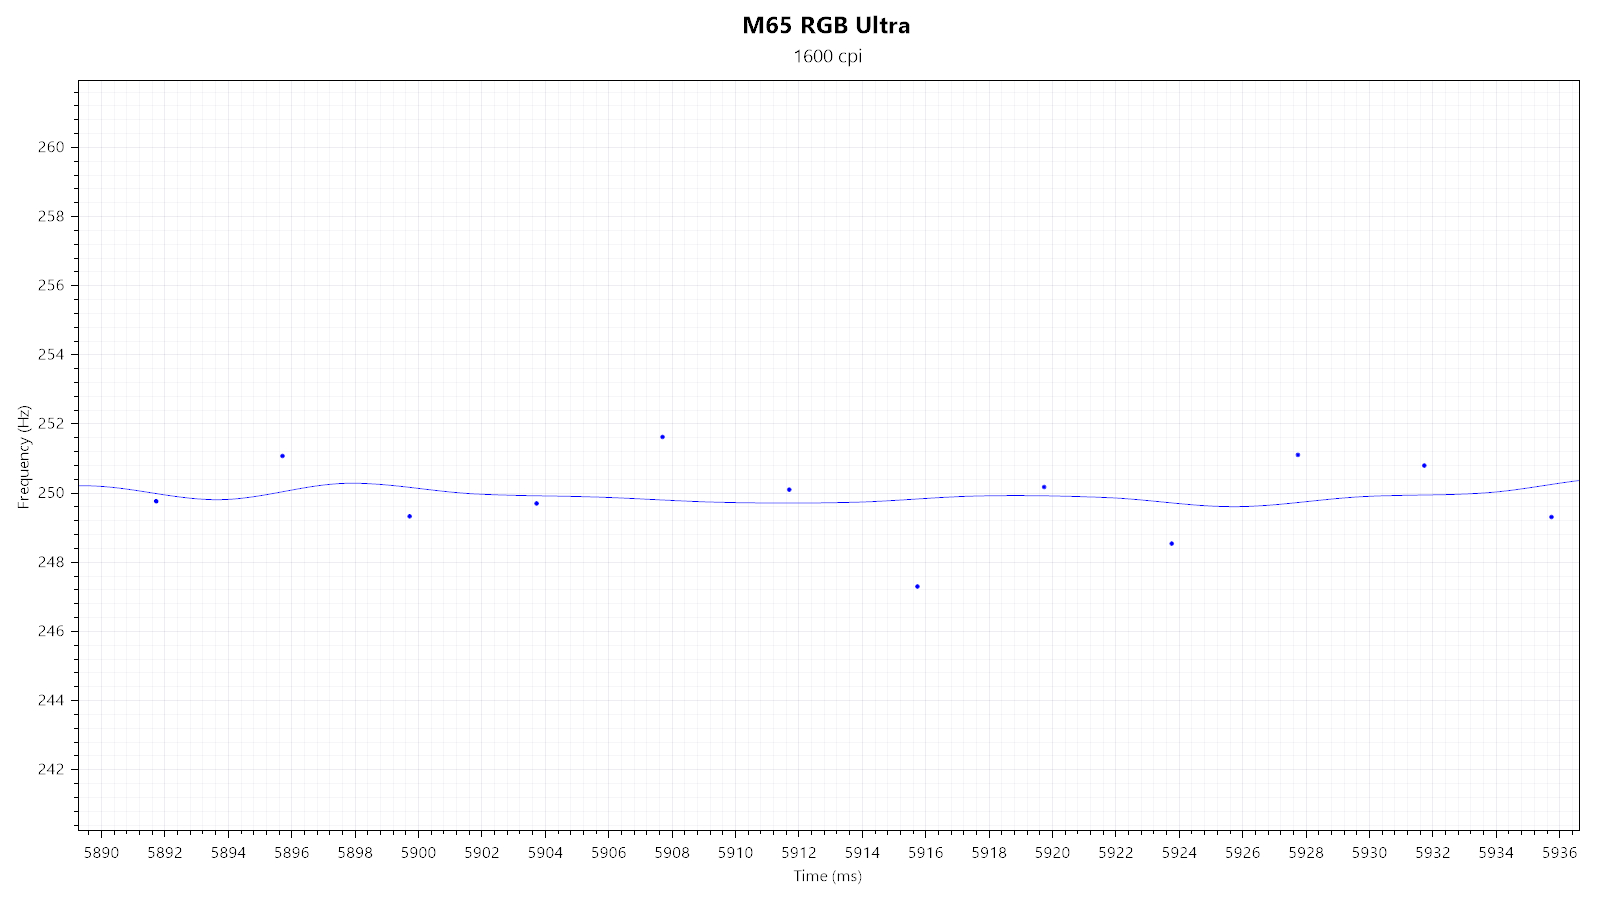
All four of the available non-high speed polling rates (125, 250, 500, and 1000 Hz) look and perform fine. Polling stability is unaffected by any RGB lighting effect.
Paint Test
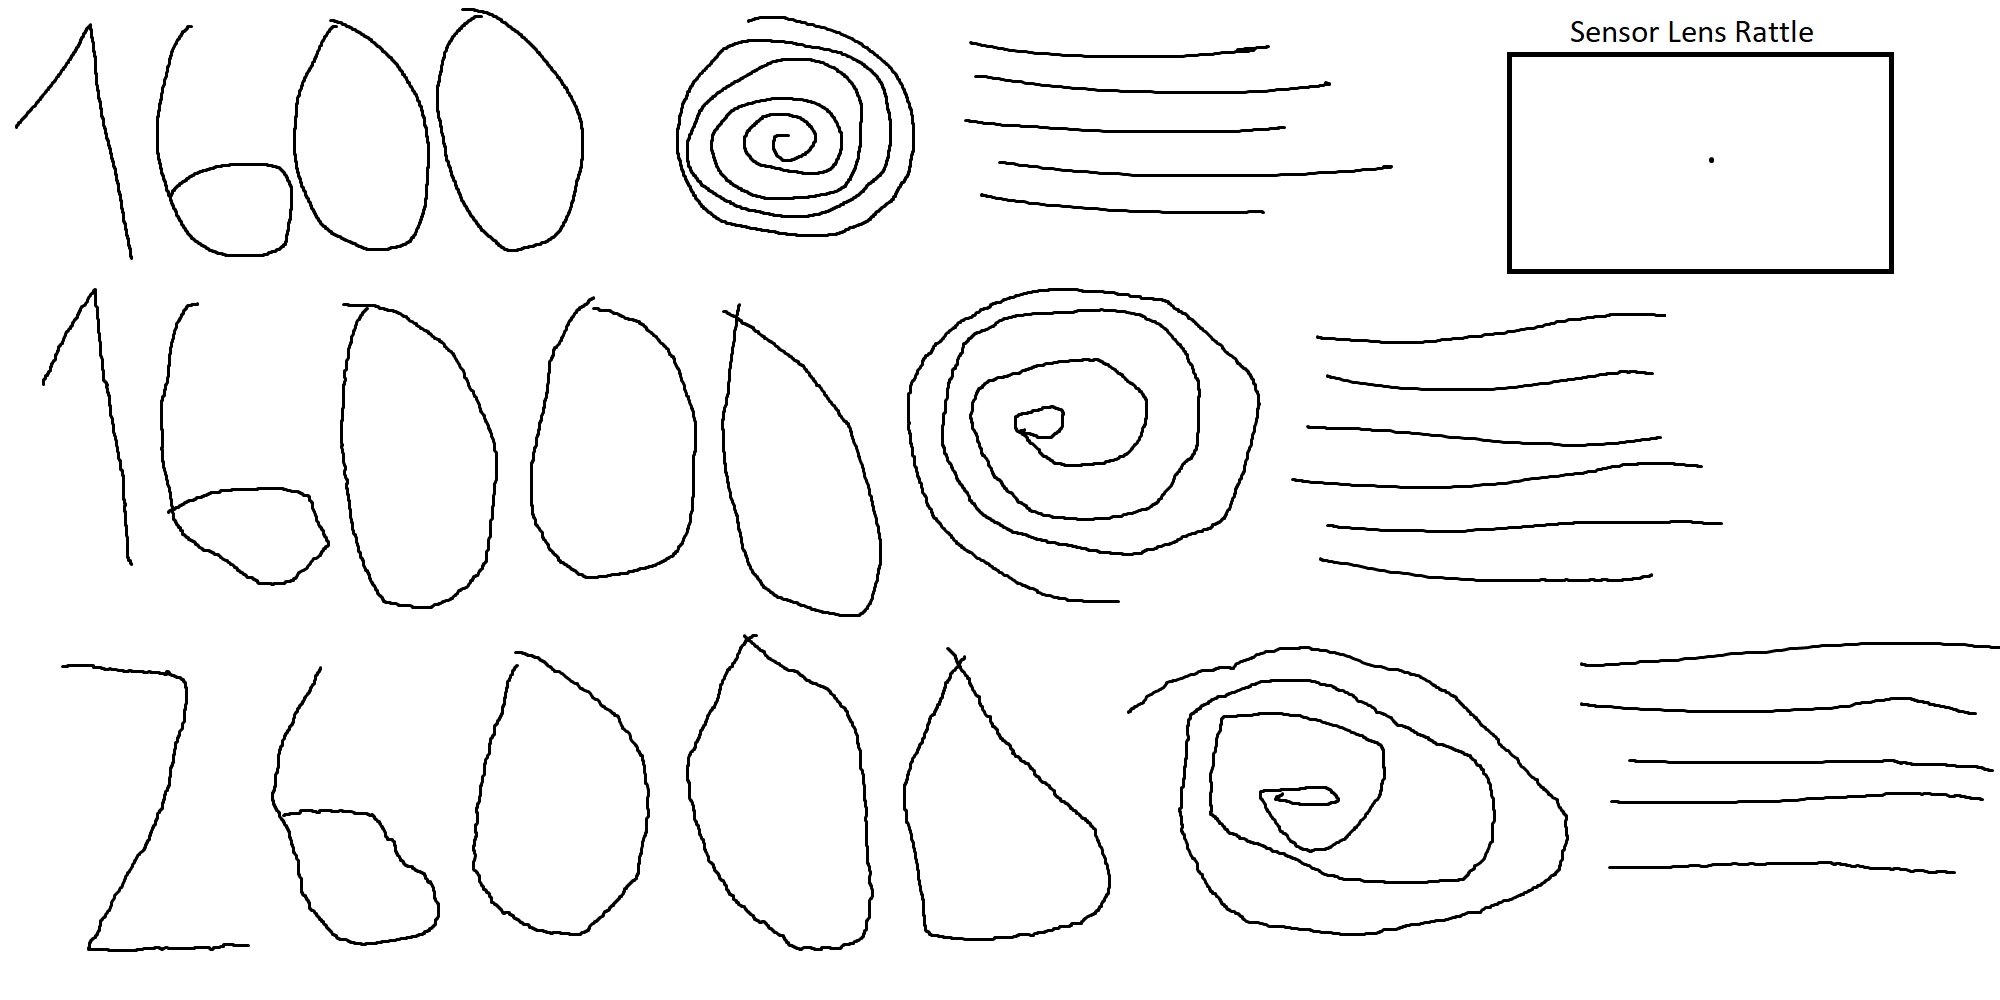
This test is used to indicate any potential issues with angle snapping (non-native straightening of linear motion) and jitter, along with any sensor lens rattle. As you can see, no issues with angle snapping can be observed. No jitter is visible at 1600 CPI. 16,000 CPI already shows above average jitter, reaching major levels at 26,000 CPI. This is in line with what to expect from a sensor lacking smoothing altogether. Lastly, there is no sensor lens movement.
Lift-off Distance
The M65 RGB Ultra offers five pre-defined LOD levels to choose from. Using the "Lowest," "Ultra-low," and "Low" settings, the sensor does not track at a height of 1 DVD (<1.2 mm). Using either the "medium" or "high" setting, the sensor does track at a height of 1 DVD, but not at a height of 2 DVDs (1.2<x<2.4 mm; x=LOD height). Furthermore, one can perform a surface calibration, which may lower LOD beyond the lowest level. Keep in mind that LOD may vary slightly depending on the mousing surface (pad) it is being used on.Click Latency

In most computer mice, debouncing is required to avoid double clicks, slam-clicks, or other unintended effects of switch bouncing. Debouncing typically adds a delay, which, along with any potential processing delay, shall be referred to as click latency. In order to measure click latency, the mouse has been interfaced with an NVIDIA LDAT (Latency Display Analysis Tool). Many thanks go to NVIDIA for providing an LDAT device. More specifically, the LDAT measures the time between the electrical activation of the left main button and the OS receiving the button-down message. Unless noted otherwise, the values presented in the graph refer to the lowest click latency possible on the mouse in question. If a comparison mouse is capable of both wired and wireless operation, only the result for wireless (2.4 GHz) operation will be listed.
At 1000 Hz and with BRO (Button Response Optimization) enabled, click latency has been measured to be 3.3 ms, with standard deviation being 0.28 ms. At 1000 Hz and with BRO disabled, click latency has been measured to be 0.4 ms, with standard deviation being 0.31 ms. At 8000 Hz and with BRO enabled, click latency has been measured to be 3.1 ms, with standard deviation being 0.05 ms. Lastly, at 8000 Hz and with BRO disabled, click latency has been measured to be 0.1 ms, with standard deviation being 0.02 ms.
Jul 4th, 2025 04:08 CDT
change timezone
Latest GPU Drivers
New Forum Posts
- NVIDIA App (44)
- Gigabyte graphic cards - TIM gel SLIPPAGE problem (129)
- [Intel AX1xx/AX2xx/AX4xx/AX16xx/BE2xx/BE17xx] Intel Modded Wi-Fi Driver with Intel® Killer™ Features (363)
- Will you buy a RTX 5090? (617)
- Do you use Linux? (669)
- They're b...a....c....k.... (20)
- RDNA 4 Fine Wine? (HUB Vid) (58)
- [GPU-Z Test Build] New Kernel Driver, Everyone: Please Test (38)
- What Windows is overall the best to you and why? (272)
- How often do you (re)install your OS? (206)
Popular Reviews
- Fractal Design Scape Review - Debut Done Right
- ASUS ROG Crosshair X870E Extreme Review
- Crucial T710 2 TB Review - Record-Breaking Gen 5
- PowerColor ALPHYN AM10 Review
- Sapphire Radeon RX 9060 XT Pulse OC 16 GB Review - An Excellent Choice
- Upcoming Hardware Launches 2025 (Updated May 2025)
- AMD Ryzen 7 9800X3D Review - The Best Gaming Processor
- Sapphire Radeon RX 9070 XT Nitro+ Review - Beating NVIDIA
- SCHENKER KEY 18 Pro (E25) Review - Top-Tier Contender
- AVerMedia CamStream 4K Review
TPU on YouTube
Controversial News Posts
- Intel's Core Ultra 7 265K and 265KF CPUs Dip Below $250 (288)
- NVIDIA Grabs Market Share, AMD Loses Ground, and Intel Disappears in Latest dGPU Update (212)
- Some Intel Nova Lake CPUs Rumored to Challenge AMD's 3D V-Cache in Desktop Gaming (140)
- NVIDIA GeForce RTX 5080 SUPER Could Feature 24 GB Memory, Increased Power Limits (115)
- Microsoft Partners with AMD for Next-gen Xbox Hardware (105)
- NVIDIA Launches GeForce RTX 5050 for Desktops and Laptops, Starts at $249 (105)
- Intel "Nova Lake‑S" Series: Seven SKUs, Up to 52 Cores and 150 W TDP (100)
- NVIDIA DLSS Transformer Cuts VRAM Usage by 20% (97)