 10
10
Corsair RMi Series 650 W Review
Efficiency, Temperatures & Noise »Test Setup

All measurements were performed using two Chroma 6314A mainframes equipped with the following electronic loads: six 63123A [350 W each], one 63102A [100 W x2], and one 63101A [200 W]. The aforementioned equipment is able to deliver 2500 W of load, and all loads are controlled by a custom-made software. The AC source is a Chroma 6530 capable of delivering up to 3 kW of power. We also used a Keysight DSOX3024A oscilloscope, a Rigol DS2072A oscilloscope kindly sponsored by Batronix, a Picoscope 3424 oscilloscope, a Picotech TC-08 thermocouple data logger, two Fluke multimeters (models 289 and 175), a Keithley 2015 THD 6.5 digit bench DMM, and a lab grade N4L PPA1530 3-phase power analyzer along with a Yokogawa WT210 power meter. We also included a wooden box, which, along with some heating elements, was used as a hot box. Finally, we had at our disposal three more oscilloscopes (Rigol VS5042, Stingray DS1M12, and a second Picoscope 3424), and a Class 1 Bruel & Kjaer 2250-L G4 Sound Analyzer we equipped with a type 4189 microphone that features a 16.6-140 dBA-weighted dynamic range. You will find more details about our equipment and the review methodology we follow in this article. We also conduct all of our tests at 40-45 °C ambient to simulate the environment seen inside a typical system more accurately, with 40-45 °C being derived from a standard ambient assumption of 23 °C and 17-22 °C being added for the typical temperature rise within a system.
We use a GPIB-USB controller to control the Chroma 6530 source, which avoids its very picky Serial port. This controller was kindly provided by Prologix.
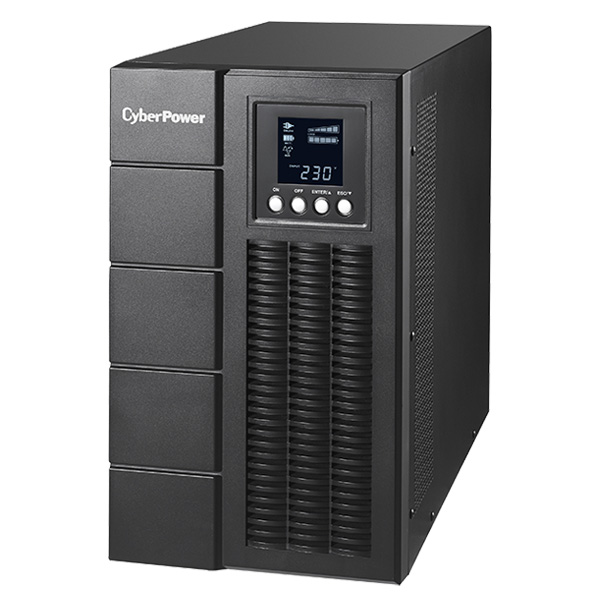
To protect our very expensive Chroma AC source, we use an OLS3000E online UPS with a capacity of 3000VA, or 2700W.
OLS3000E kindly provided by: |
Primary Rails Load Regulation
The following charts show the voltage values of the main rails and include the deviation (in percent) for the same load range. These voltage values start at 60 W and go to the maximum specified load.


5VSB Regulation
The following chart shows how the 5VSB rail deals with the load we throw at it.

Hold-up Time
Hold-up time is a very important PSU characteristic and represents the amount of time, usually measured in milliseconds, a PSU can maintain output regulations as defined by the ATX spec without input power. In other words, it is the amount of time the system can continue to run without shutting down or rebooting during a power interruption. The ATX specification sets the minimum hold-up time to 17 ms with the maximum continuous output load.According to the ATX specification, PWR_OK is a "power good" signal. This signal should be asserted as high on the 5V rail by the power supply to indicate that the +12V, 5V, and 3.3V outputs are within the regulation thresholds and that sufficient mains energy is stored by the APFC converter to guarantee a system's continuous operation for at least 17 ms. Conversely, PWR_OK should be de-asserted to a low state, 0V, when any of the +12V, 5V, or 3.3V output voltages fall below the under-voltage threshold or when mains power has been removed for long enough to guarantee that a power supply isn't operating anymore. The AC loss to PWR_OK minimum hold-up time is set to 16 ms, which is less than the hold-up time described above, but the ATX specification also sets a PWR_OK inactive-to-DC loss delay that should be higher than 1 ms. This means that the AC loss to PWR_OK hold-up time should be lower than the PSU's overall hold-up time to ensure that the power supply doesn't send a power good signal once any of the +12V, 5V and 3.3V rails are out of spec
In the following screenshots, the blue line is the mains signal, the green line is the "Power Good" signal and the yellow line represents the +12V rail.
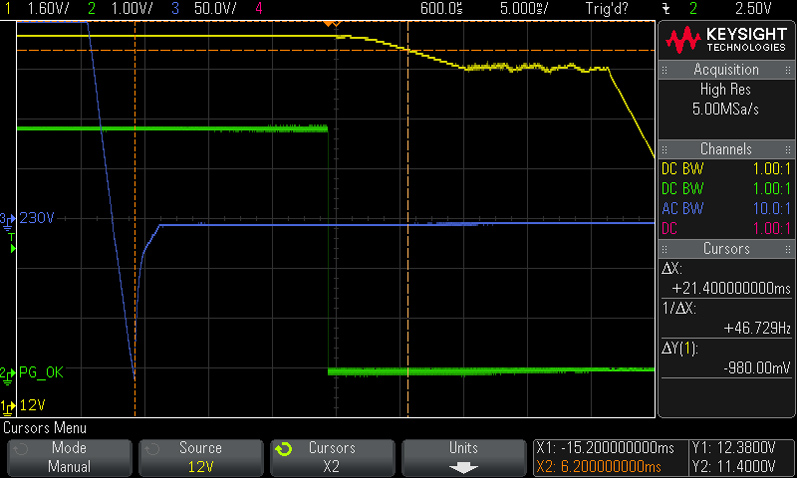
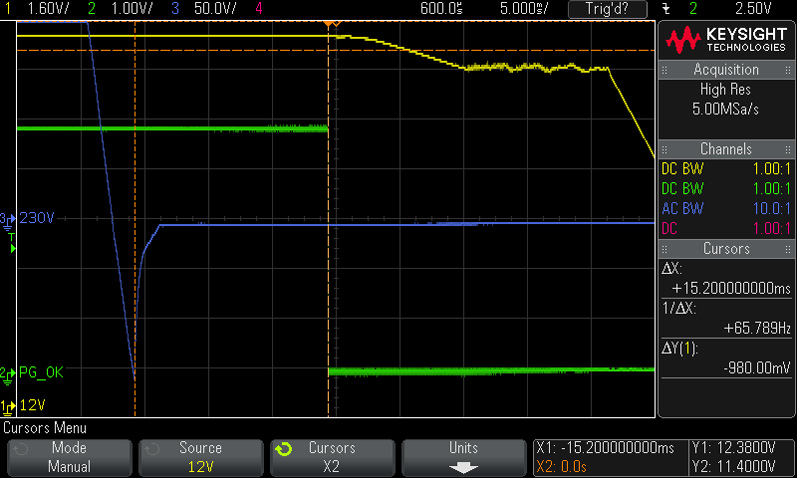


The hold-up time is much longer than required, but the power good signal's hold-up time is lower than 16ms because there is a very long delay between the actual hold-up time and the moment the power good signal is de-asserted. However, the power good signal must drop earlier, as is the case here, rather than later once the rails are out of spec.
Inrush Current
Inrush current or switch-on surge refers to the maximum, instantaneous input-current drawn by an electrical device when it is first turned on. Because of the charging current of the APFC capacitor(s), PSUs produce large inrush-current right as they are turned on. Large inrush current can cause the tripping of circuit breakers and fuses and may also damage switches, relays, and bridge rectifiers; as a result, the lower the inrush current of a PSU right as it is turned on, the better.
Inrush current is a little higher than expected.
Load Regulation and Efficiency Measurements
The first set of tests revealed the stability of the voltage rails and the RM650i's efficiency. The applied load was equal to (approximately) 10%-110% of the maximum load the PSU can handle, in 10% steps.We conducted two additional tests. In the first test, we stressed the two minor rails (5V and 3.3V) with a high load while the load at +12V was only 0.10 A. This test reveals whether the PSU is Haswell ready or not. In the second test, we dialed the maximum load the +12V rail could handle while the load on the minor rails was minimal.
| Load Regulation & Efficiency Testing Data - Corsair RM650i | ||||||||||
|---|---|---|---|---|---|---|---|---|---|---|
| Test | 12 V | 5 V | 3.3 V | 5VSB | Power (DC/AC) | Efficiency | Fan Speed | Fan Noise | Temp (In/Out) | PF/AC Volts |
| 10% Load | 3.553A | 1.984A | 1.989A | 0.996A | 64.77W | 84.70% | 0 RPM | 0 dBA | 47.24°C | 0.785 |
| 12.153V | 5.040V | 3.316V | 5.018V | 76.47W | 40.35°C | 230.2V | ||||
| 20% Load | 8.150A | 2.969A | 2.985A | 1.196A | 129.76W | 89.67% | 0 RPM | 0 dBA | 48.77°C | 0.913 |
| 12.138V | 5.037V | 3.313V | 5.013V | 144.71W | 40.68°C | 230.2V | ||||
| 30% Load | 13.101A | 3.476A | 3.501A | 1.395A | 194.89W | 91.28% | 0 RPM | 0 dBA | 50.81°C | 0.958 |
| 12.122V | 5.036V | 3.310V | 5.008V | 213.52W | 42.09°C | 230.2V | ||||
| 40% Load | 18.055A | 3.973A | 3.989A | 1.595A | 259.78W | 91.93% | 0 RPM | 0 dBA | 51.64°C | 0.975 |
| 12.108V | 5.033V | 3.308V | 5.002V | 282.59W | 42.66°C | 230.2V | ||||
| 50% Load | 22.687A | 4.968A | 4.991A | 1.800A | 324.77W | 92.11% | 0 RPM | 0 dBA | 52.77°C | 0.984 |
| 12.090V | 5.032V | 3.304V | 4.998V | 352.59W | 42.84°C | 230.2V | ||||
| 60% Load | 27.326A | 5.965A | 6.000A | 2.000A | 389.70W | 91.86% | 1048 RPM | 32.1 dBA | 42.83°C | 0.988 |
| 12.074V | 5.028V | 3.299V | 4.992V | 424.24W | 47.68°C | 230.2V | ||||
| 70% Load | 31.971A | 6.971A | 7.010A | 2.203A | 454.66W | 91.71% | 1052 RPM | 32.1 dBA | 43.01°C | 0.990 |
| 12.060V | 5.023V | 3.294V | 4.986V | 495.77W | 48.45°C | 230.2V | ||||
| 80% Load | 36.638A | 7.967A | 8.021A | 2.404A | 519.63W | 91.42% | 1176 RPM | 37.0 dBA | 43.82°C | 0.991 |
| 12.044V | 5.020V | 3.291V | 4.981V | 568.40W | 49.59°C | 230.3V | ||||
| 90% Load | 41.745A | 8.472A | 8.544A | 2.405A | 584.69W | 91.09% | 1296 RPM | 42.0 dBA | 44.73°C | 0.992 |
| 12.028V | 5.018V | 3.288V | 4.981V | 641.92W | 51.00°C | 230.3V | ||||
| 100% Load | 46.607A | 8.977A | 9.040A | 3.020A | 649.57W | 90.65% | 1408 RPM | 41.5 dBA | 45.84°C | 0.993 |
| 12.012V | 5.016V | 3.285V | 4.966V | 716.56W | 52.71°C | 230.3V | ||||
| 110% Load | 52.093A | 8.979A | 9.046A | 3.020A | 714.47W | 90.13% | 1560 RPM | 43.5 dBA | 47.01°C | 0.993 |
| 11.993V | 5.014V | 3.284V | 4.964V | 792.75W | 54.45°C | 230.3V | ||||
| Crossload 1 | 0.101A | 16.023A | 16.005A | 0.004A | 134.43W | 83.36% | 624 RPM | 22.9 dBA | 45.09°C | 0.931 |
| 12.125V | 5.028V | 3.288V | 5.083V | 161.27W | 51.25°C | 230.3V | ||||
| Crossload 2 | 54.120A | 1.003A | 1.003A | 1.002A | 663.29W | 91.17% | 1411 RPM | 41.5 dBA | 47.03°C | 0.993 |
| 12.009V | 5.024V | 3.303V | 5.003V | 727.50W | 54.38°C | 230.3V | ||||
Corsair Link Screenshots
Several screenshots of the Corsair Link software, which we took during our test sessions, follow. The order of these screenshots is the same as the order of the tests in the table above (10% load to Cross-load 2 test).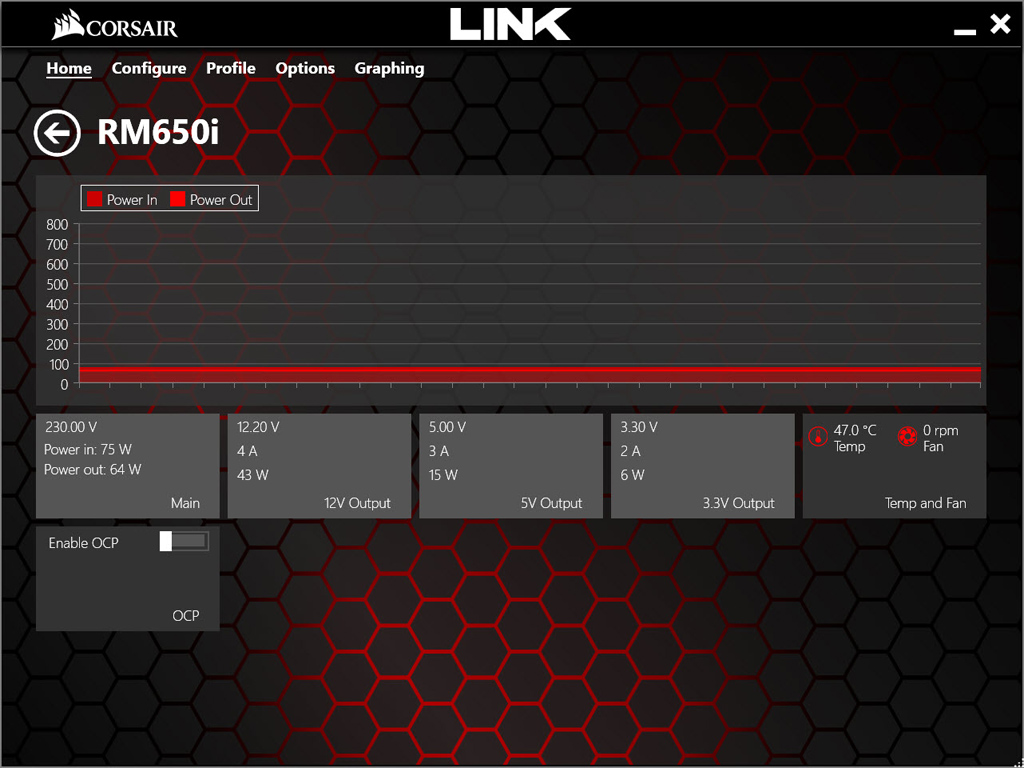
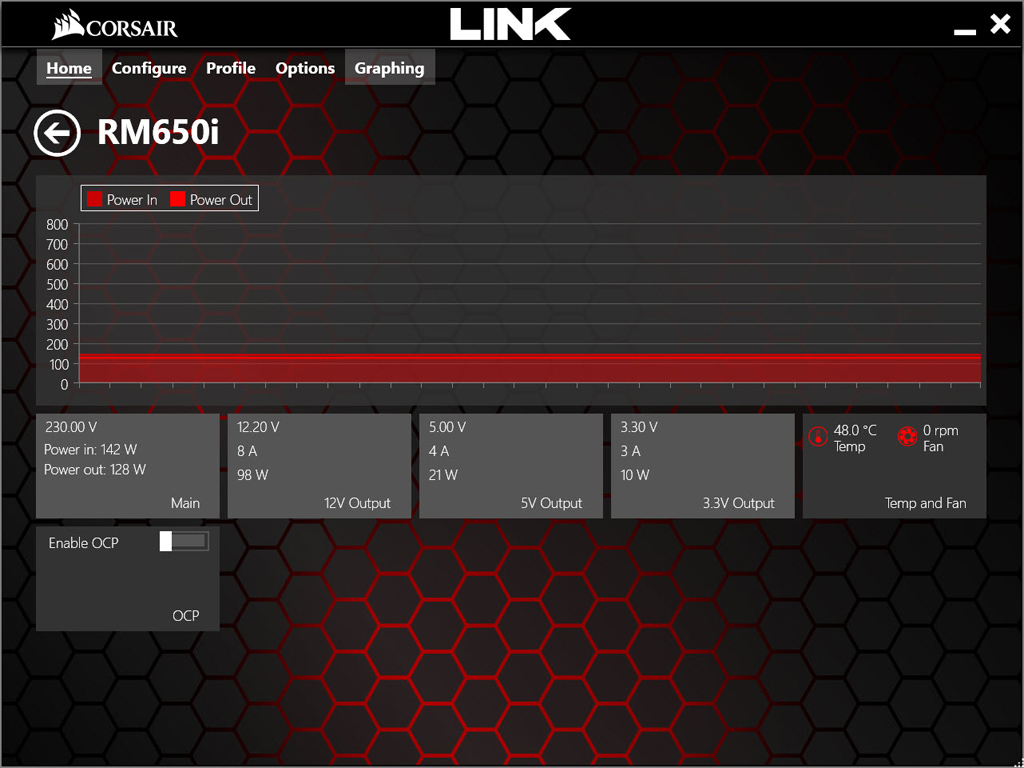
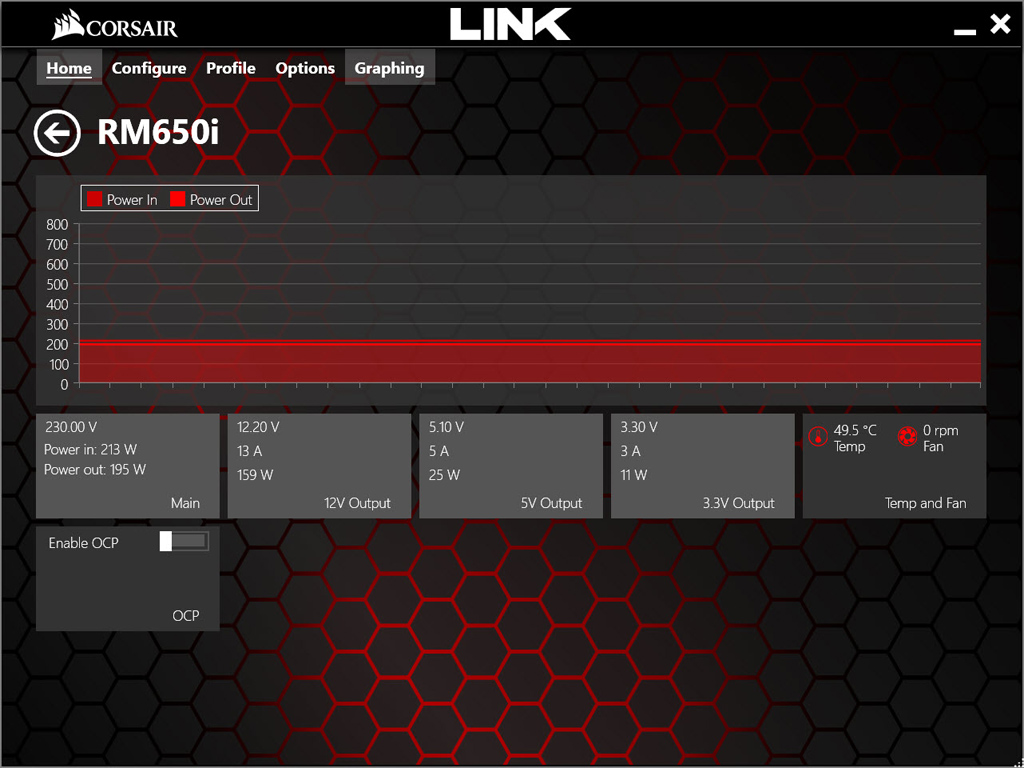
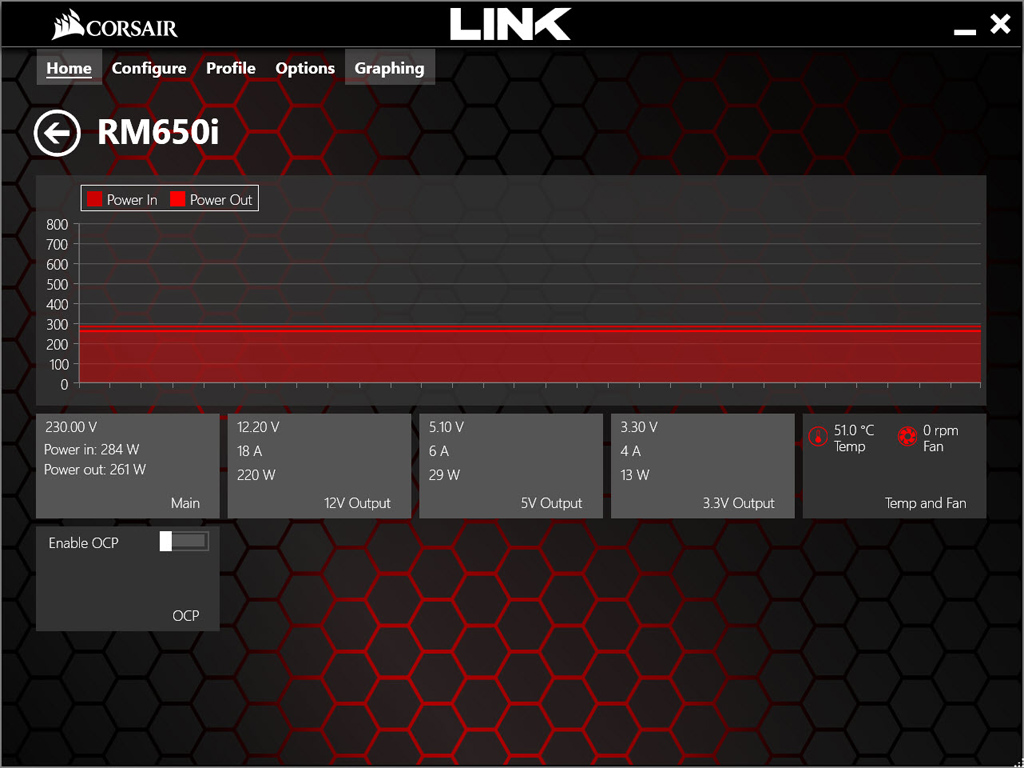
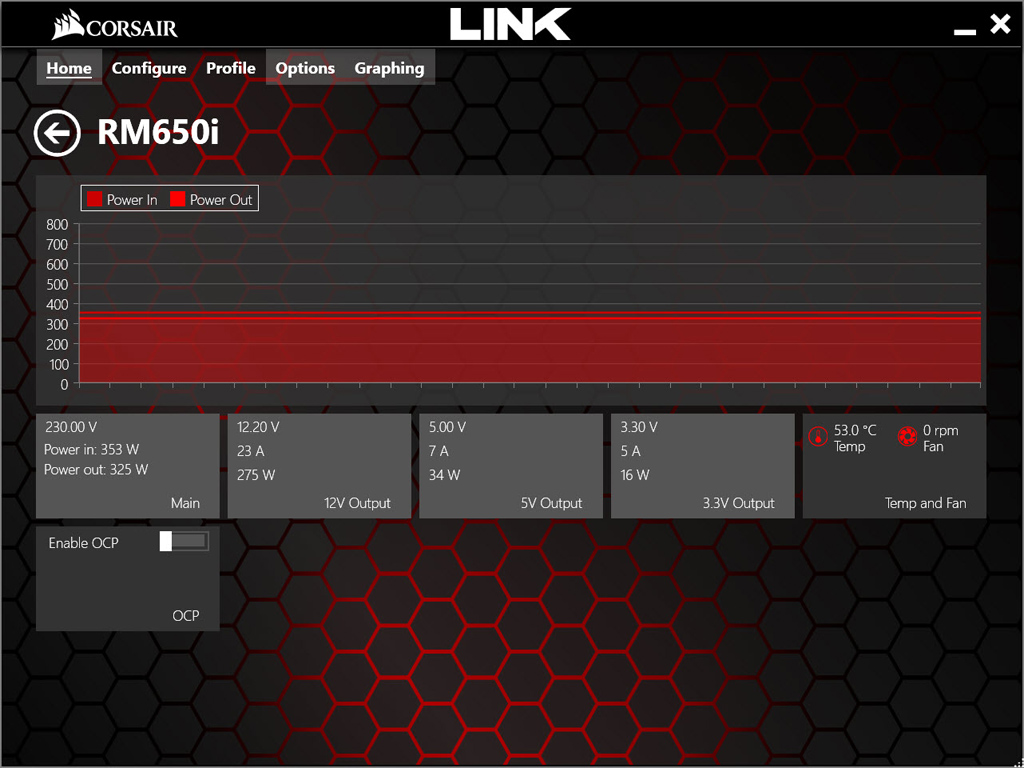
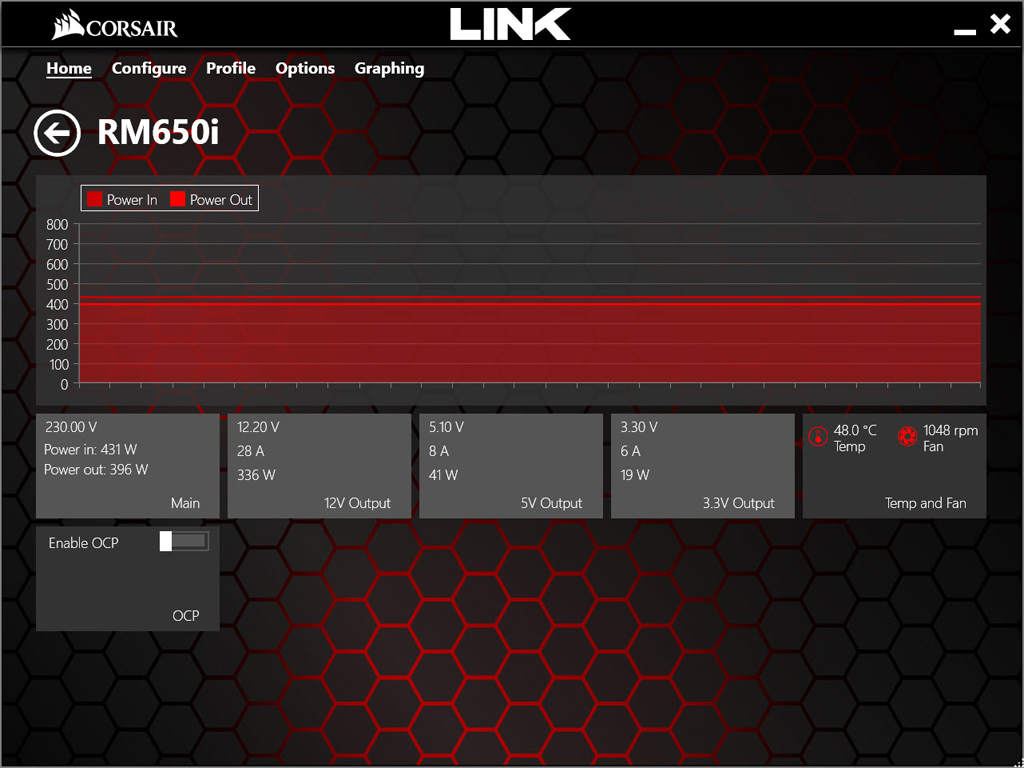
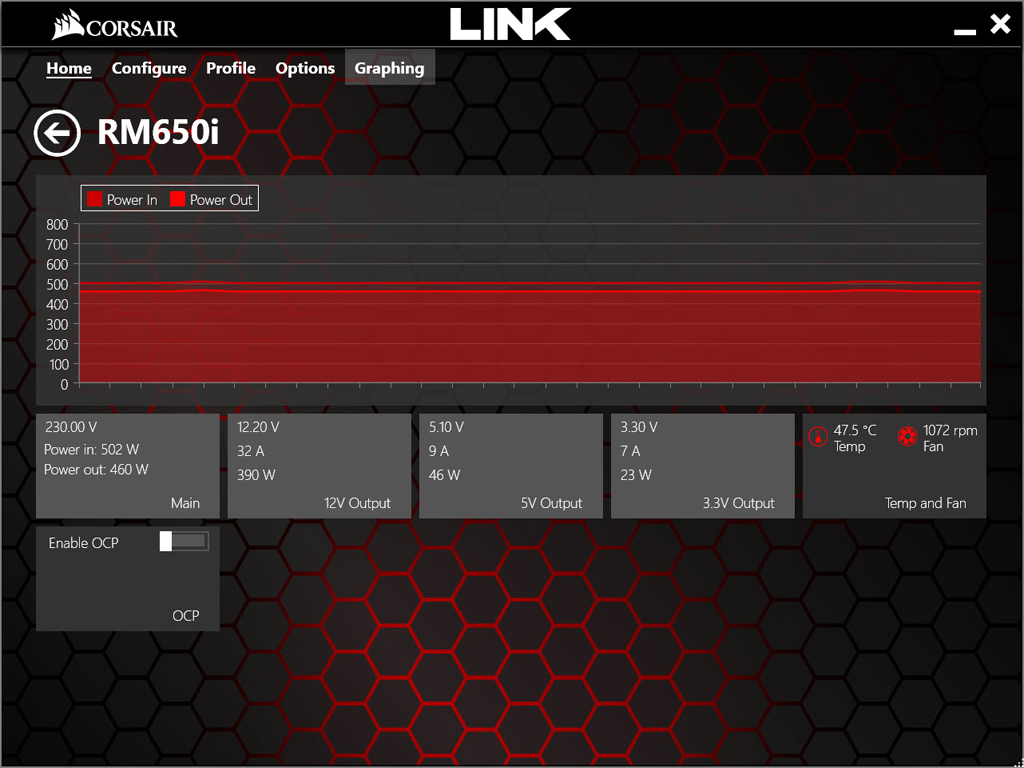

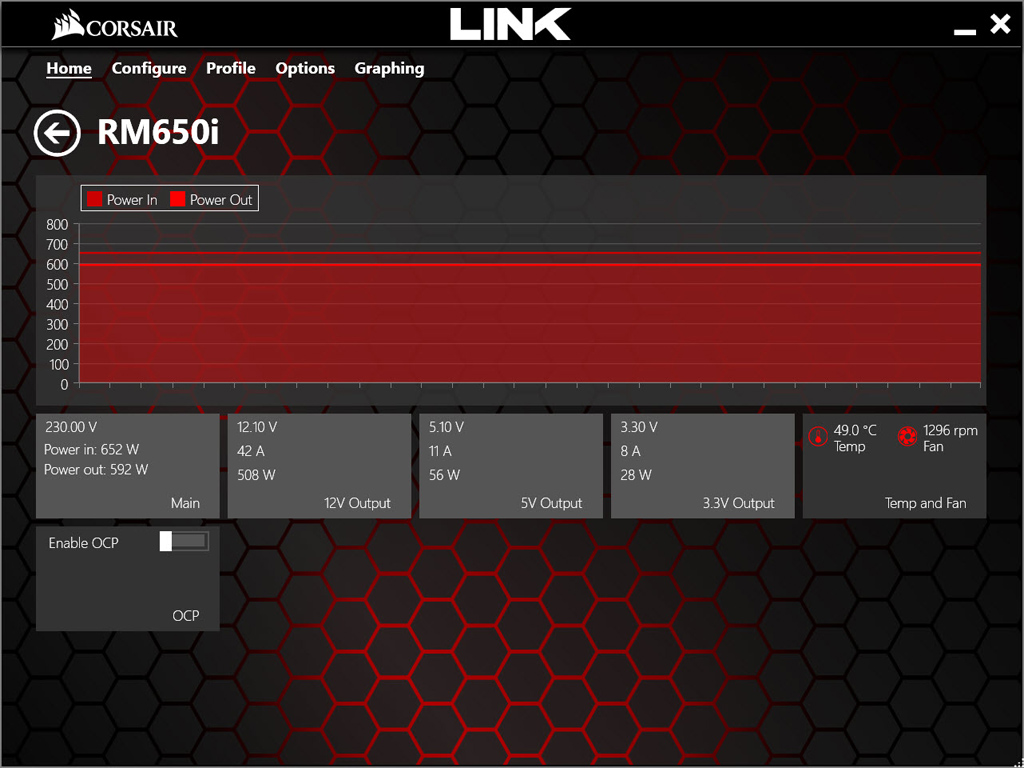
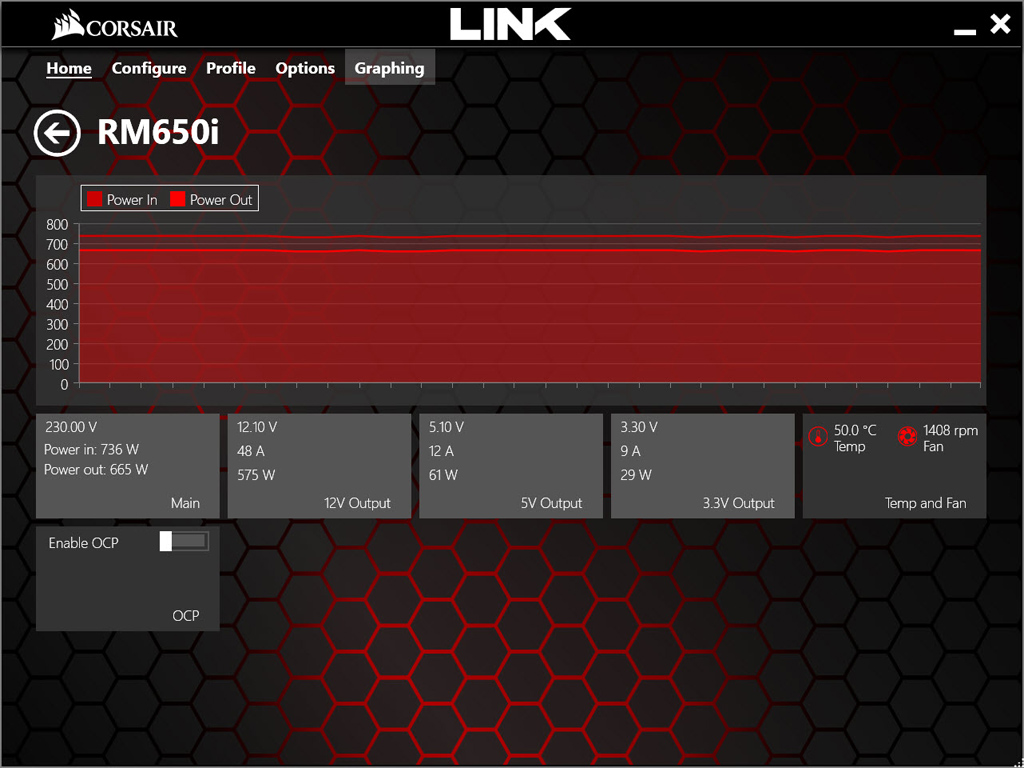
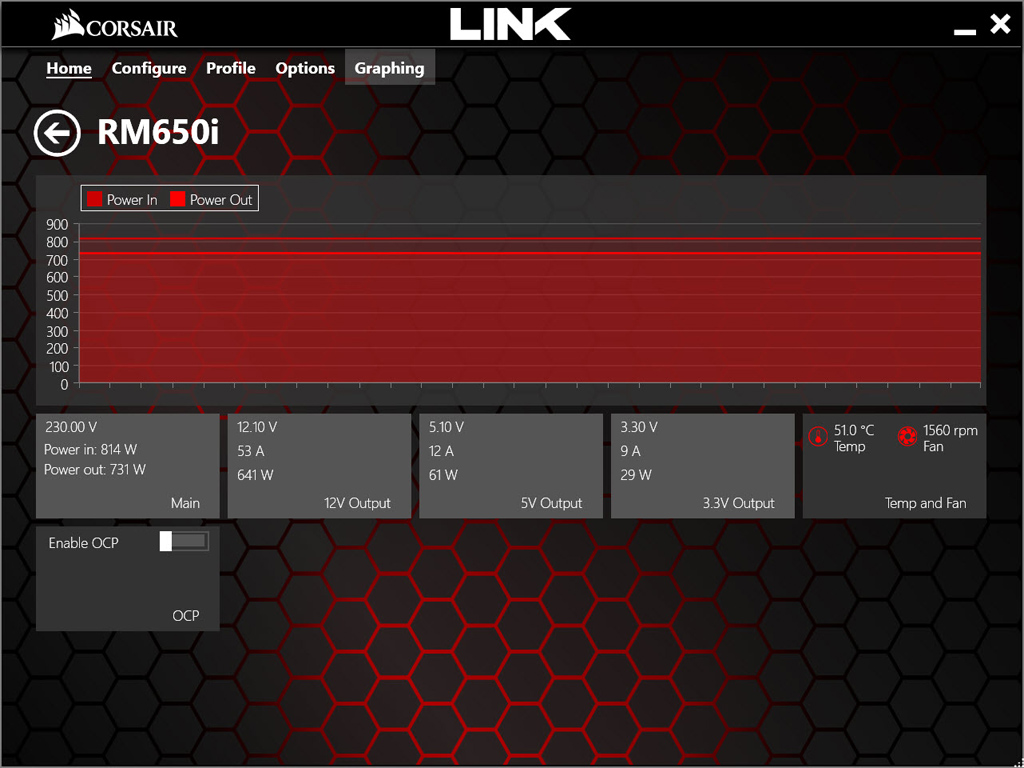

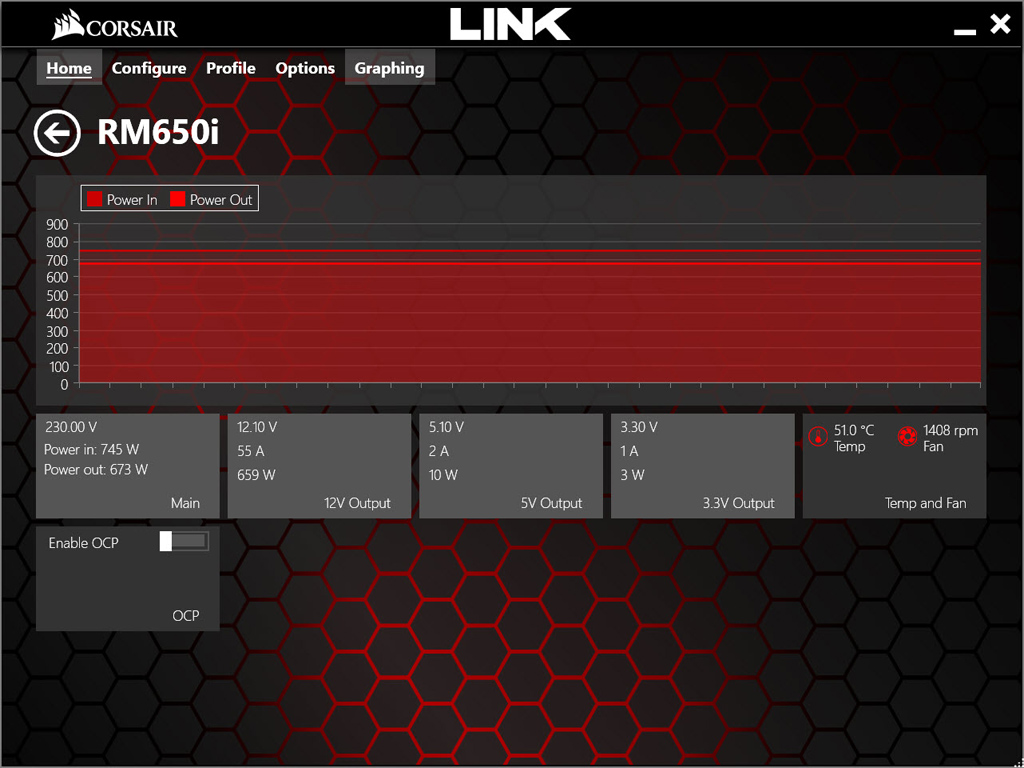
Corsair Link's accuracy when it comes to power in and out readings is close enough, and the software was spot-on in the fifth test! The voltage readings aren't as close to the real values; however, they aren't very far off either.
Jul 15th, 2025 19:55 CDT
change timezone
Latest GPU Drivers
New Forum Posts
- Is this dual channel or async? (1)
- TPU's Nostalgic Hardware Club (20514)
- What's your latest tech purchase? (24279)
- No offense, here are some things that bother me about your understanding of fans. (147)
- Stupid things one has done with hardware (68)
- Game Informer magazine is back! (5)
- monitor stand became loose after making changes to setup (0)
- What is the latest game you finished or 100% (53)
- How about AMD instead of Intel? (43)
- Adding distilled water to ups batteries really work ? (15)
Popular Reviews
- MSI GeForce RTX 5060 Gaming OC Review
- Our Visit to the Hunter Super Computer
- SilverStone SETA H2 Review
- Lexar NM1090 Pro 4 TB Review
- NVIDIA GeForce RTX 5050 8 GB Review
- Fractal Design Epoch RGB TG Review
- Sapphire Radeon RX 9060 XT Pulse OC 16 GB Review - An Excellent Choice
- AMD Ryzen 7 9800X3D Review - The Best Gaming Processor
- Upcoming Hardware Launches 2025 (Updated May 2025)
- Corsair FRAME 5000D RS Review
TPU on YouTube
Controversial News Posts
- Intel's Core Ultra 7 265K and 265KF CPUs Dip Below $250 (288)
- Some Intel Nova Lake CPUs Rumored to Challenge AMD's 3D V-Cache in Desktop Gaming (140)
- AMD Radeon RX 9070 XT Gains 9% Performance at 1440p with Latest Driver, Beats RTX 5070 Ti (131)
- NVIDIA Launches GeForce RTX 5050 for Desktops and Laptops, Starts at $249 (122)
- NVIDIA GeForce RTX 5080 SUPER Could Feature 24 GB Memory, Increased Power Limits (115)
- Microsoft Partners with AMD for Next-gen Xbox Hardware (105)
- Intel "Nova Lake‑S" Series: Seven SKUs, Up to 52 Cores and 150 W TDP (100)
- NVIDIA DLSS Transformer Cuts VRAM Usage by 20% (99)