 1
1
Cougar GX-F Series 750W Review
Efficiency, Temperatures & Noise »Test Setup

All measurements were performed using two Chroma 6314A mainframes equipped with the following electronic loads: six 63123A [350 W each], one 63102A [100 W x2], and one 63101A [200 W]. The aforementioned equipment is able to deliver 2500 W of load, and all loads are controlled by a custom-made software. The AC source is a Chroma 6530 capable of delivering up to 3 kW of power. We also used a Keysight DSOX3024A oscilloscope, an Rigol DS2072A oscilloscope kindly sponsored by Batronix, a Picoscope 3424 oscilloscope, a Picotech TC-08 thermocouple data logger, two Fluke multimeters (models 289 and 175), a Keithley 2015 THD 6.5 digit bench DMM, and a lab-grade N4L PPA1530 3-phase power analyzer along with a Yokogawa WT210 power meter. We also included a wooden box, which, along with some heating elements, was used as a hot box. Finally, we had at our disposal three more oscilloscopes (Rigol VS5042, Stingray DS1M12 and a second Picoscope 3424) and a Class 1 Bruel & Kjaer 2250-L G4 Sound Analyzer equipped with a Type 4955a microphone that features a 6.5-110 dBA-weighted dynamic range on paper (it can actually go even lower, to 5 dB[A]). You will find more details about our equipment and the review methodology we follow in this article. We also conduct all of our tests at 40–45 °C ambient to simulate the environment seen inside a typical system more accurately, with 40–45 °C being derived from a standard ambient assumption of 23 °C and 17–22 °C being added for the typical temperature rise within a system.
We use a GPIB-USB controller to control the Chroma 6530 source, which avoid its very picky Serial port. This controller was kindly provided by Prologix.
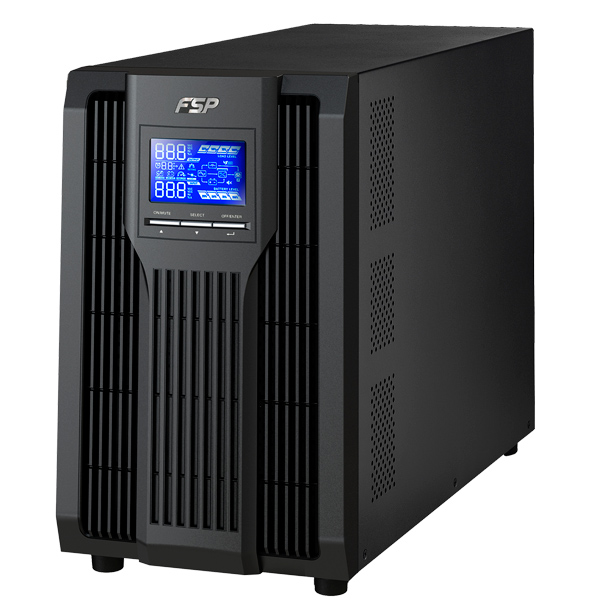
To protect our super expensive Chroma AC source, we use an FSP Champ online UPS with a capacity of 3000VA/2700W.
FSP Champ UPS kindly provided by: |
Primary Rails Load Regulation
The following charts show the voltage values of the main rails, recorded over a range from 60 W to the maximum specified load, and the deviation (in percent) for the same load range.


5VSB Regulation
The following chart shows how the 5VSB rail deals with the load we throw at it.

Hold-up Time
Hold-up time is a very important PSU characteristic and represents the amount of time, usually measured in milliseconds, for which a PSU can maintain output regulations as defined by the ATX specification without input power. In other words, it is the amount of time the system can continue to operate without shutting down or rebooting during a power interruption. The ATX specification sets the minimum hold-up time to 17 ms with the maximum continuous output load.According to the ATX specification, the PWR_OK is a "power good" signal. This signal should be asserted as high, at 5 V, by the power supply to indicate that the +12 V, 5 V, and 3.3 V outputs are within the regulation thresholds and that sufficient mains energy is stored by the APFC converter to guarantee continuous operation within specifications for at least 17 ms. Conversely, PWR_OK should be deasserted to a low state, 0 V, when any of the +12 V, 5 V, or 3.3 V output voltages fall below the under-voltage threshold or when mains power has been removed for a sufficiently long time for the power supply's operation to cease completely. The AC loss to PWR_OK minimum hold-up time is set to 16 ms, which is a shorter period than the hold-up time described in the paragraph above, and the ATX specification also sets a PWR_OK inactive to DC loss delay that should be more than 1 ms. This means that the AC loss to PWR_OK hold-up time should always be lower than the overall hold-up time of the PSU to ensure that the power supply will never continue to send a power good signal while any of the +12 V, 5 V, and 3.3 V rails are out of spec.
In the following screenshots, the blue line is the mains signal, the green line is the "Power Good" signal, and the yellow line represents the +12 V rail.
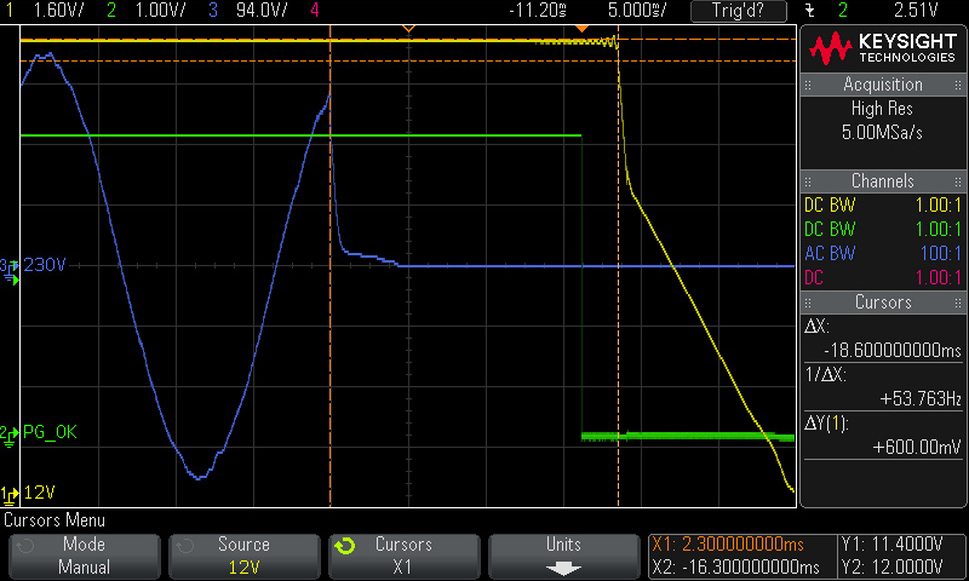
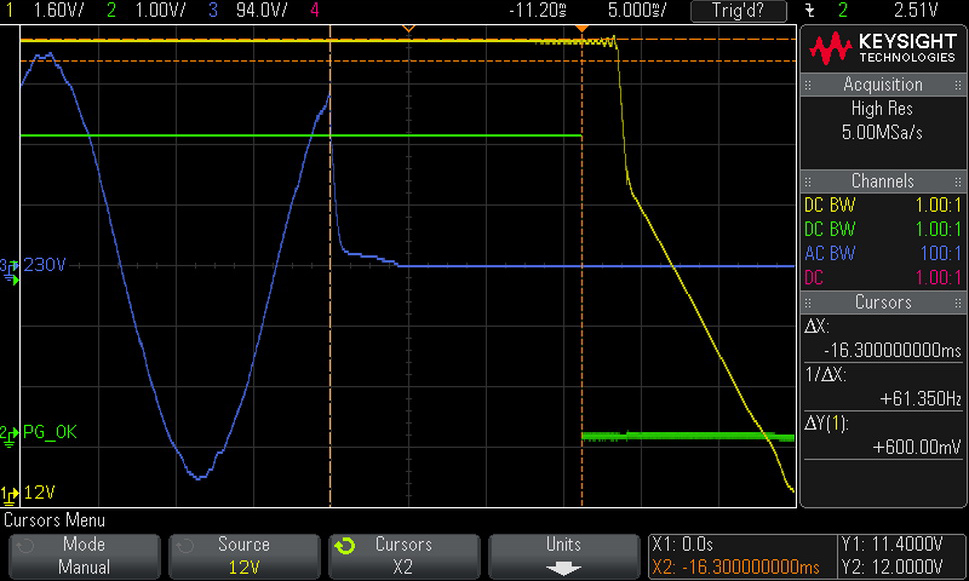
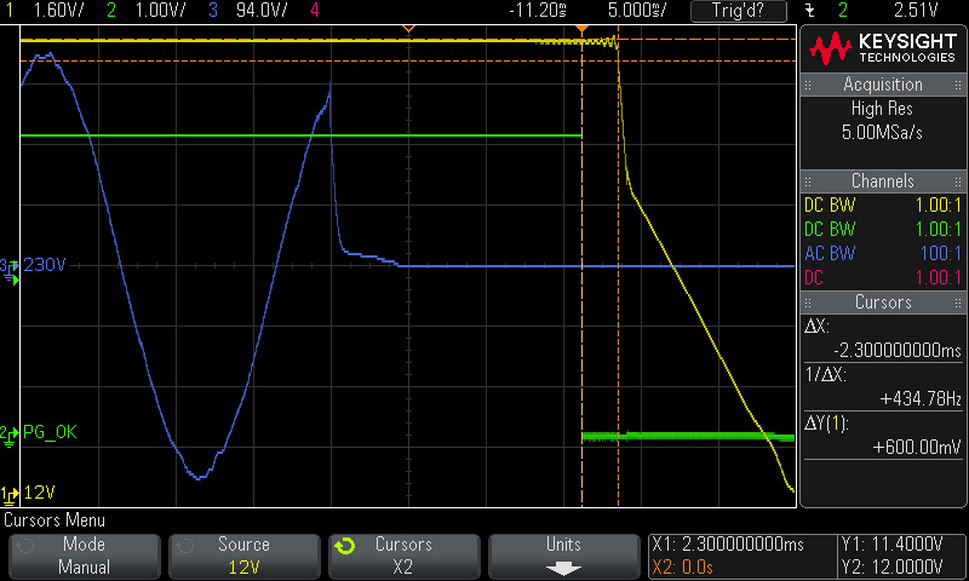


The hold-up time is over 17 ms, and the power ok signal is accurate.
Inrush Current
Inrush current, or switch-on surge, refers to the maximum, instantaneous input-current drawn by an electrical device when it is first turned on. Because of the charging current of the APFC capacitor(s), PSUs produce large inrush current right as they are turned on. Large inrush current can cause the tripping of circuit breakers and fuses and may also damage switches, relays, and bridge rectifiers; as a result, the lower the inrush current of a PSU right as it is turned on, the better.
Inrush current is where it should be given the PSU's capacity.
Load Regulation and Efficiency Measurements
The first set of tests revealed the stability of the voltage rails and the GX-F750's efficiency. The applied load was equal to (approximately) 10%-110% of the maximum load the PSU can handle, in 10% steps.We conducted two additional tests. In the first test, we stressed the two minor rails (5 V and 3.3 V) with a high load while the load at +12V was only 0.10 A. This test reveals whether the PSU is compatible with Intel's C6 and C7 sleep states or not. In the second test, we dialed the maximum load the +12V rail can handle while the load on the minor rails is minimal.
| Load Regulation & Efficiency Testing Data& - Cougar GX-F750 | ||||||||||
|---|---|---|---|---|---|---|---|---|---|---|
| Test | 12 V | 5 V | 3.3 V | 5VSB | Power (DC/AC) | Efficiency | Fan Speed | PSU Noise | Temp (In/Out) | PF/AC Volts |
| 10% Load | 4.340A | 2.002A | 1.969A | 0.981A | 74.831W | 81.733% | 985 RPM | 29.6 dB(A) | 38.11°C | 0.817 |
| 12.267V | 4.999V | 3.348V | 5.088V | 91.555W | 42.42°C | 230.23V | ||||
| 20% Load | 9.763A | 3.001A | 2.962A | 1.181A | 149.778W | 89.850% | 985 RPM | 29.6 dB(A) | 38.51°C | 0.917 |
| 12.180V | 4.990V | 3.340V | 5.078V | 166.697W | 43.10°C | 230.23V | ||||
| 30% Load | 15.538A | 3.509A | 3.474A | 1.380A | 224.905W | 91.335% | 1000 RPM | 29.8 dB(A) | 39.37°C | 0.947 |
| 12.153V | 4.984V | 3.335V | 5.070V | 246.241W | 44.37°C | 230.23V | ||||
| 40% Load | 21.308A | 4.019A | 3.963A | 1.581A | 299.768W | 91.848% | 1060 RPM | 31.3 dB(A) | 40.17°C | 0.957 |
| 12.135V | 4.977V | 3.329V | 5.060V | 326.375W | 45.32°C | 230.29V | ||||
| 50% Load | 26.748A | 5.030A | 4.963A | 1.781A | 374.718W | 91.873% | 1140 RPM | 33.6 dB(A) | 40.81°C | 0.964 |
| 12.122V | 4.970V | 3.321V | 5.052V | 407.866W | 46.29°C | 230.29V | ||||
| 60% Load | 32.194A | 6.048A | 5.971A | 1.981A | 449.691W | 91.665% | 1235 RPM | 36.2 dB(A) | 41.20°C | 0.967 |
| 12.111V | 4.963V | 3.314V | 5.041V | 490.579W | 47.24°C | 230.24V | ||||
| 70% Load | 37.647A | 7.060A | 6.981A | 2.186A | 524.609W | 91.302% | 1320 RPM | 37.5 dB(A) | 42.19°C | 0.970 |
| 12.100V | 4.956V | 3.308V | 5.031V | 574.587W | 48.57°C | 230.26V | ||||
| 80% Load | 43.108A | 8.088A | 7.997A | 2.386A | 599.616W | 90.867% | 1415 RPM | 39.5 dB(A) | 42.98°C | 0.973 |
| 12.091V | 4.949V | 3.300V | 5.021V | 659.885W | 49.85°C | 230.26V | ||||
| 90% Load | 48.999A | 8.601A | 8.525A | 2.391A | 674.642W | 90.399% | 1518 RPM | 41.1 dB(A) | 43.13°C | 0.975 |
| 12.083V | 4.943V | 3.294V | 5.015V | 746.293W | 50.64°C | 230.28V | ||||
| 100% Load | 54.645A | 9.119A | 9.027A | 3.000A | 749.496W | 89.787% | 1550 RPM | 42.7 dB(A) | 44.29°C | 0.976 |
| 12.074V | 4.937V | 3.290V | 4.998V | 834.746W | 52.21°C | 230.28V | ||||
| 110% Load | 60.880A | 9.131A | 9.041A | 3.000A | 824.385W | 89.237% | 1560 RPM | 42.8 dB(A) | 44.84°C | 0.977 |
| 12.068V | 4.930V | 3.284V | 4.993V | 923.813W | 53.60°C | 230.29V | ||||
| Crossload 1 | 0.099A | 18.030A | 18.002A | 0.004A | 150.529W | 85.374% | 1245 RPM | 36.4 dB(A) | 41.62°C | 0.923 |
| 12.176V | 4.964V | 3.322V | 5.090V | 176.318W | 47.46°C | 230.26V | ||||
| Crossload 2 | 61.965A | 1.002A | 1.003A | 1.002A | 761.682W | 90.185% | 1545 RPM | 42.2 dB(A) | 43.17°C | 0.976 |
| 12.077V | 4.952V | 3.304V | 5.045V | 844.579W | 50.48°C | 230.29V | ||||
Load regulation is not that tight at +12V, and the same is the case with the 5V and 3.3V rails. It is satisfactory, though, since deviations remain within 2%. This sample did not have a problem delivering its full power (and even more) at 45°C; however, under increased operating temperatures, the fan profile pushes the fan hard, to high speeds, which means it is not that quiet. However, things would be much worse had HEC used a higher-speed fan, which is thankfully not the case.
Jul 12th, 2025 03:36 CDT
change timezone
Latest GPU Drivers
New Forum Posts
- What's your latest tech purchase? (24237)
- What are you playing? (23921)
- Can you guess Which game it is? (226)
- Gigabyte graphic cards - TIM gel SLIPPAGE problem (144)
- [Intel AX1xx/AX2xx/AX4xx/AX16xx/BE2xx/BE17xx] Intel Modded Wi-Fi Driver with Intel® Killer™ Features (367)
- NVIDIA RTX PRO 6000 Workstation Runs Much Hotter Than 5090 FE (22)
- 3D Printer Club (539)
- Will you buy a RTX 5090? (644)
- [GPU-Z Test Build] New Kernel Driver, Everyone: Please Test (89)
- No offense, here are some things that bother me about your understanding of fans. (34)
Popular Reviews
- Fractal Design Epoch RGB TG Review
- Corsair FRAME 5000D RS Review
- Lexar NM1090 Pro 4 TB Review
- NVIDIA GeForce RTX 5050 8 GB Review
- NZXT N9 X870E Review
- Sapphire Radeon RX 9060 XT Pulse OC 16 GB Review - An Excellent Choice
- AMD Ryzen 7 9800X3D Review - The Best Gaming Processor
- Our Visit to the Hunter Super Computer
- Upcoming Hardware Launches 2025 (Updated May 2025)
- Chieftec Iceberg 360 Review
TPU on YouTube
Controversial News Posts
- Intel's Core Ultra 7 265K and 265KF CPUs Dip Below $250 (288)
- Some Intel Nova Lake CPUs Rumored to Challenge AMD's 3D V-Cache in Desktop Gaming (140)
- AMD Radeon RX 9070 XT Gains 9% Performance at 1440p with Latest Driver, Beats RTX 5070 Ti (131)
- NVIDIA Launches GeForce RTX 5050 for Desktops and Laptops, Starts at $249 (119)
- NVIDIA GeForce RTX 5080 SUPER Could Feature 24 GB Memory, Increased Power Limits (115)
- Microsoft Partners with AMD for Next-gen Xbox Hardware (105)
- Intel "Nova Lake‑S" Series: Seven SKUs, Up to 52 Cores and 150 W TDP (100)
- NVIDIA DLSS Transformer Cuts VRAM Usage by 20% (97)