 14
14
Darmoshark M3 Review
Software & Battery Life »Sensor and Performance
The Darmoshark M3 is equipped with the PixArt PAW3395. According to specifications, the 3395 is capable of up to 26,000 CPI, as well as a maximum tracking speed of 650 IPS, which equals 16.51 m/s. Out of the box, five pre-defined CPI steps are available: 400, 800, 1600, 3200, and 4800.CPI Accuracy
"CPI" (short for counts per inch) describes the number of counts registered by the mouse if it is moved exactly an inch. There are several factors (firmware, mounting height of the sensor not meeting specifications, mouse feet thickness, mousing surface, among others) which may contribute to nominal CPI not matching actual CPI. It is impossible to always achieve a perfect match, but ideally, nominal and actual CPI should differ as little as possible. In this test, I'm determining whether this is the case or not. However, please keep in mind that said variance will still differ from unit to unit, so your mileage may vary.
I've restricted my testing to the four most common CPI steps, which are 400, 800, 1600, and 3200. As you can see, deviation is consistently positive and very large, which is a poor result overall. In order to account for the measured deviation, adjusted steps of 350, 700, 1450, and 2850 CPI have been used for testing.
Motion Delay
"Motion delay" encompasses all kinds of sensor lag. Any further sources of input delay will not be recorded in this test. The main thing I'll be looking for in this test is sensor smoothing, which describes an averaging of motion data across several capture frames, in order to reduce jitter at higher CPI values, increasing motion delay along with it. The goal here is to have as little smoothing as possible. As there is no way to accurately measure motion delay absolutely without special equipment, it is done by comparison with a control subject that has been determined to have consistent and low motion delay. In this case, the control subject is a Logitech G403, whose PMW3366 sensor has no visible smoothing across the entire CPI range. Note that the G403 is moved first and thus receives a slight head start.Testing is restricted to 2.4 GHz mode as Bluetooth is not suitable for non-casual gaming applications.
For the record, the Bluetooth connection isn't entirely stable on my system.
Wired testing
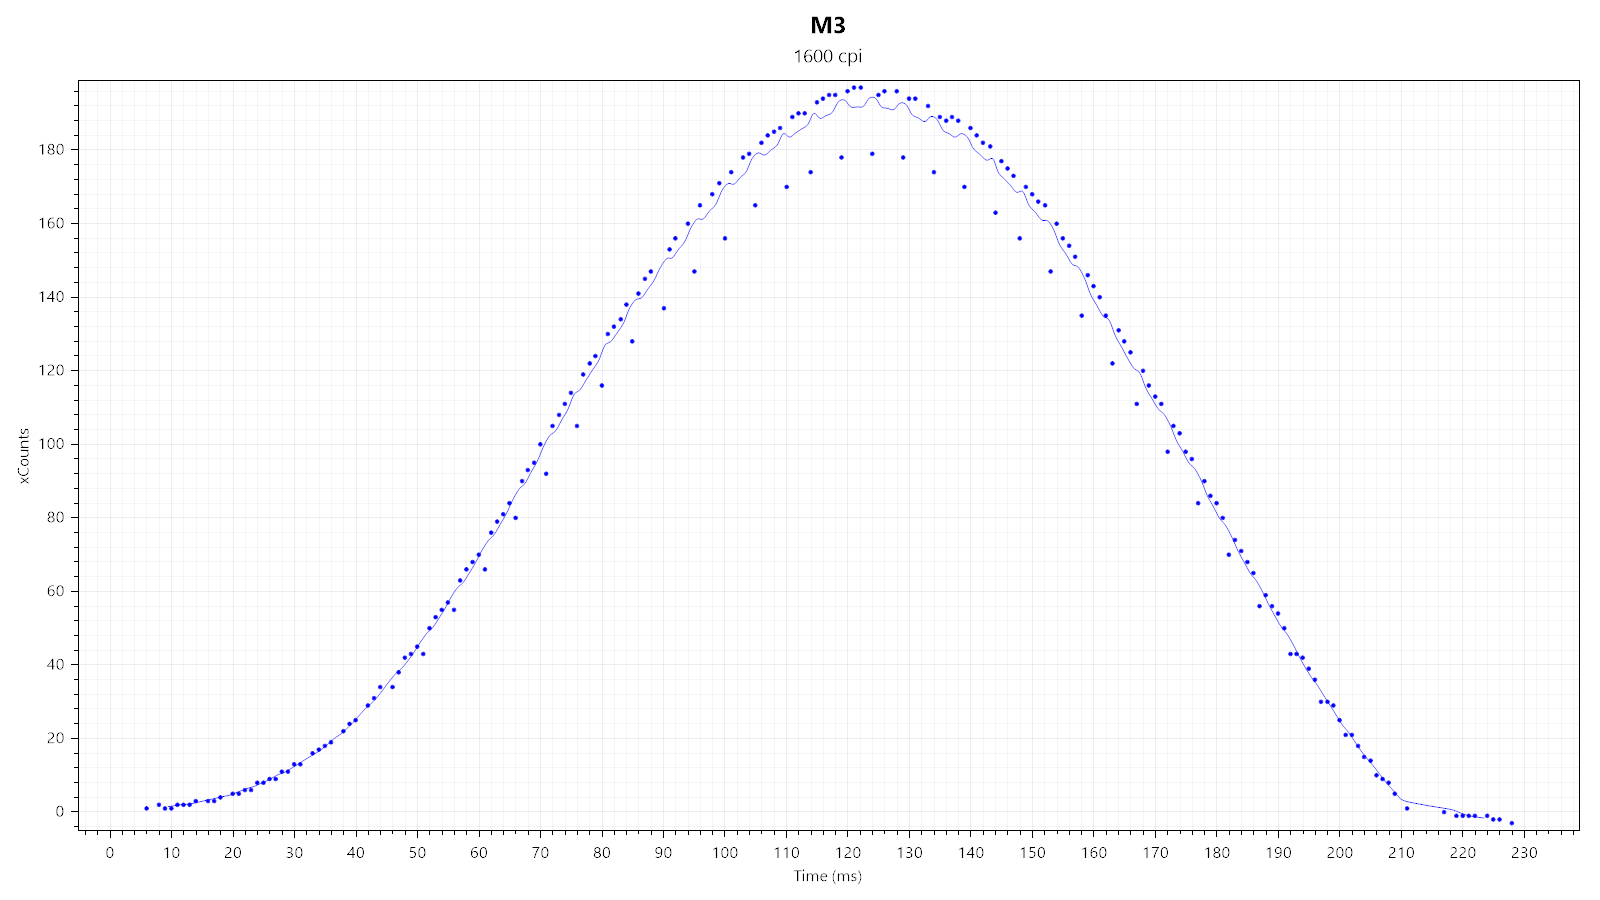

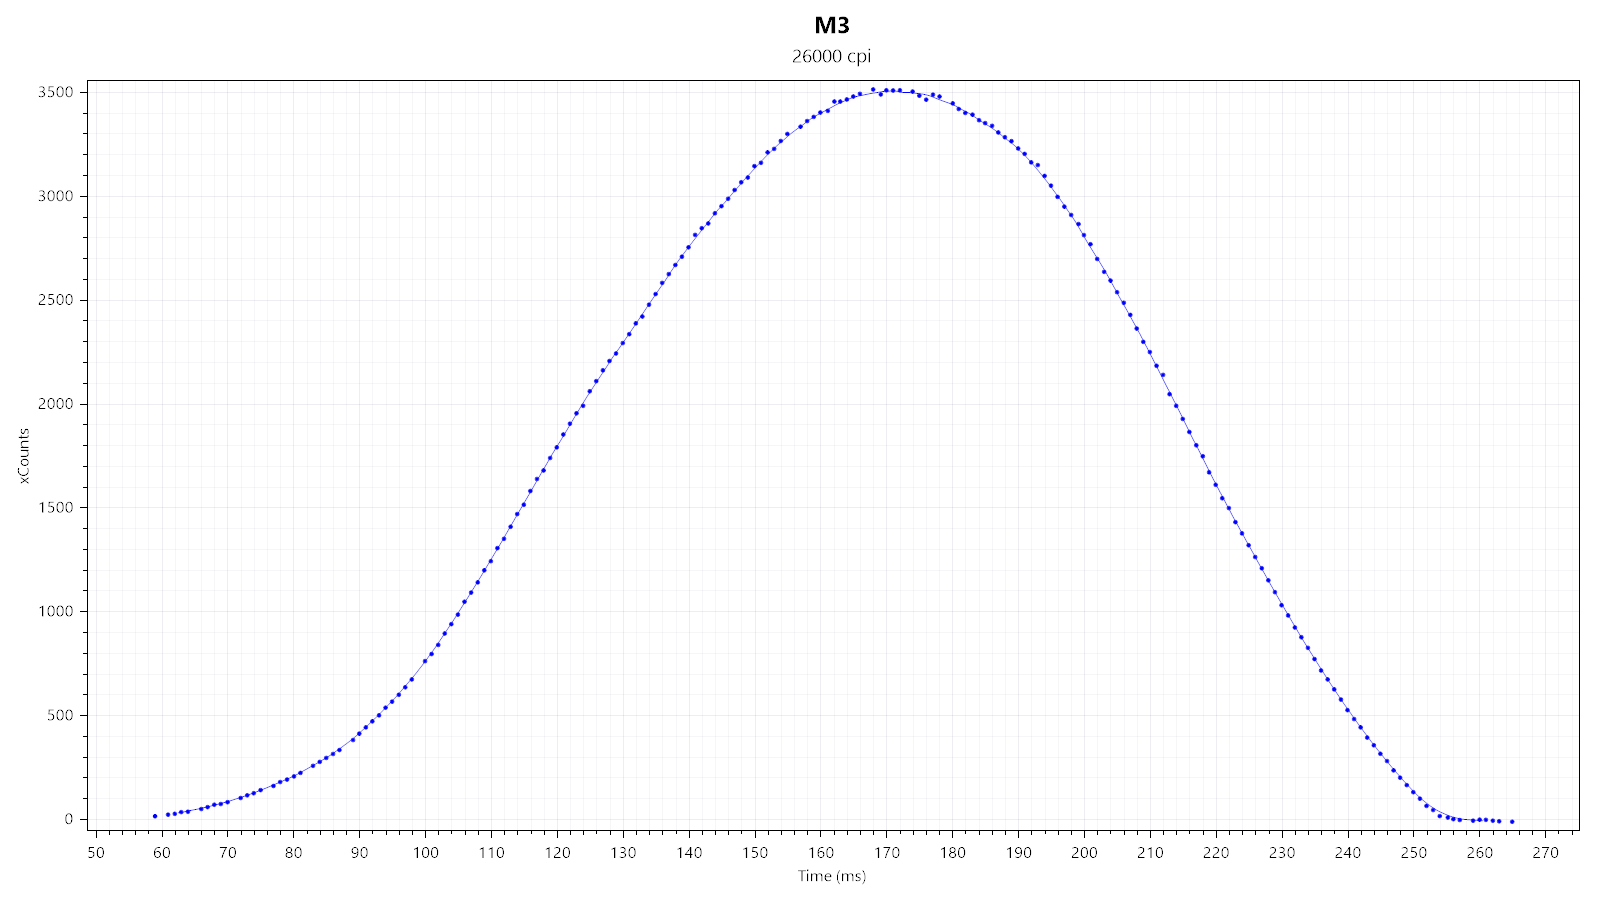
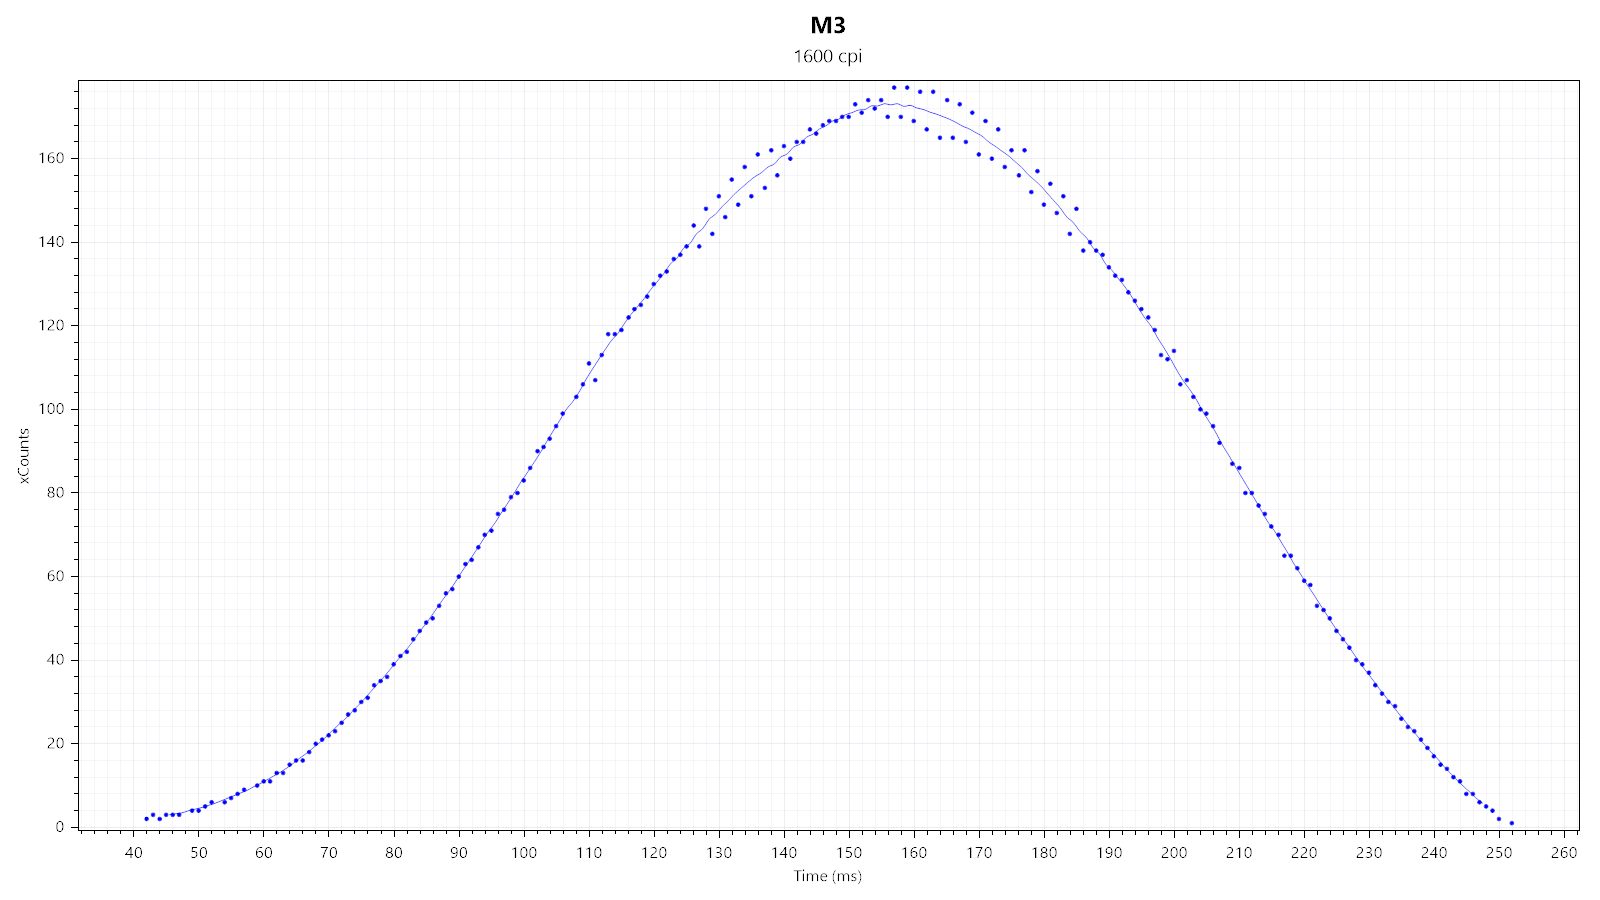
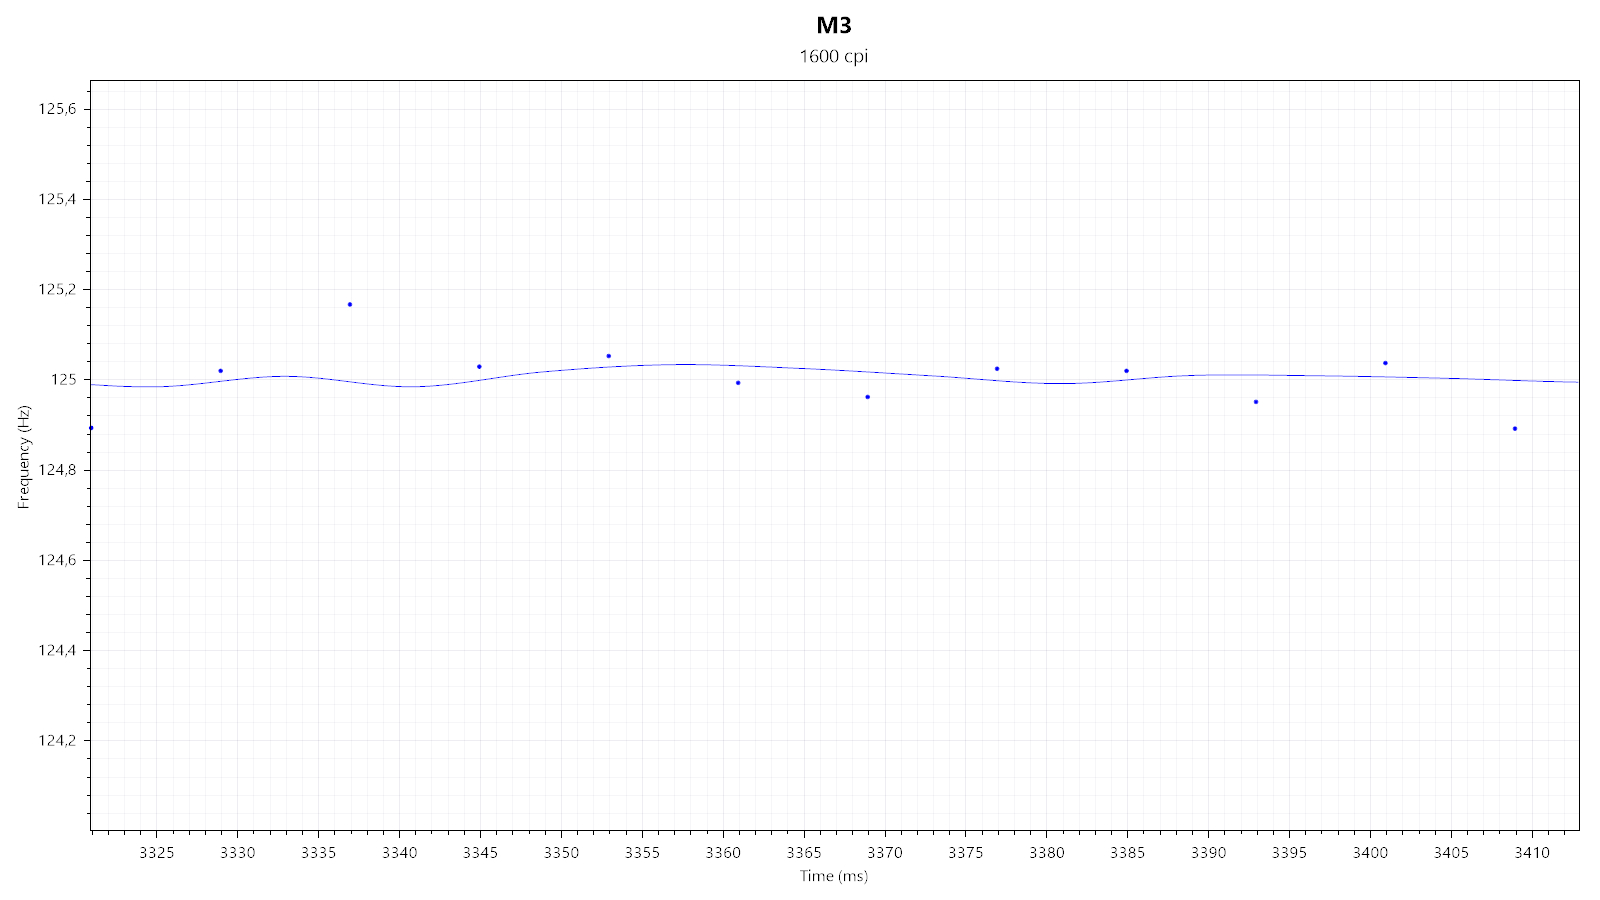
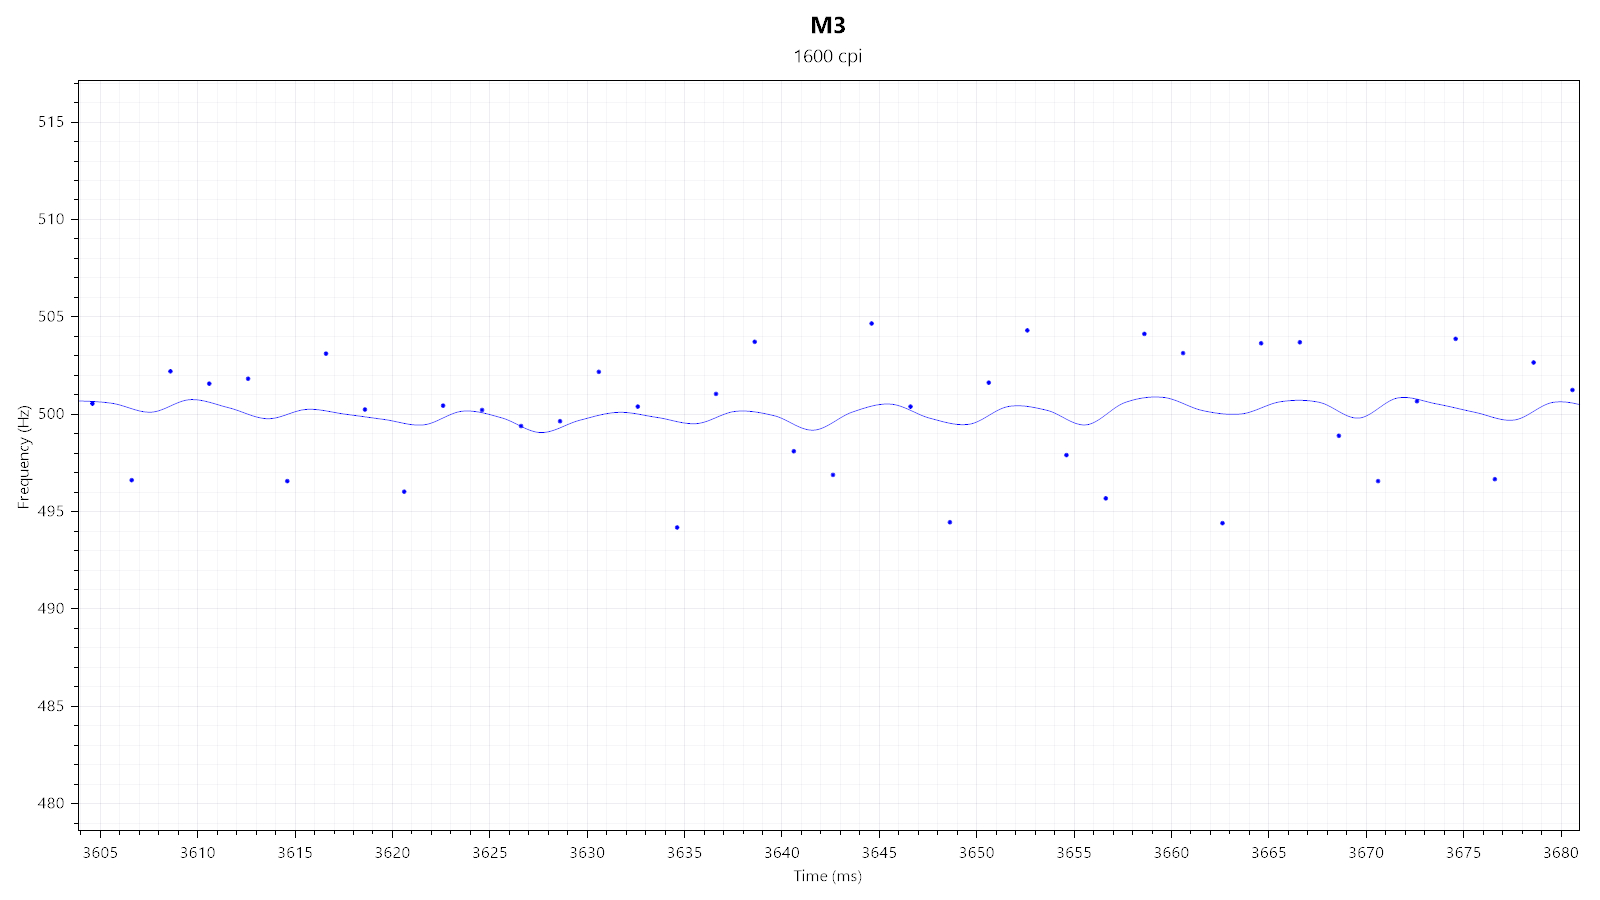
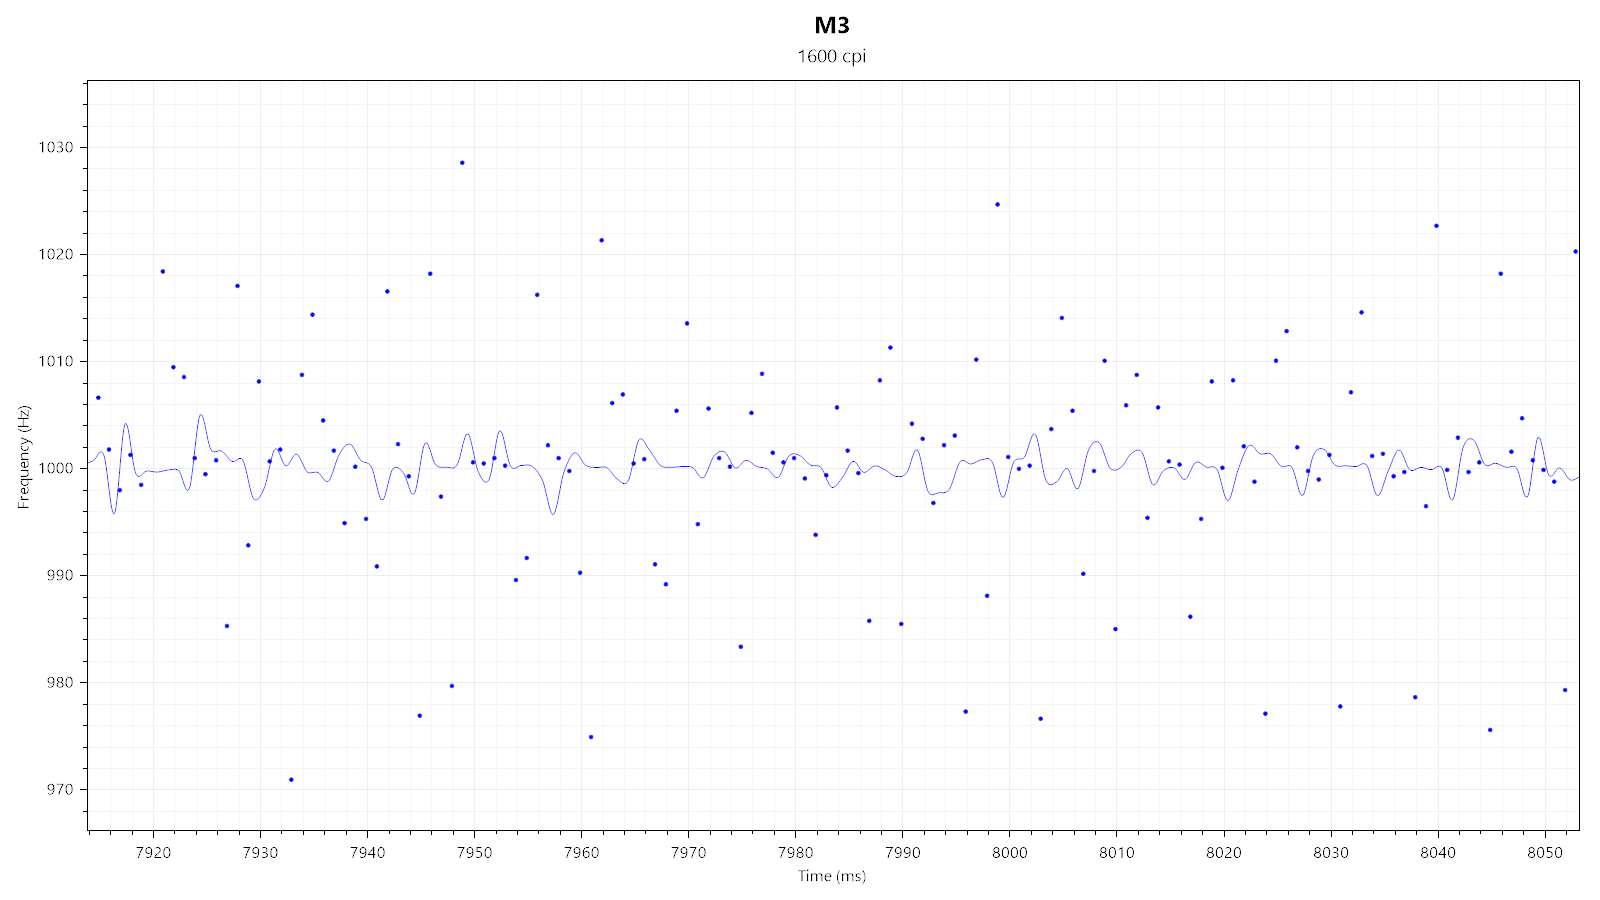
First, I'm looking at two xCounts plots—generated at 1600 and 26,000 CPI—to quickly gauge whether there is any smoothing, which would be indicated by any visible "kinks." As you can see, neither plot shows any, which strongly suggests there not being any smoothing.

Furthermore, the M3 allows enabling MotionSync, which reduces SPI timing jitter.


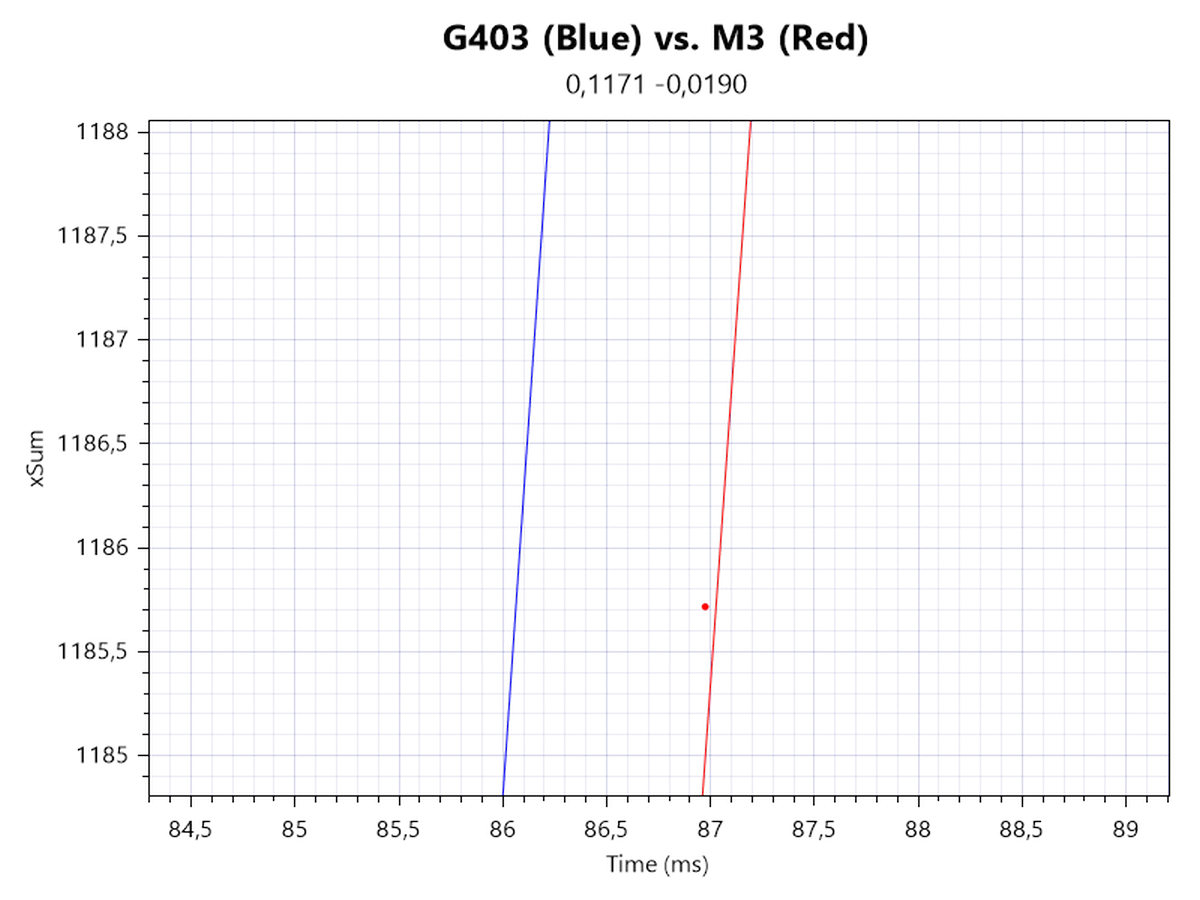
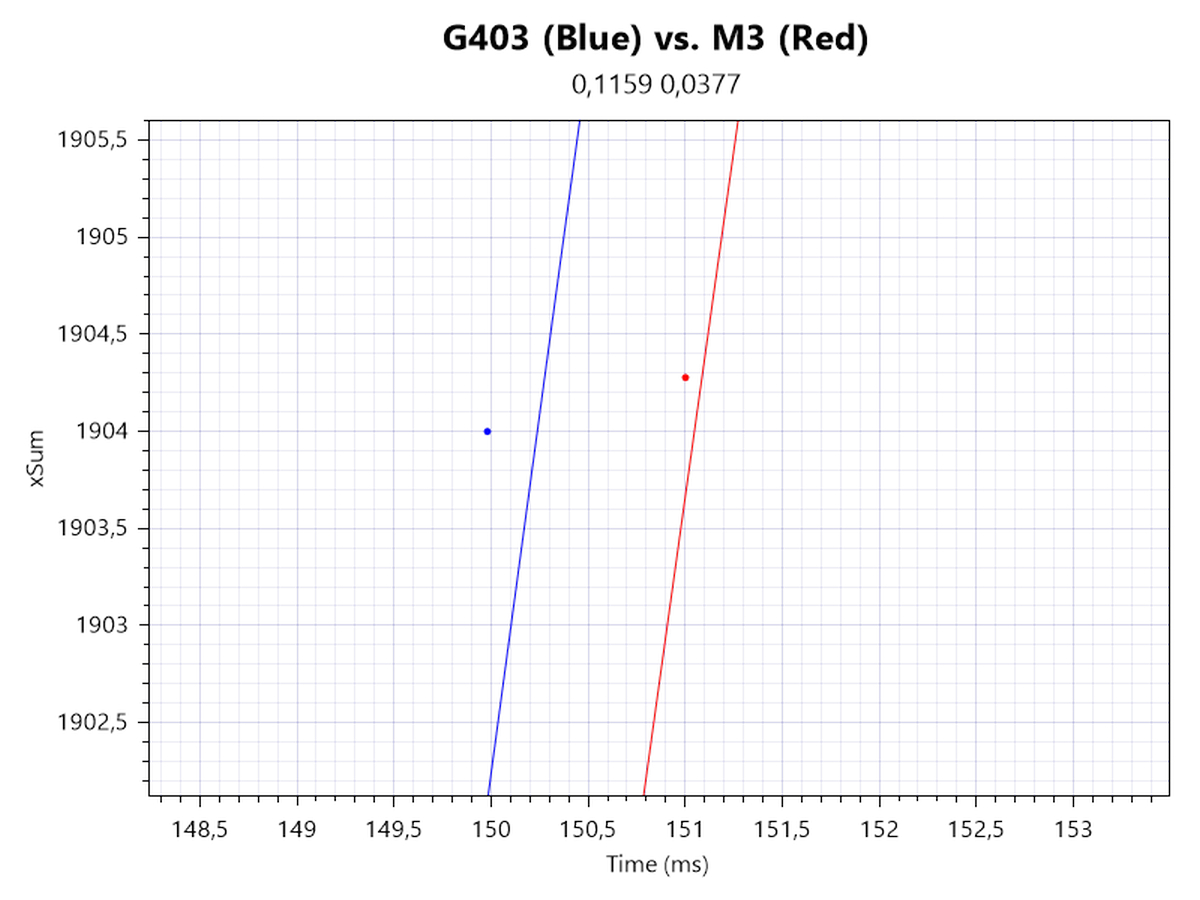
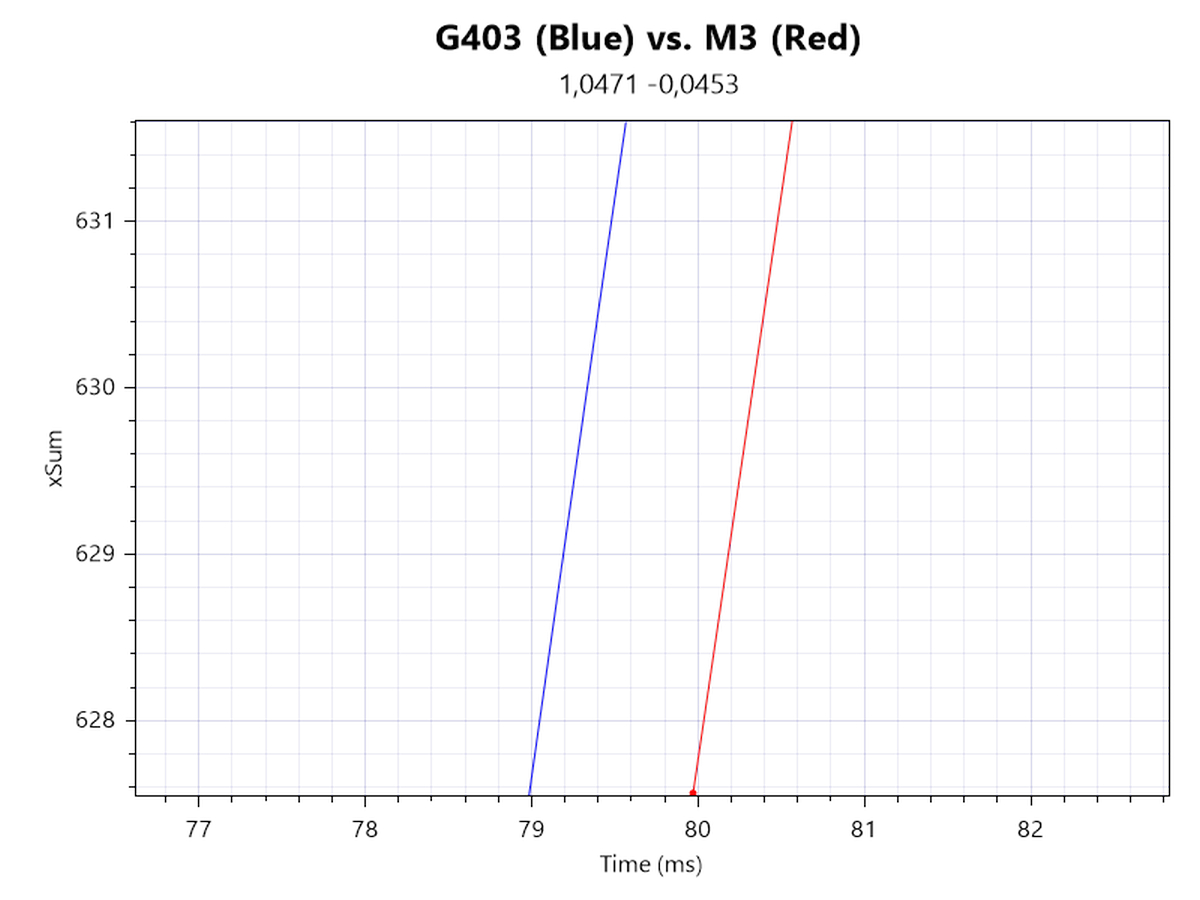
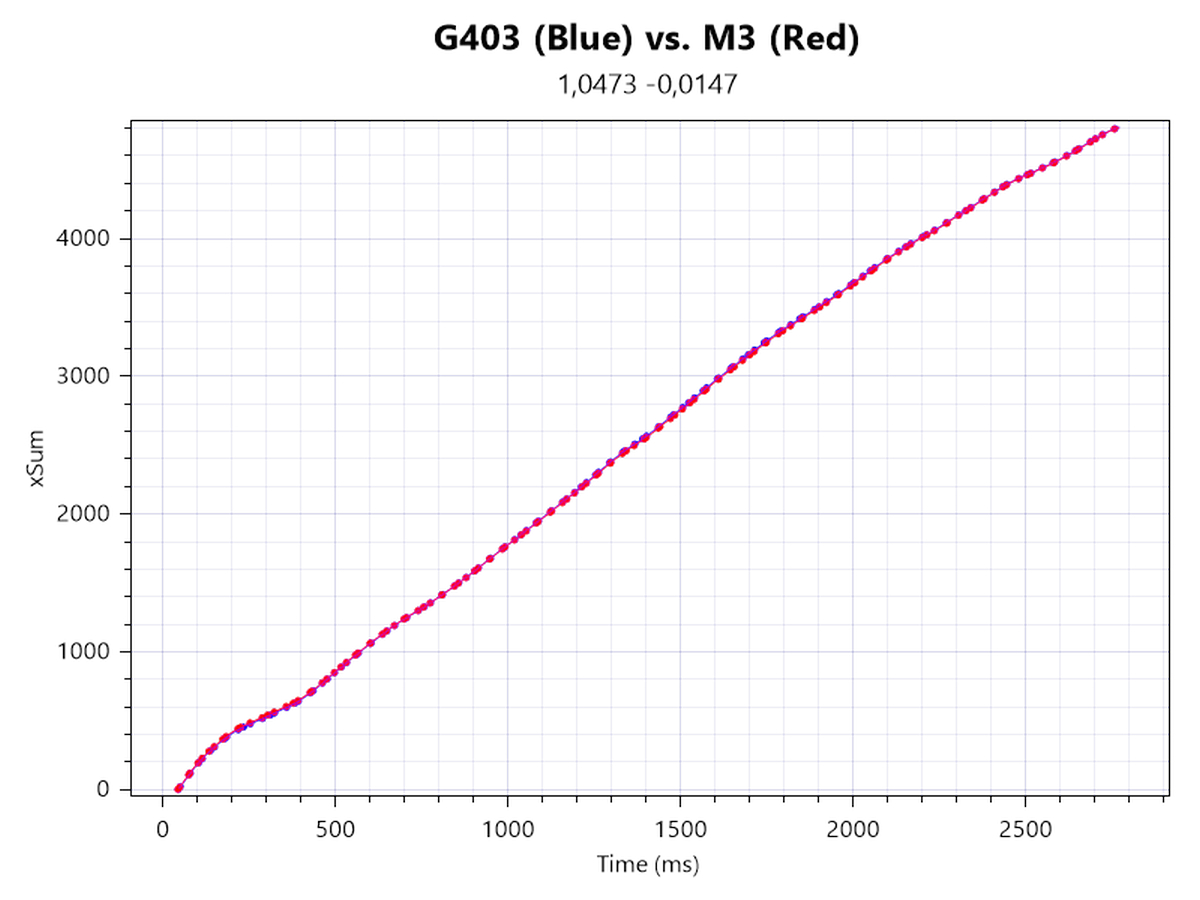
In order to determine motion delay, I'm looking at xSum plots generated at 1600, 26,000, and 26,000 CPI with ripple control enabled. The line further to the left denotes the sensor with less motion delay. There is no motion delay differential at either step, and ripple control merely adds 1 ms of motion delay.


Upon enabling MotionSync, motion delay may be increased by up to 0.5 ms.
Wireless testing


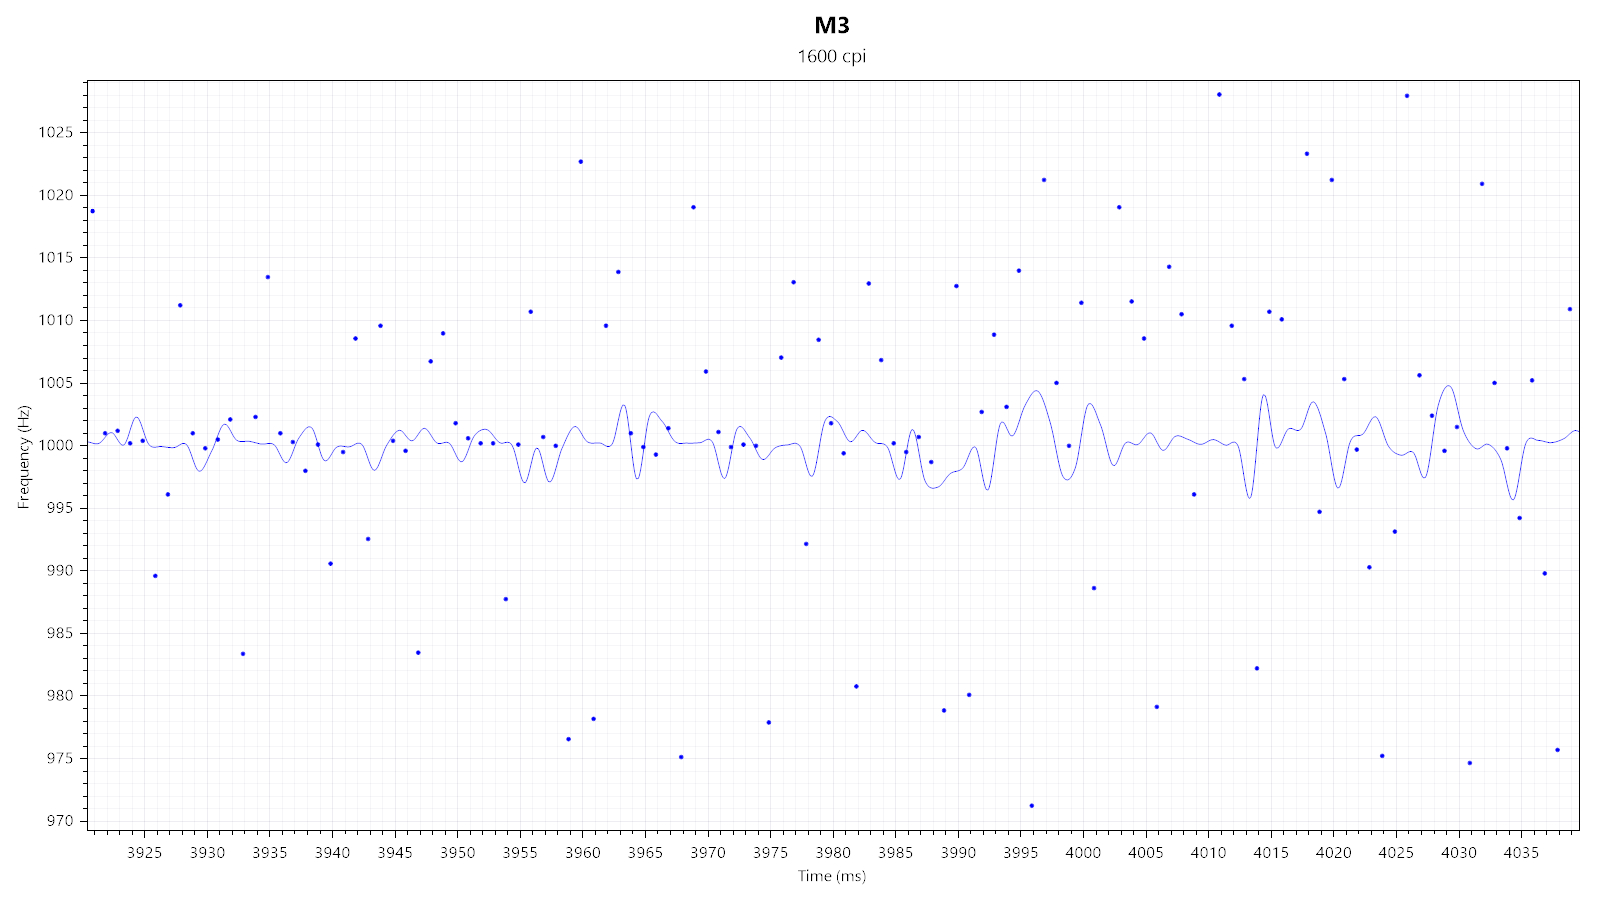
Not much changes when running the M3 in wireless mode, as SPI timing jitter and general tracking are virtually on the same level as when wired.

Yet again, enabling MotionSync reduces SPI timing jitter.

Once again, 1600 and 26,000 CPI are tested. At both 1600 and 26,000 CPI, I can measure a wireless motion delay differential of around 0.5–1 ms.

Upon enabling MotionSync, motion delay may be increased by up to 0.5 ms.

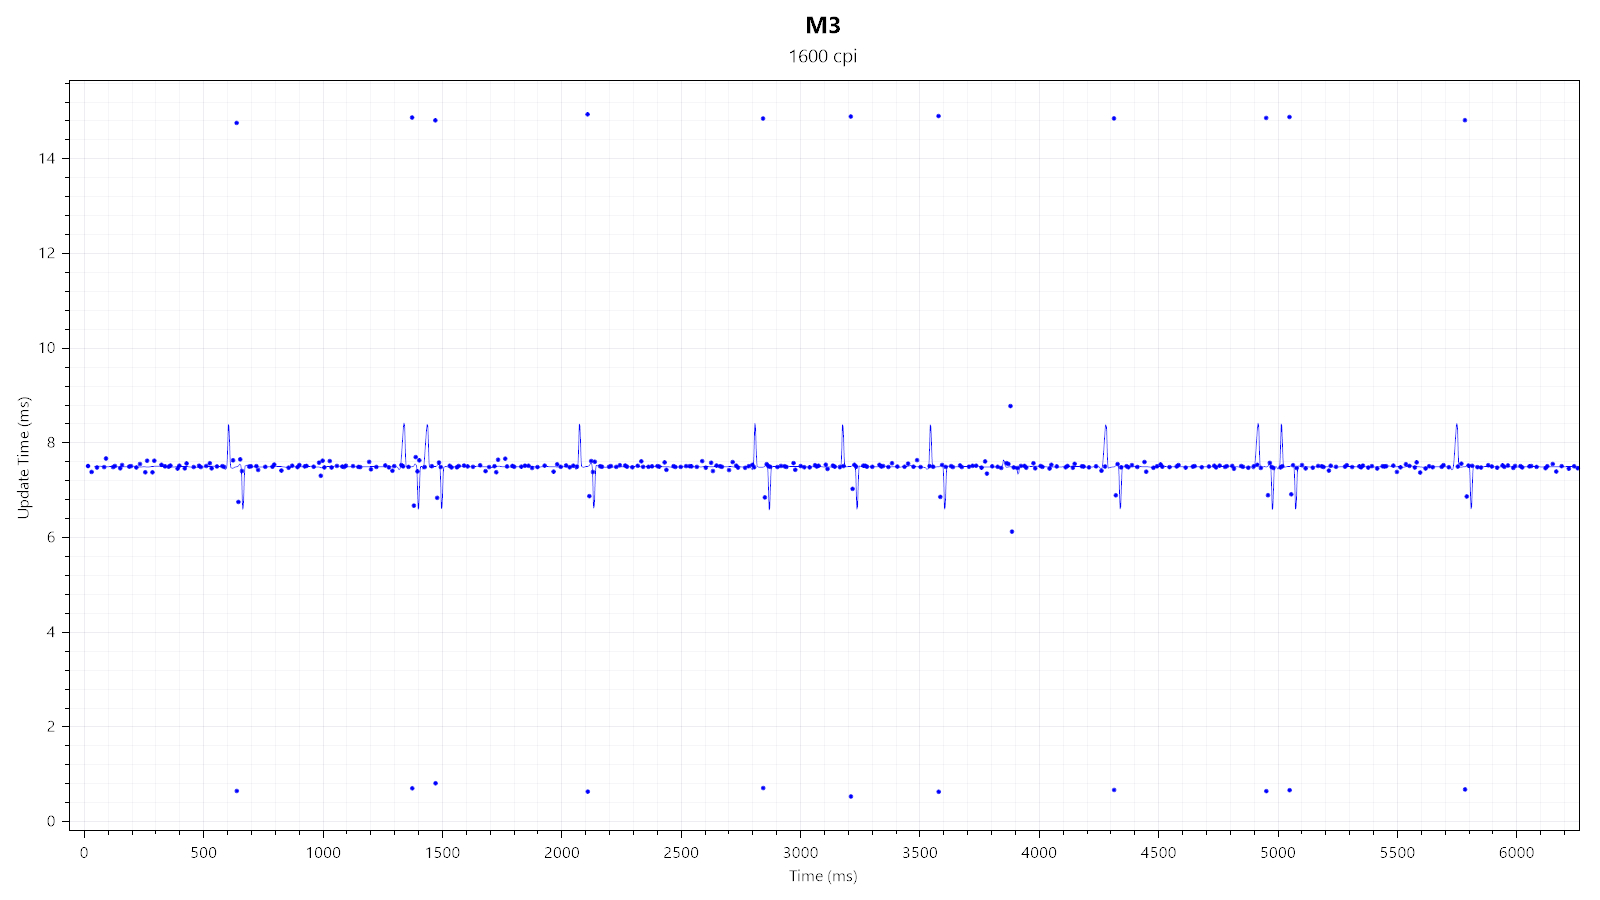
A rather curious behavior previously encountered on several releases from Razer (DeathAdder V2 Pro, V3 Pro, Viper V2 Pro, Naga V2 Pro, among others) as well as the VAXEE XE Wireless, is present on the M3 as well. At any point during the motion, though typically towards the start, motion delay is increased by several intervals (at least 3 ms, and up to 6 ms), which is maintained through the motion. This happens almost exclusively in wireless mode and regardless of whether MotionSync is active. Compared to the aforementioned mice, this shift behavior occurs more frequently on the M3. I'm unable to reproduce this behavior consistently.


Upon closer inspection, it becomes clear that any of these shifts correlates with an off-period poll.
Speed-related Accuracy Variance (SRAV)
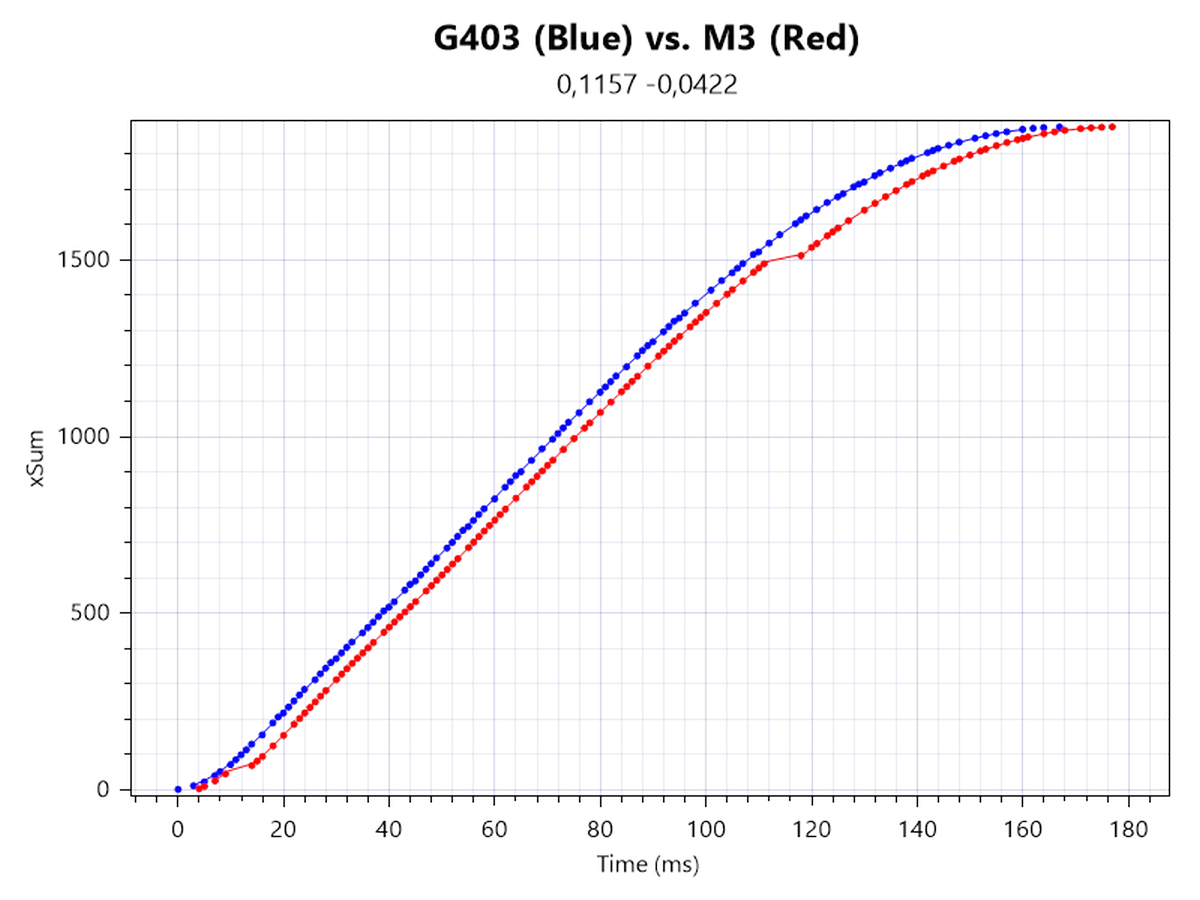
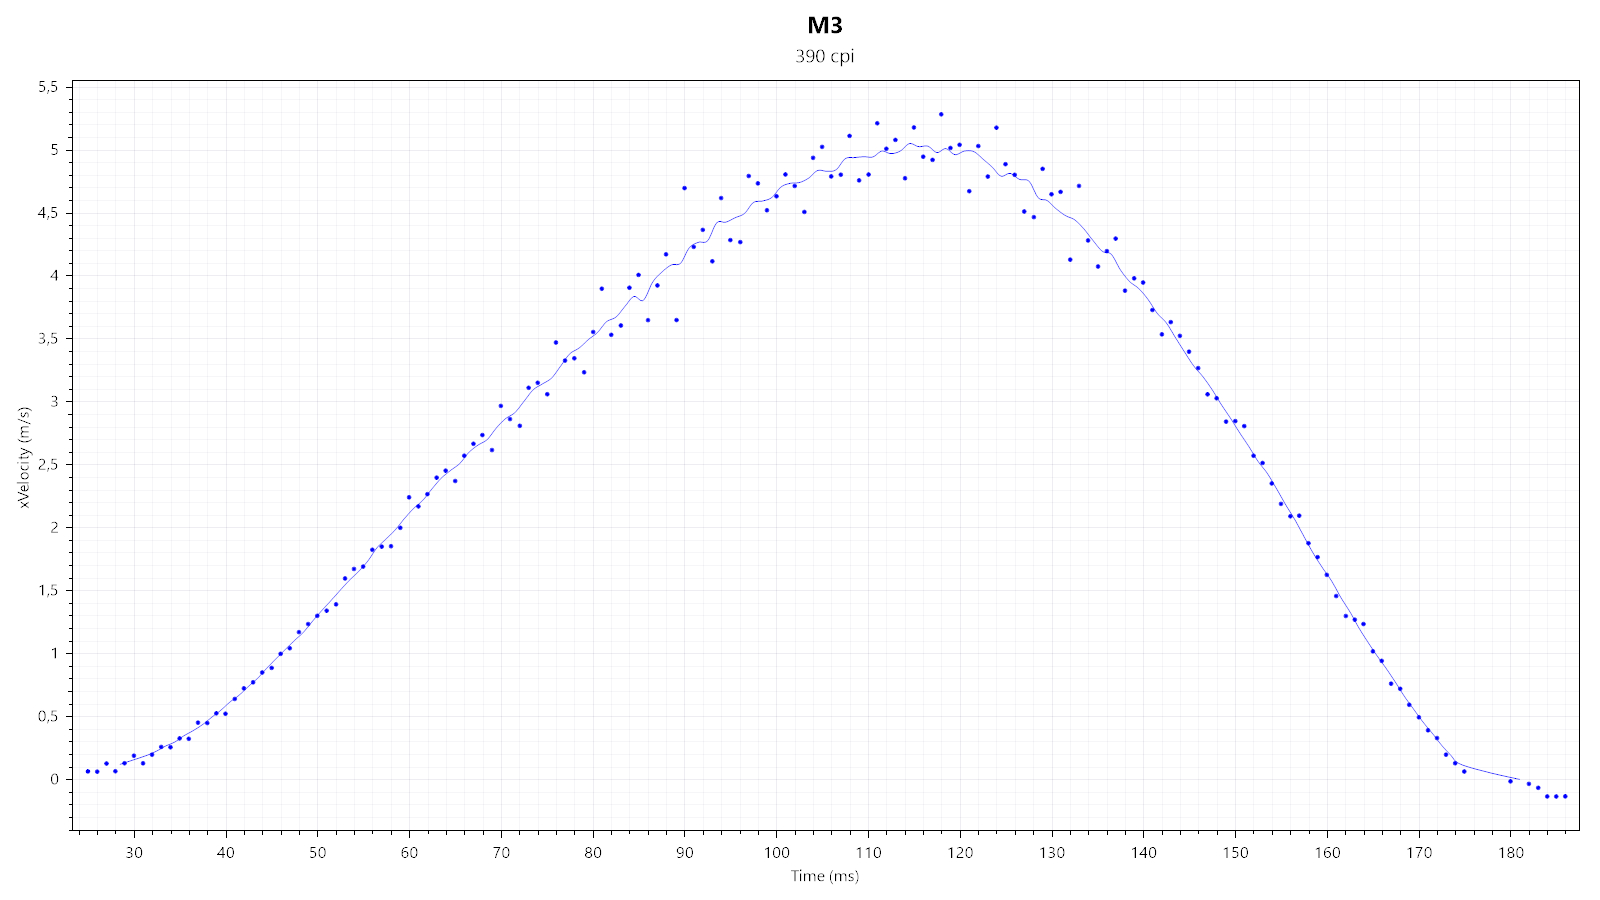
What people typically mean when they talk about "acceleration" is speed-related accuracy variance (or SRAV). It's not about the mouse having a set amount of inherent positive or negative acceleration, but about the cursor not traveling the same distance if the mouse is moved the same physical distance at different speeds. The easiest way to test this is by comparison with a control subject that is known to have very low SRAV, which in this case is the G403. As you can see from the plot, no displacement between the two cursor paths can be observed, which confirms that SRAV is very low.
Perfect Control Speed
Perfect Control Speed (or PCS for short) is the maximum speed up to which the mouse and its sensor can be moved without the sensor malfunctioning in any way. I've only managed to hit a measly 5 m/s, which is within the proclaimed PCS range and causes no observable sensor malfunction.
Polling Rate Stability
Considering the M3 is usable as a wired mouse as well, I'll be testing polling rate stability for both wired and wireless use.Wired testing


All of the available polling rates (125, 500, and 1000 Hz) look and perform fine.
Wireless testing
For wired mice, polling rate stability merely concerns the wired connection between the mouse (SPI communication) and USB. For wireless mice, another device that needs to be kept in sync between the first two is added to the mix: the wireless dongle/wireless receiver. I'm unable to measure all stages of the entire end-to-end signal chain individually, so testing polling-rate stability at the endpoint (the USB) has to suffice here.
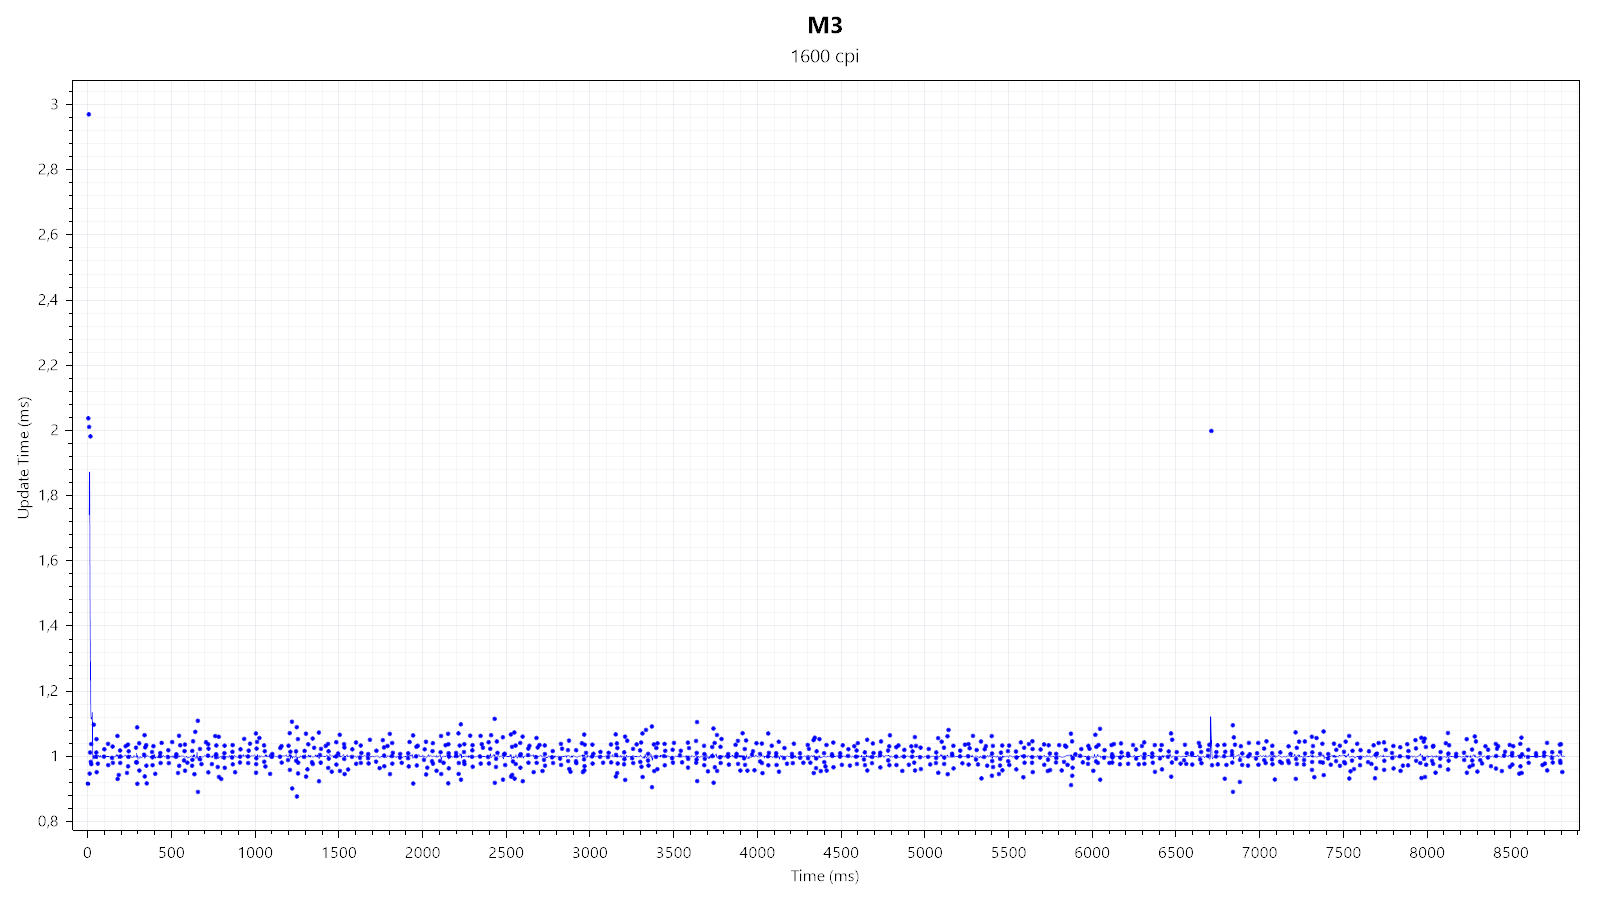
First, I'm testing whether SPI, wireless, and USB communication are synchronized. Any of these being out of sync would be indicated by at least one 2 ms report, which would be the result of any desynchronization drift accumulated over time. Occasionally, such 2 ms polls are visible, which may point towards a desynchronization drift.
Second, I'm testing the general polling-rate stability of the individual polling rates in wireless mode. Running the M3 at a lower polling rate can have the benefit of extending battery life. All polling rates look and perform fine.
Paint Test
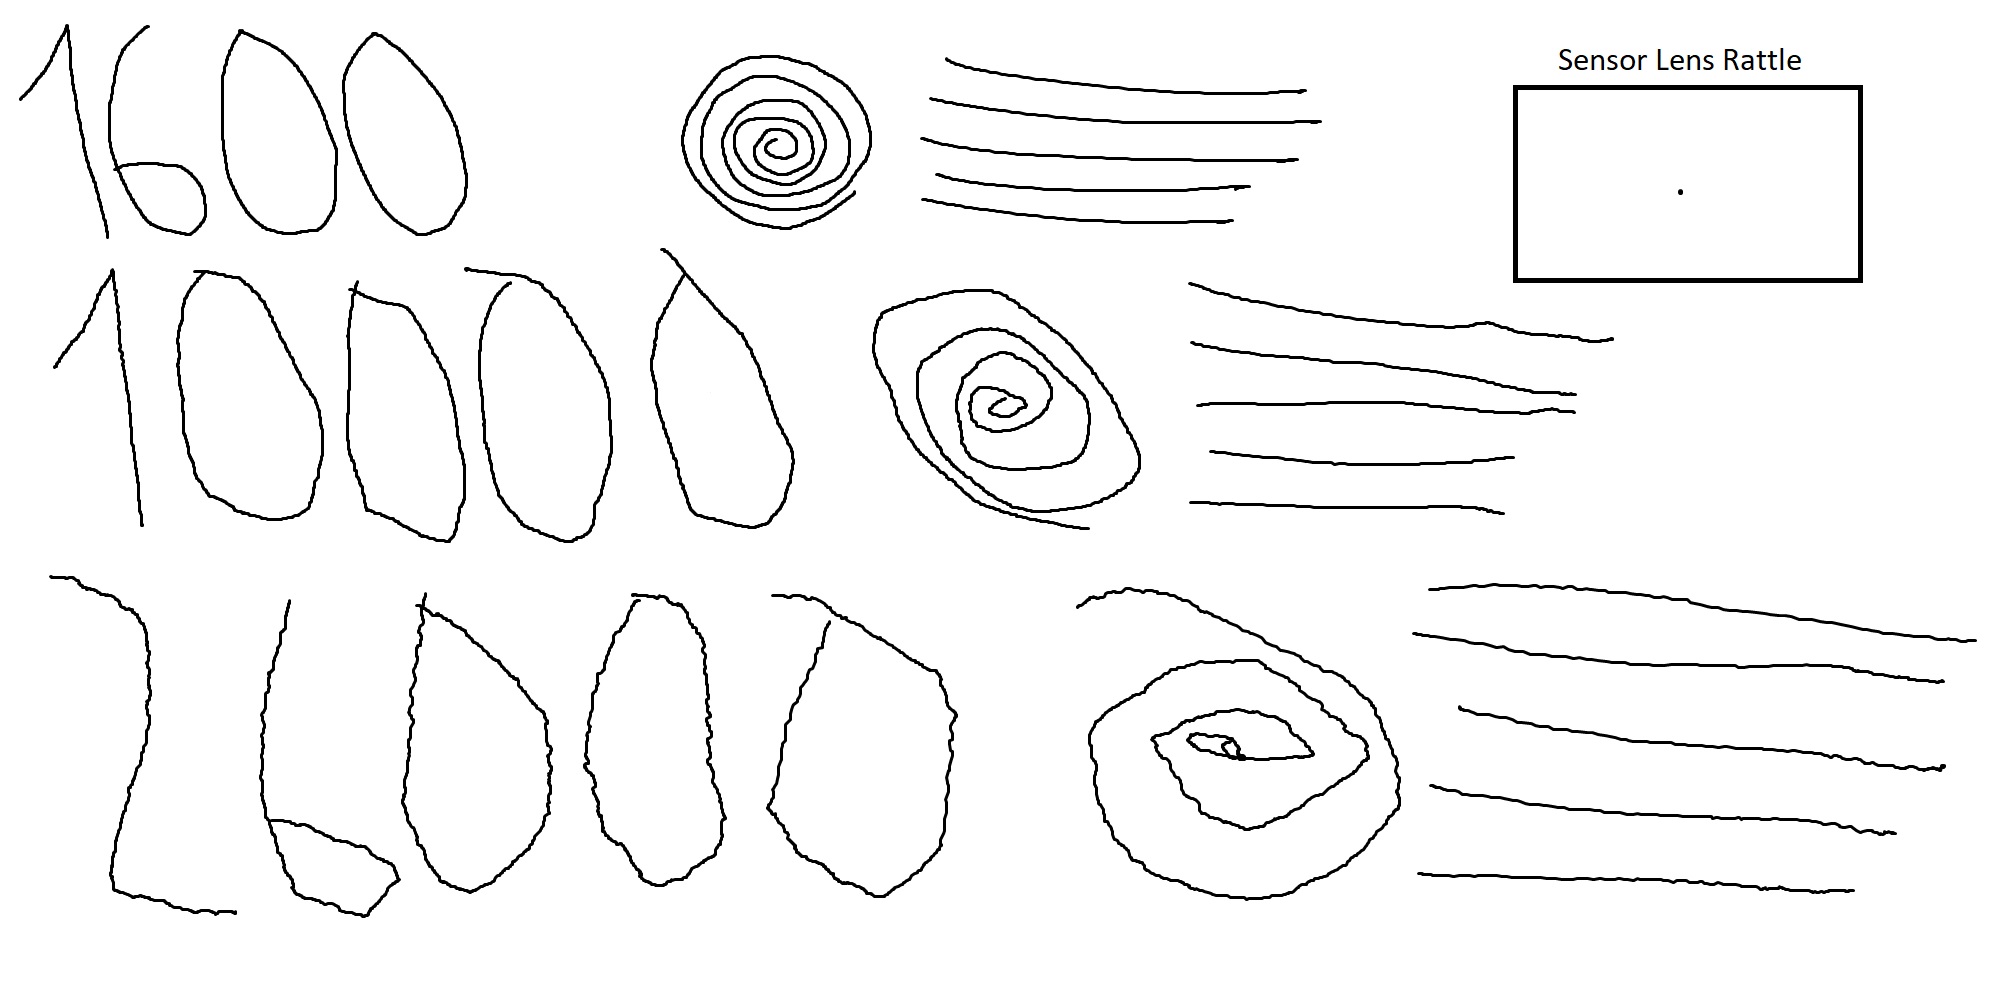
This test is used to indicate any potential issues with angle snapping (non-native straightening of linear motion) and jitter, along with any sensor lens rattle. As you can see, no issues with angle snapping can be observed. There is no jitter visible at 1600 CPI. 10,000 CPI already shows moderate jitter, which is amplified to major levels at 26,000 CPI. This is in line with what to expect from a sensor lacking any smoothing. Lastly, there is no lens movement.
Lift-off Distance
The M3 offers two pre-defined LOD levels. On the "Low" setting, the sensor does not track at a height of 1 DVD. Using the "High" setting, the sensor does track at a height of 1 DVD, but not at a height of 2 DVDs (1.2<x<2.4 mm; x=LOD height). Keep in mind that LOD may vary slightly depending on the mousing surface (pad) it is being used on.Click Latency

In most computer mice, debouncing is required to avoid double clicks, slam-clicks, or other unintended effects of switch bouncing. Debouncing typically adds a delay, which, along with any potential processing delay, shall be referred to as click latency. In order to measure click latency, the mouse has been interfaced with an NVIDIA LDAT (Latency Display Analysis Tool). Many thanks go to NVIDIA for providing an LDAT device. More specifically, the LDAT measures the time between the electrical activation of the left main button and the OS receiving the button-down message. Unless noted otherwise, the values presented in the graph refer to the lowest click latency possible on the mouse in question. If a comparison mouse is capable of both wired and wireless operation, only the result for wireless (2.4 GHz) operation will be listed.
In wired mode and using a debounce time of 0 ms, click latency has been measured to be 1.5 ms, with standard deviation being 0.29 ms. Using a debounce time of 1 ms, click latency has been measured to be 2.4 ms, with standard deviation being 0.28 ms. Finally, using a debounce time of 4 ms, click latency has been measured to be 4.8 ms, with standard deviation being 0.36 ms.
In wireless mode and using a debounce time of 0 ms, click latency has been measured to be 1.9 ms, with standard deviation being 0.33 ms. Using a debounce time of 1 ms, click latency has been measured to be 2.9 ms, with standard deviation being 0.39 ms. Finally, using a debounce time of 4 ms, click latency has been measured to be 5.8 ms, with standard deviation being 0.41 ms.
Please note that the values above represent ideal results, as occasionally, outliers are present, which increase standard deviation in particular significantly. In addition, there appears to be some idle delay added, as with an interval of 6 seconds between samples, the average is increased by around 2 ms.
The main button switches were measured to be running at 3.3 V. I'm not aware of the voltage specifications of the Kailh GM 8.0 (80 M) switches, but I consider it very likely that these are running within specifications.
Jul 19th, 2025 01:03 CDT
change timezone
Latest GPU Drivers
New Forum Posts
- VMware Workstation is now free for personal use (20)
- What's your latest tech purchase? (24312)
- 9060 XT 8GB or 5060 8GB? (35)
- question for everyone about google play games beta (1)
- Gacha Games - Discussions, Pulls, Updates, etc. (0)
- Idle issue since 5060 ti installed (28)
- Windows 11 General Discussion (6151)
- Have you got pie today? (16795)
- Anime Nation (13054)
- Stalker 2 is looking great. (214)
Popular Reviews
- MSI GeForce RTX 5060 Gaming OC Review
- Razer Blade 16 (2025) Review - Thin, Light, Punchy, and Efficient
- Thermal Grizzly WireView Pro Review
- Pulsar X2 Crazylight Review
- SilverStone SETA H2 Review
- AVerMedia Live Gamer Ultra S (GC553Pro) Review
- Upcoming Hardware Launches 2025 (Updated May 2025)
- Sapphire Radeon RX 9060 XT Pulse OC 16 GB Review - An Excellent Choice
- NVIDIA GeForce RTX 5050 8 GB Review
- Our Visit to the Hunter Super Computer
TPU on YouTube
Controversial News Posts
- Intel's Core Ultra 7 265K and 265KF CPUs Dip Below $250 (288)
- Some Intel Nova Lake CPUs Rumored to Challenge AMD's 3D V-Cache in Desktop Gaming (140)
- AMD Radeon RX 9070 XT Gains 9% Performance at 1440p with Latest Driver, Beats RTX 5070 Ti (131)
- NVIDIA Launches GeForce RTX 5050 for Desktops and Laptops, Starts at $249 (124)
- NVIDIA GeForce RTX 5080 SUPER Could Feature 24 GB Memory, Increased Power Limits (115)
- Microsoft Partners with AMD for Next-gen Xbox Hardware (105)
- NVIDIA DLSS Transformer Cuts VRAM Usage by 20% (99)
- AMD Sampling Next-Gen Ryzen Desktop "Medusa Ridge," Sees Incremental IPC Upgrade, New cIOD (97)