 17
17
EVGA SuperNOVA 1600 T2 Review
Efficiency, Temperatures & Noise »Test Setup
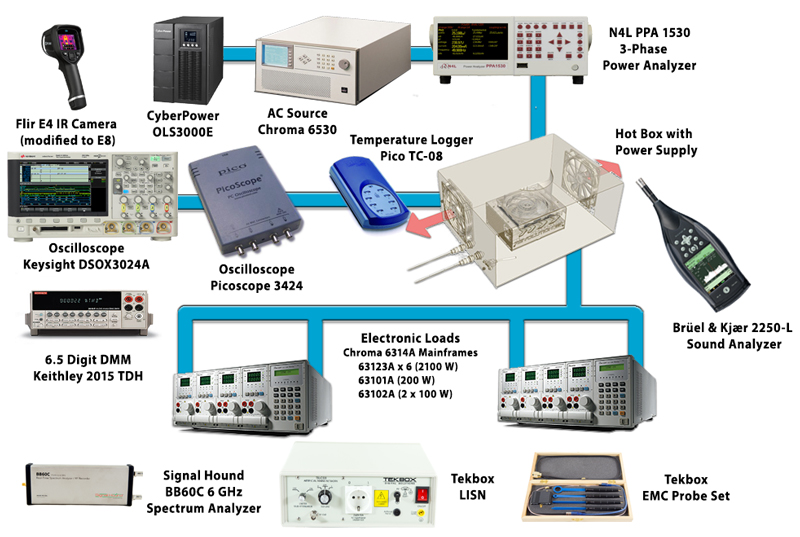
All measurements were performed using two Chroma 6314A mainframes equipped with the following electronic loads: six 63123A [350 W each], one 63102A [100 W x2], and one 63101A [200 W]. The aforementioned equipment is able to deliver 2500 W of load, and all loads are controlled by a custom-made software. The AC source is a Chroma 6530 capable of delivering up to 3 kW. We also used a Keysight DSOX3024A oscilloscope, a Rigol DS2072A oscilloscope kindly sponsored by Batronix, a Picoscope 3424 oscilloscope, a Picotech TC-08 thermocouple data logger, two Fluke multimeters (models 289 and 175), a Keithley 2015 THD 6.5 digit bench DMM, and a lab grade N4L PPA1530 3-phase power analyzer along with a Yokogawa WT210 power meter. We also included a wooden box, which, along with some heating elements, was used as a hot box. Finally, we had at our disposal three more oscilloscopes (Rigol VS5042, Stingray DS1M12, and a second Picoscope 3424), and a Class 1 Bruel & Kjaer 2250-L G4 Sound Analyzer we equipped with a type 4189 microphone that features a 16.6-140 dBA-weighted dynamic range. You will find more details about our equipment and the review methodology we follow in this article. We also conduct all of our tests at 40°C-45°C ambient to simulate the environment seen inside a typical system more accurately, with 40°C-45°C being derived from a standard ambient assumption of 23°C and 17°C-22°C being added for the typical temperature rise within a system.
To control the Chroma 6530 source, we use a GPIB-USB controller, which avoids its very picky Serial port. This controller was kindly provided by Prologix.

We use an OLS3000E online UPS with a capacity of 3000VA, or 2700W, to protect our very expensive Chroma AC source.
OLS3000E kindly provided by: |
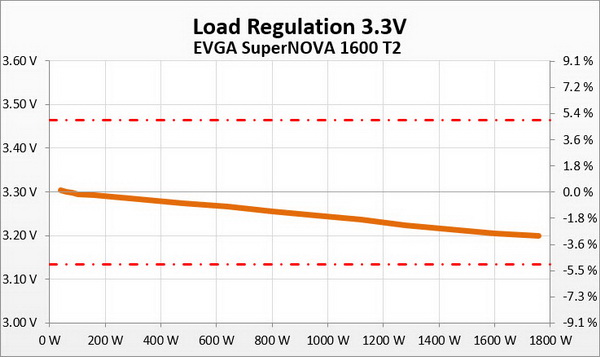
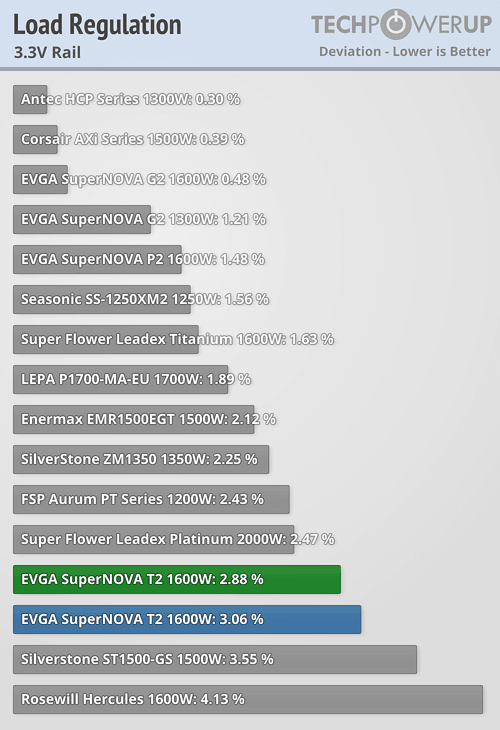
Primary Rails Load Regulation
The following charts show the voltage values of the main rails, recorded over a range of 60 W to the maximum specified load, and the deviation (in percent) for the same load range.


5VSB Regulation
The following chart shows how the 5VSB rail deals with the load we throw at it.

Hold-up Time
Hold-up time is a very important PSU characteristic and represents the amount of time, usually measured in milliseconds, a PSU can maintain output regulations as defined by the ATX specification without input power. In other words, it is the amount of time a system can continue to run without shutting down or rebooting during a power interruption. The ATX specification sets the minimum hold-up time to 17 ms with the maximum continuous output load.According to the ATX specification, PWR_OK is a "power good" signal. This signal should be asserted as high on the 5V rail by the power supply to indicate that the +12V, 5V, and 3.3V outputs are within the regulation thresholds and that sufficient mains energy is stored by the APFC converter to guarantee a system's continuous operation for at least 17 ms. Conversely, PWR_OK should be de-asserted to a low state, 0V, when any of the +12V, 5V, or 3.3V output voltages fall below the under-voltage threshold or when mains power has been removed for long enough to guarantee that a power supply isn't operating anymore. The AC loss to PWR_OK minimum hold-up time is set to 16 ms, which is less than the hold-up time described above, and the ATX specification also sets a PWR_OK inactive to DC loss delay that should be higher than 1 ms. This means that the AC loss to PWR_OK hold-up time should be lower than the PSU's overall hold-up time to ensure that the power supply doesn't send a power good signal once any of the +12V, 5V and 3.3V rails are out of spec.
In the following screenshots, the blue line is the mains signal and the green line is the "power good" signal. The yellow line represents the +12V rail.

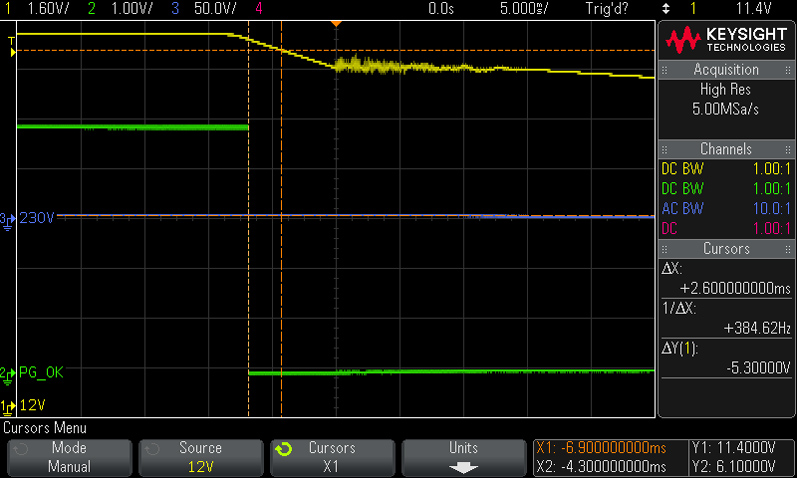

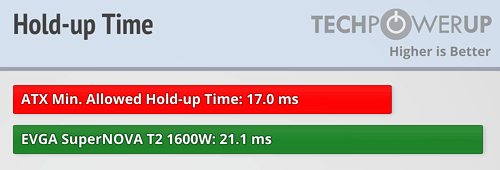

Hold-time easily exceeded 17 ms, and the power good signal dropped before the rail went out of spec, so all is fine here.
Inrush Current
Inrush current, or switch-on surge, refers to the maximum, instantaneous input-current drawn by an electrical device when it is first turned on. Because of the charging current of the APFC capacitor(s), PSUs produce large inrush current right as they are turned on. Large inrush current can cause the tripping of circuit breakers and fuses and may also damage switches, relays, and bridge rectifiers; as a result, the lower a PSU's inrush current right as it is turned on, the better.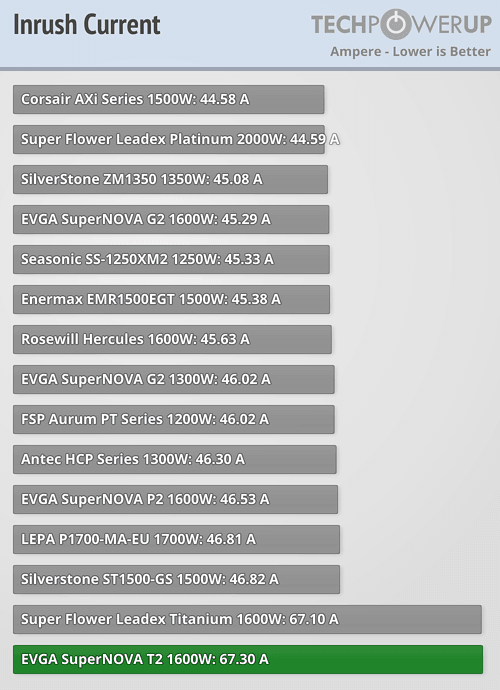
Inrush current is very high, which might have this PSU trip circuit breakers.
Load Regulation and Efficiency Measurements
The first set of tests revealed the stability of the voltage rails and the PSU's efficiency. The applied load was equal to (approximately) 10%-110% of the maximum load the PSU can handle, in 10% steps.We conducted two additional tests. In the first test, we stressed the two minor rails (5V and 3.3V) with a high load while the load at +12V was only 0.10 A. This test reveals whether the PSU is Haswell ready or not. In the second test, we dialed the maximum load the +12V rail can handle while the load on the minor rails is minimal.
| Load Regulation & Efficiency Testing Data - EVGA SuperNOVA 1600 T2 | ||||||||||
|---|---|---|---|---|---|---|---|---|---|---|
| Test | 12 V | 5 V | 3.3 V | 5VSB | Power (DC/AC) | Efficiency | Fan Speed | Fan Noise | Temp (In/Out) | PF/AC Volts |
| 10% Load | 11.400A | 1.984A | 2.002A | 0.984A | 159.73W | 91.32% | 0 RPM | 0 dBA | 47.54°C | 0.895 |
| 12.122V | 5.029V | 3.293V | 5.054V | 174.92W | 39.62°C | 230.2V | ||||
| 20% Load | 23.852A | 2.985A | 3.012A | 1.187A | 319.65W | 93.87% | 0 RPM | 0 dBA | 49.62°C | 0.927 |
| 12.108V | 5.017V | 3.283V | 5.042V | 340.52W | 39.99°C | 230.2V | ||||
| 30% Load | 36.688A | 3.498A | 3.538A | 1.389A | 479.76W | 94.61% | 0 RPM | 0 dBA | 51.34°C | 0.973 |
| 12.093V | 5.008V | 3.275V | 5.030V | 507.09W | 40.43°C | 230.2V | ||||
| 40% Load | 49.535A | 4.004A | 4.038A | 1.590A | 639.57W | 94.68% | 985 RPM | 45.1 dBA | 41.63°C | 0.983 |
| 12.080V | 4.998V | 3.267V | 5.020V | 675.54W | 52.20°C | 230.2V | ||||
| 50% Load | 62.062A | 5.008A | 5.065A | 1.794A | 799.34W | 94.51% | 985 RPM | 45.1 dBA | 42.02°C | 0.989 |
| 12.067V | 4.985V | 3.256V | 5.008V | 845.76W | 52.88°C | 230.2V | ||||
| 60% Load | 74.637A | 6.036A | 6.096A | 2.000A | 959.32W | 94.15% | 985 RPM | 45.1 dBA | 43.17°C | 0.992 |
| 12.052V | 4.972V | 3.247V | 4.996V | 1018.90W | 55.05°C | 230.3V | ||||
| 70% Load | 87.244A | 7.051A | 7.138A | 2.205A | 1119.13W | 93.68% | 1490 RPM | 51.3 dBA | 45.09°C | 0.995 |
| 12.036V | 4.960V | 3.236V | 4.985V | 1194.59W | 57.19°C | 230.2V | ||||
| 80% Load | 99.889A | 8.088A | 8.187A | 2.410A | 1279.17W | 93.06% | 1990 RPM | 61.3 dBA | 45.85°C | 0.995 |
| 12.021V | 4.948V | 3.224V | 4.973V | 1374.61W | 58.15°C | 230.2V | ||||
| 90% Load | 113.017A | 8.607A | 8.737A | 2.415A | 1439.24W | 92.94% | 1990 RPM | 61.3 dBA | 46.69°C | 0.996 |
| 12.004V | 4.938V | 3.215V | 4.967V | 1548.66W | 59.20°C | 230.2V | ||||
| 100% Load | 125.905A | 9.133A | 9.265A | 3.029A | 1599.02W | 92.32% | 1990 RPM | 61.3 dBA | 47.54°C | 0.997 |
| 11.988V | 4.927V | 3.205V | 4.946V | 1732.12W | 61.54°C | 230.3V | ||||
| 110% Load | 139.443A | 9.149A | 9.284A | 3.034A | 1758.96W | 91.79% | 1990 RPM | 61.3 dBA | 48.12°C | 0.997 |
| 11.971V | 4.919V | 3.199V | 4.939V | 1916.28W | 64.14°C | 230.2V | ||||
| Crossload 1 | 0.100A | 14.022A | 14.005A | 0.004A | 116.31W | 83.11% | 1500 RPM | 51.5 dBA | 45.65°C | 0.858 |
| 12.127V | 4.966V | 3.245V | 5.063V | 139.94W | 54.93°C | 230.3V | ||||
| Crossload 2 | 133.266A | 1.003A | 1.003A | 1.002A | 1610.70W | 92.70% | 1990 RPM | 61.3 dBA | 47.65°C | 0.997 |
| 11.987V | 4.969V | 3.240V | 4.997V | 1737.62W | 61.29°C | 230.3V | ||||
The unit operated passively with a load of up to 30%; however, once the fan engaged, noise increased to around 45 dBA instantly. The fan might be able to push lots of air, which allows it to handle the PSU's load, but it does produce a lot of noise while doing so. There were times where the fan produced upward of 60 dBA, which will unnerve even those used to noisy PC components. That said, you can't expect a 1.6 kW PSU to be dead silent while pushed hard.
The 1600 T2 proved to be one of the most efficient PSUs we have ever tested. Efficiency reached very close to 95% with a load of 40%, a reading only a Titanium PSU can achieve. Efficiency stayed above 92% with even a full load, which is amazing. Super Flower did a great job with this platform, which proves that analog circuits are still relevant today.
Jul 3rd, 2025 22:07 CDT
change timezone
Latest GPU Drivers
New Forum Posts
- GPU-Z Display Bug via DP 2.1? (5)
- [GPU-Z Test Build] New Kernel Driver, Everyone: Please Test (35)
- What Windows is overall the best to you and why? (269)
- How do you view TPU & the internet in general? (With poll) (58)
- HP Zbook 15 G2 GPU Upgrade (12)
- Will you buy a RTX 5090? (610)
- What phone you use as your daily driver? And, a discussion of them. (1756)
- What would you buy? (51)
- A Final Fantasy IX Reminiscence - My love letter and homage to one of the best stories ever told (90)
- GravityMark v1.89 GPU Benchmark (309)
Popular Reviews
- ASUS ROG Crosshair X870E Extreme Review
- Crucial T710 2 TB Review - Record-Breaking Gen 5
- Fractal Design Scape Review - Debut Done Right
- PowerColor ALPHYN AM10 Review
- Sapphire Radeon RX 9060 XT Pulse OC 16 GB Review - An Excellent Choice
- Upcoming Hardware Launches 2025 (Updated May 2025)
- AMD Ryzen 7 9800X3D Review - The Best Gaming Processor
- Sapphire Radeon RX 9070 XT Nitro+ Review - Beating NVIDIA
- SCHENKER KEY 18 Pro (E25) Review - Top-Tier Contender
- AVerMedia CamStream 4K Review
TPU on YouTube
Controversial News Posts
- Intel's Core Ultra 7 265K and 265KF CPUs Dip Below $250 (288)
- NVIDIA Grabs Market Share, AMD Loses Ground, and Intel Disappears in Latest dGPU Update (212)
- Some Intel Nova Lake CPUs Rumored to Challenge AMD's 3D V-Cache in Desktop Gaming (140)
- NVIDIA GeForce RTX 5080 SUPER Could Feature 24 GB Memory, Increased Power Limits (115)
- Microsoft Partners with AMD for Next-gen Xbox Hardware (105)
- NVIDIA Launches GeForce RTX 5050 for Desktops and Laptops, Starts at $249 (105)
- Intel "Nova Lake‑S" Series: Seven SKUs, Up to 52 Cores and 150 W TDP (100)
- NVIDIA DLSS Transformer Cuts VRAM Usage by 20% (97)