 46
46
AMD Radeon RX 5700 Review
Value & Conclusion »Clock Speeds
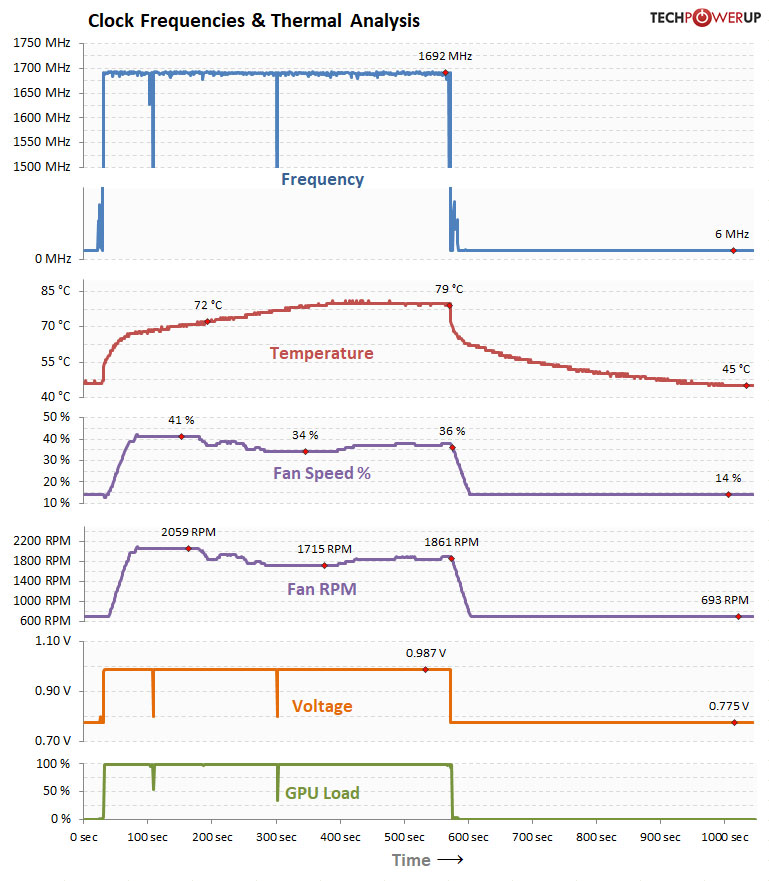
For this test, we first let the card sit in idle to reach thermal equilibrium. Next, we start a constant 100% gaming load, recording several important parameters while the test is running. This shows you the thermal behavior of the card and how the fans ramp up as temperatures increase. Once temperatures are stable (no increase for two minutes), we stop the load and record how the card cools down over time.
Take a look at the fan curve. What's happening here?! The card is heating up, and as soon as it crosses the 72°C mark, fan speed will drop, which of course increases temperatures further. As a reaction to that, fan speed will drop even further. Caught in this spiral of death, fan speed will go down all the way to 34% while temperatures keep climbing. As soon as the card reaches 79°C, fan speed normalizes somehow and goes back up, slightly, to end up at a final 36% and 79°C.
I have no idea how this could slip past AMD's internal testing—it should be fairly obvious that something is wrong. My theory is that somehow, the fan curve in the BIOS is set incorrectly with parts of the curve having a "minus" sign instead of a plus sign. The plus indicates "increase fan speed", and the minus indicates "slow down the fan".
This should definitely be fixable with a driver or BIOS update.
Voltage-Frequency Analysis
For the graph below, we recorded all GPU clock and GPU voltage combinations of our 1920x1080 resolution benchmarking suite. The plotted points are transparent, which allows them to add up to indicate more often used values. A light color means the clock/voltage combination is rarely used and a dark color means it's active more often.
Another interesting result! Usually, we would expect to see a stairs pattern here, representing different points on the card's voltage-frequency curve. Running any microchip at a lower frequency requires less voltage as well, which is good for power consumption. Defining such a voltage-frequency curve lets you exploit that behavior, resulting in improved power efficiency.
The first interesting result of this test is that unlike the Radeon RX 5700 XT, the RX 5700 runs at lower than 1 V all the time, whereas the XT runs at up to 1.2 V. What AMD did here is undervolt their GPU for improved power efficiency. This also explains the relatively low clocks the card is marketed at—running at substantially reduced voltage means the card can't handle clocks that are as high.
The second thing here is that there is no stairs pattern; it's just a vertical line. It looks as though AMD undervolted their card alright, but forgot to adjust the voltage-frequency curve accordingly. Instead, every frequency is tied to the same voltage of 0.987 V. This means some power efficiency is lost because lower clocks could run even a lower voltage, leading to a further reduction in power consumption.
Clock Profiles
Modern graphics cards have several clock profiles that are selected to balance power draw and performance requirements.The following table lists the clock settings for important performance scenarios and the GPU voltage that is used in those states.
| GPU Clock | Memory Clock | GPU Voltage | |
|---|---|---|---|
| Desktop | 6 MHz | 100 MHz | 0.775 V |
| Multi-Monitor | 6 MHz | 874 MHz | 0.775 V |
| Media Playback | 54 MHz | 100 MHz | 0.775 V |
| 3D Load | 1238 - 1725 MHz | 1750 MHz | 0.987 V |
Apr 2nd, 2025 00:17 EDT
change timezone
Latest GPU Drivers
New Forum Posts
- HIS 7870 IceQ Turbo 2GB EFI BIOS for Mac OS (0)
- Looking 4 a Solid AM5 MB? (1)
- Folding Pie and Milestones!! (9455)
- Should you physically remove secondary NVMe drives when performing a clean Windows install? (46)
- random system shutdown with fans running at full speed (14)
- Is the futureproof gaming solution a four drive system? (44)
- Help me pick a UPS (15)
- Hotspot 110° (20)
- RTX 3090 is still a good card? (29)
- PCB serial number explanation Asrock rx5700xt Taichi oc+ (8)
Popular Reviews
- DDR5 CUDIMM Explained & Benched - The New Memory Standard
- Sapphire Radeon RX 9070 XT Pulse Review
- SilverStone Lucid 04 Review
- ASRock Phantom Gaming B850 Riptide Wi-Fi Review - Amazing Price/Performance
- Palit GeForce RTX 5070 GamingPro OC Review
- Gigabyte GeForce RTX 5080 Gaming OC Review
- Sapphire Radeon RX 9070 XT Nitro+ Review - Beating NVIDIA
- Samsung 9100 Pro 2 TB Review - The Best Gen 5 SSD
- Assassin's Creed Shadows Performance Benchmark Review - 30 GPUs Compared
- be quiet! Pure Rock Pro 3 Black Review
Controversial News Posts
- MSI Doesn't Plan Radeon RX 9000 Series GPUs, Skips AMD RDNA 4 Generation Entirely (146)
- Microsoft Introduces Copilot for Gaming (124)
- AMD Radeon RX 9070 XT Reportedly Outperforms RTX 5080 Through Undervolting (119)
- NVIDIA Reportedly Prepares GeForce RTX 5060 and RTX 5060 Ti Unveil Tomorrow (115)
- Over 200,000 Sold Radeon RX 9070 and RX 9070 XT GPUs? AMD Says No Number was Given (100)
- NVIDIA GeForce RTX 5050, RTX 5060, and RTX 5060 Ti Specifications Leak (96)
- Retailers Anticipate Increased Radeon RX 9070 Series Prices, After Initial Shipments of "MSRP" Models (90)
- China Develops Domestic EUV Tool, ASML Monopoly in Trouble (88)