 21
21
Super Flower Leadex III 650 W Review
Cross Load Tests »Test Setup

Primary Rails Load Regulation
The following charts show the voltage values of the main rails, recorded over a range from 60 W to the maximum specified load, and the deviation (in percent) for the same load range. Tight load regulation is important for every power supply because it allows for consistent voltage levels despite of changes in load.


5VSB Regulation


Hold-up Time
Hold-up time represents the amount of time, usually measured in milliseconds, a PSU can maintain output regulations as defined by the ATX specification without input power. Put simply, hold-up time is the amount of time the system can continue to run without shutting down or rebooting during a power interruption. In the following screenshots, the blue line is the mains signal and the green line the "Power Good" signal, while the yellow line represents the +12V rail.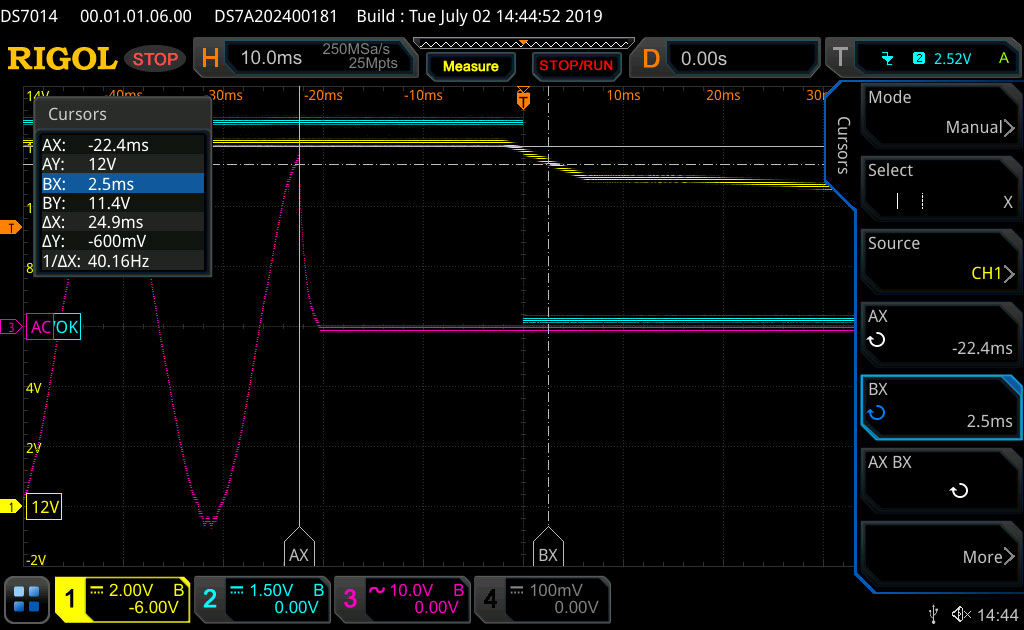


Inrush Current
Inrush current, or switch-on surge, refers to the maximum instantaneous input current drawn by an electrical device when it is first turned on. Large enough inrush current can cause the tripping of circuit breakers and fuses, and may also damage switches, relays, and bridge rectifiers. As a result, the lower the inrush current of a PSU right as it is turned on, the better.
10-110% Load Testing
These tests reveal the PSU's load regulation and efficiency levels under high ambient temperatures. They also show how the fan-speed profile behaves under tough operating conditions.| Load Regulation Efficiency Testing Data Super Flower SF-650F14HG | ||||||||||
|---|---|---|---|---|---|---|---|---|---|---|
| Test | 12 V | 5 V | 3.3 V | 5VSB | Power (DC/AC) | Efficiency | Fan Speed | PSU Noise | Temp (In/Out) | PF/AC Volts |
| 10% Load | 3.566A | 1.990A | 1.994A | 0.983A | 64.920W | 86.254% | 0 RPM | <6.0 dB(A) | 46.81°C | 0.660 |
| 12.147V | 5.027V | 3.309V | 5.087V | 75.266W | 40.20°C | 230.35V | ||||
| 20% Load | 8.115A | 2.987A | 2.992A | 1.183A | 129.413W | 90.370% | 0 RPM | <6.0 dB(A) | 47.47°C | 0.842 |
| 12.139V | 5.024V | 3.307V | 5.075V | 143.204W | 40.53°C | 230.37V | ||||
| 30% Load | 13.067A | 3.487A | 3.479A | 1.383A | 194.522W | 91.712% | 0 RPM | <6.0 dB(A) | 48.49°C | 0.913 |
| 12.131V | 5.021V | 3.304V | 5.064V | 212.102W | 41.01°C | 230.36V | ||||
| 40% Load | 18.034A | 3.987A | 3.999A | 1.584A | 259.779W | 92.201% | 0 RPM | <6.0 dB(A) | 49.76°C | 0.939 |
| 12.120V | 5.017V | 3.301V | 5.052V | 281.752W | 41.22°C | 230.52V | ||||
| 50% Load | 22.672A | 4.988A | 5.002A | 1.786A | 325.061W | 92.189% | 0 RPM | <6.0 dB(A) | 51.23°C | 0.954 |
| 12.110V | 5.013V | 3.298V | 5.040V | 352.601W | 42.05°C | 230.37V | ||||
| 60% Load | 27.250A | 5.990A | 6.008A | 1.990A | 389.590W | 91.926% | 0 RPM | <6.0 dB(A) | 53.28°C | 0.964 |
| 12.102V | 5.010V | 3.295V | 5.027V | 423.806W | 42.56°C | 230.40V | ||||
| 70% Load | 31.888A | 6.993A | 7.015A | 2.194A | 454.922W | 91.446% | 0 RPM | <6.0 dB(A) | 54.40°C | 0.971 |
| 12.099V | 5.007V | 3.292V | 5.015V | 497.477W | 43.30°C | 230.39V | ||||
| 80% Load | 36.515A | 7.993A | 8.020A | 2.399A | 520.243W | 91.076% | 623 RPM | 12.3 dB(A) | 43.75°C | 0.976 |
| 12.100V | 5.005V | 3.292V | 5.004V | 571.220W | 55.67°C | 230.41V | ||||
| 90% Load | 41.523A | 8.496A | 8.512A | 2.400A | 585.148W | 90.612% | 1020 RPM | 22.9 dB(A) | 44.73°C | 0.979 |
| 12.105V | 5.003V | 3.290V | 5.001V | 645.775W | 56.83°C | 230.39V | ||||
| 100% Load | 46.275A | 9.001A | 9.034A | 3.014A | 650.010W | 90.179% | 1245 RPM | 30.2 dB(A) | 45.53°C | 0.982 |
| 12.108V | 5.000V | 3.288V | 4.978V | 720.797W | 58.35°C | 230.82V | ||||
| 110% Load | 51.612A | 9.004A | 9.038A | 3.016A | 714.837W | 89.777% | 1570 RPM | 35.4 dB(A) | 46.70°C | 0.985 |
| 12.112V | 4.999V | 3.286V | 4.974V | 796.237W | 60.09°C | 230.39V | ||||
| Crossload 1 | 0.147A | 12.001A | 12.002A | 0.000A | 101.549W | 84.953% | 0 RPM | 0 dB(A) | 51.50°C | 0.802 |
| 12.123V | 5.017V | 3.296V | 5.092V | 119.536W | 41.83°C | 230.39V | ||||
| Crossload 2 | 54.118A | 1.003A | 1.001A | 1.000A | 668.466W | 90.683% | 1385 RPM | 31.6 dB(A) | 45.68°C | 0.983 |
| 12.105V | 5.006V | 3.294V | 5.050V | 737.147W | 58.65°C | 230.39V | ||||
Light Load Testing
In the following tests, we measure the PSU's efficiency at loads significantly lower than 10 percent of its maximum capacity (the lowest load the 80 PLUS standard measures). This is important for representing when a PC is idle with its power-saving features turned on.| Efficiency at Low Loads Super Flower SF-650F14HG | |||||||||
|---|---|---|---|---|---|---|---|---|---|
| Test # | 12 V | 5 V | 3.3 V | 5 VSB | Power (DC/AC) | Efficiency | Fan Speed | PSU Noise | PF/AC Volts |
| 1 | 2.836A | 0.498A | 0.480A | 0.196A | 39.598W | 82.862% | 0 RPM | <6.0 dB(A) | 0.519 |
| 12.165V | 5.031V | 3.313V | 5.115V | 47.788W | 230.34V | ||||
| 2 | 4.085A | 0.995A | 0.996A | 0.392A | 59.979W | 86.617% | 0 RPM | <6.0 dB(A) | 0.638 |
| 12.160V | 5.029V | 3.312V | 5.107V | 69.246W | 230.35V | ||||
| 3 | 5.272A | 1.489A | 1.479A | 0.588A | 79.478W | 88.491% | 0 RPM | <6.0 dB(A) | 0.714 |
| 12.158V | 5.028V | 3.310V | 5.100V | 89.815W | 230.35V | ||||
| 4 | 6.527A | 1.990A | 1.993A | 0.786A | 99.916W | 89.496% | 0 RPM | <6.0 dB(A) | 0.780 |
| 12.152V | 5.027V | 3.309V | 5.092V | 111.643W | 230.35V | ||||
Efficiency
Using the results that we gathered so far, we plotted a chart showing the PSU's efficiency at low loads and loads from 10 to 110 percent of its maximum-rated capacity.


The Leadex III unit has satisfactory efficiency under light loads, but I wanted to see a little higher overall efficiency with normal loads.
5VSB Efficiency
| 5VSB Efficiency Super Flower SF-650F14HG | ||||
|---|---|---|---|---|
| Test # | 5VSB | Power (DC/AC) | Efficiency | PF/AC Volts |
| 1 | 0.100A | 0.513W | 70.564% | 0.017 |
| 5.122V | 0.727W | 230.36V | ||
| 2 | 0.250A | 1.280W | 75.338% | 0.038 |
| 5.118V | 1.699W | 230.36V | ||
| 3 | 0.550A | 2.811W | 77.716% | 0.080 |
| 5.110V | 3.617W | 230.36V | ||
| 4 | 1.000A | 5.098W | 79.125% | 0.135 |
| 5.098V | 6.443W | 230.36V | ||
| 5 | 1.500A | 7.625W | 80.128% | 0.187 |
| 5.083V | 9.516W | 230.36V | ||
| 6 | 3.000A | 15.111W | 80.528% | 0.292 |
| 5.037V | 18.765W | 230.36V | ||
The 5VSB rail is highly efficient.
Power Consumption in Idle and Standby
| Idle / Standby Super Flower SF-650F14HG | ||||||
|---|---|---|---|---|---|---|
| Mode | 12 V | 5 V | 3.3 V | 5VSB | Power (AC) | PF/AC Volts |
| Idle | 12.186V | 5.037V | 3.317V | 5.125V | 5.187W | 0.110 |
| 230.4V | ||||||
| Standby | 0.083W | 0.002 | ||||
| 230.4V | ||||||
Fan RPM, Delta Temperature and Output Noise
The following results were obtained at 37 °C - 47 °C ambient.

The following results were obtained at 30–32 °C ambient.

Apr 2nd, 2025 20:26 EDT
change timezone
Latest GPU Drivers
New Forum Posts
- New AM5 build [help] (11)
- A Final Fantasy IX Reminiscence - My love letter and homage to one of the best stories ever told (81)
- Help me pick a UPS (33)
- What do you do for a living? (479)
- ROG-STRIX-LC-RX6900XT-O16G-GAMING (3)
- The TPU UK Clubhouse (26035)
- Is ARC SLI friendly? (10)
- Questions about CPU thermal throttling mechanism (7)
- What's your latest tech purchase? (23447)
- Stuttering and frame drops when watching 4K videos (windowed only) (4)
Popular Reviews
- DDR5 CUDIMM Explained & Benched - The New Memory Standard
- Sapphire Radeon RX 9070 XT Pulse Review
- SilverStone Lucid 04 Review
- Sapphire Radeon RX 9070 XT Nitro+ Review - Beating NVIDIA
- ASRock Phantom Gaming B850 Riptide Wi-Fi Review - Amazing Price/Performance
- Palit GeForce RTX 5070 GamingPro OC Review
- PowerColor Radeon RX 9070 Hellhound Review
- Samsung 9100 Pro 2 TB Review - The Best Gen 5 SSD
- AMD Ryzen 7 9800X3D Review - The Best Gaming Processor
- Assassin's Creed Shadows Performance Benchmark Review - 30 GPUs Compared
Controversial News Posts
- MSI Doesn't Plan Radeon RX 9000 Series GPUs, Skips AMD RDNA 4 Generation Entirely (146)
- Microsoft Introduces Copilot for Gaming (124)
- AMD Radeon RX 9070 XT Reportedly Outperforms RTX 5080 Through Undervolting (119)
- NVIDIA Reportedly Prepares GeForce RTX 5060 and RTX 5060 Ti Unveil Tomorrow (115)
- Over 200,000 Sold Radeon RX 9070 and RX 9070 XT GPUs? AMD Says No Number was Given (100)
- NVIDIA GeForce RTX 5050, RTX 5060, and RTX 5060 Ti Specifications Leak (96)
- Retailers Anticipate Increased Radeon RX 9070 Series Prices, After Initial Shipments of "MSRP" Models (90)
- China Develops Domestic EUV Tool, ASML Monopoly in Trouble (88)