 6
6
Atompalm Hydrogen Review
Testing 8000 Hz »Sensor and Performance
The Atompalm Hydrogen is equipped with the PixArt PMW3360. According to specifications, the 3360 is capable of up to 12,000 CPI, as well as a maximum tracking speed of 250 IPS, which equals 6.35 m/s. Out of the box, seven pre-defined CPI steps are available: 400, 800, 1200, 1600, 2000, 2500, and 12,000.All testing was done on the latest firmware (v14). As such, results obtained on earlier firmware versions may differ from those presented hereafter.
CPI Accuracy
"CPI" (short for counts per inch) describes the number of counts registered by the mouse if it is moved exactly an inch. There are several factors (firmware, mounting height of the sensor not meeting specifications, mouse feet thickness, mousing surface, among others) which may contribute to nominal CPI not matching actual CPI. It is impossible to always achieve a perfect match, but ideally, nominal and actual CPI should differ as little as possible. In this test, I'm determining whether this is the case or not. However, please keep in mind that said variance will still differ from unit to unit, so your mileage may vary.
I've restricted my testing to the four most common CPI steps, which are 400, 800, 1600, and 3200. As you can see, deviation is minimal, which is an excellent result.
Motion Delay
"Motion delay" encompasses all kinds of sensor lag. Any further sources of input delay will not be recorded in this test. The main thing I'll be looking for in this test is sensor smoothing, which describes an averaging of motion data across several capture frames in order to reduce jitter at higher CPI values, increasing motion delay along with it. The goal here is to have as little smoothing as possible. As there is no way to accurately measure motion delay absolutely without special equipment, it is done by comparison with a control subject that has been determined to have consistent and low motion delay. In this case, the control subject is a Logitech G403, whose PMW3366 sensor has no visible smoothing across the entire CPI range. Note that the Hydrogen is moved first and thus receives a slight head start.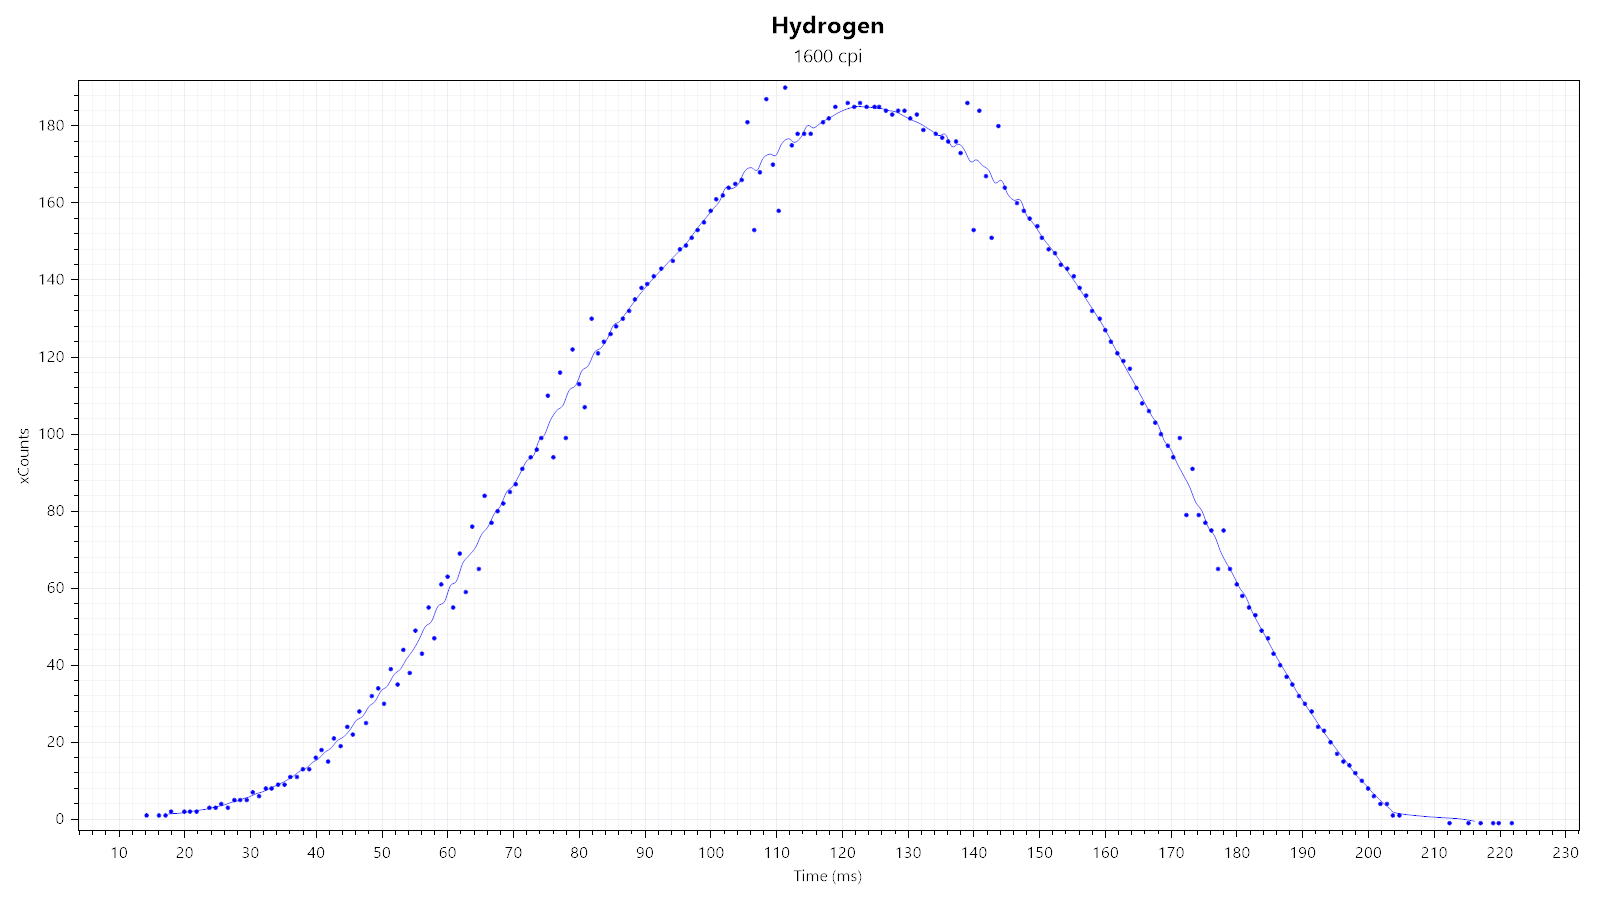
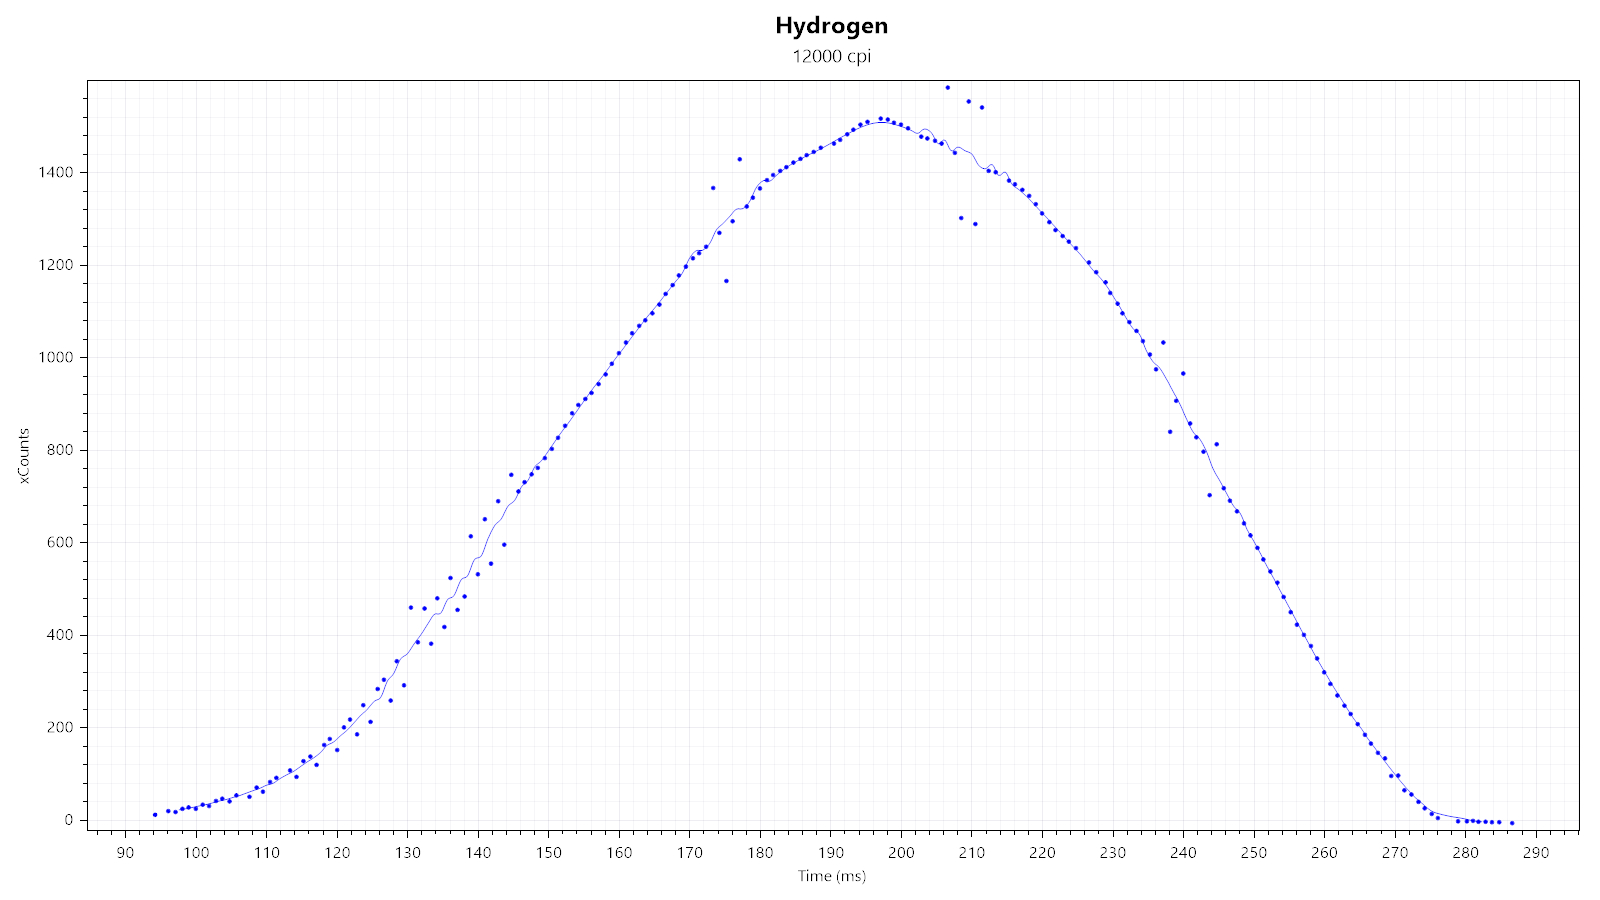
First, I'm looking at two xCounts plots—generated at 1600 and 12,000 CPI—to quickly gauge whether there is any smoothing, which would be indicated by any visible "kinks." As you can see, no such kinks can be observed at 1600 CPI. At 12,000 CPI, the kink is very subtle, but there. Unlike most 3360 implementations, the Hydrogen employs SROM 5, which has 16 frames of smoothing at and above 3600 CPI, all the way up until 12,000. SPI timing jitter is fairly low.
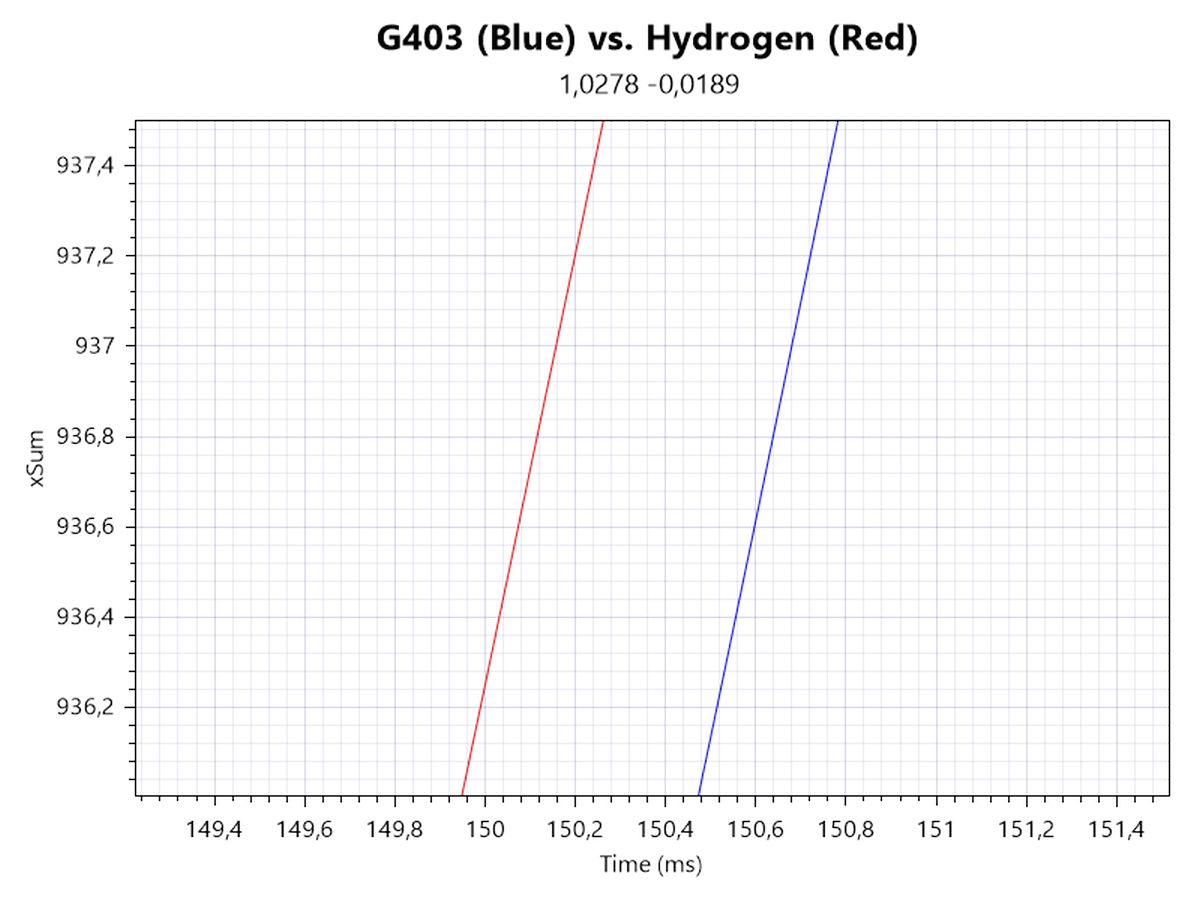
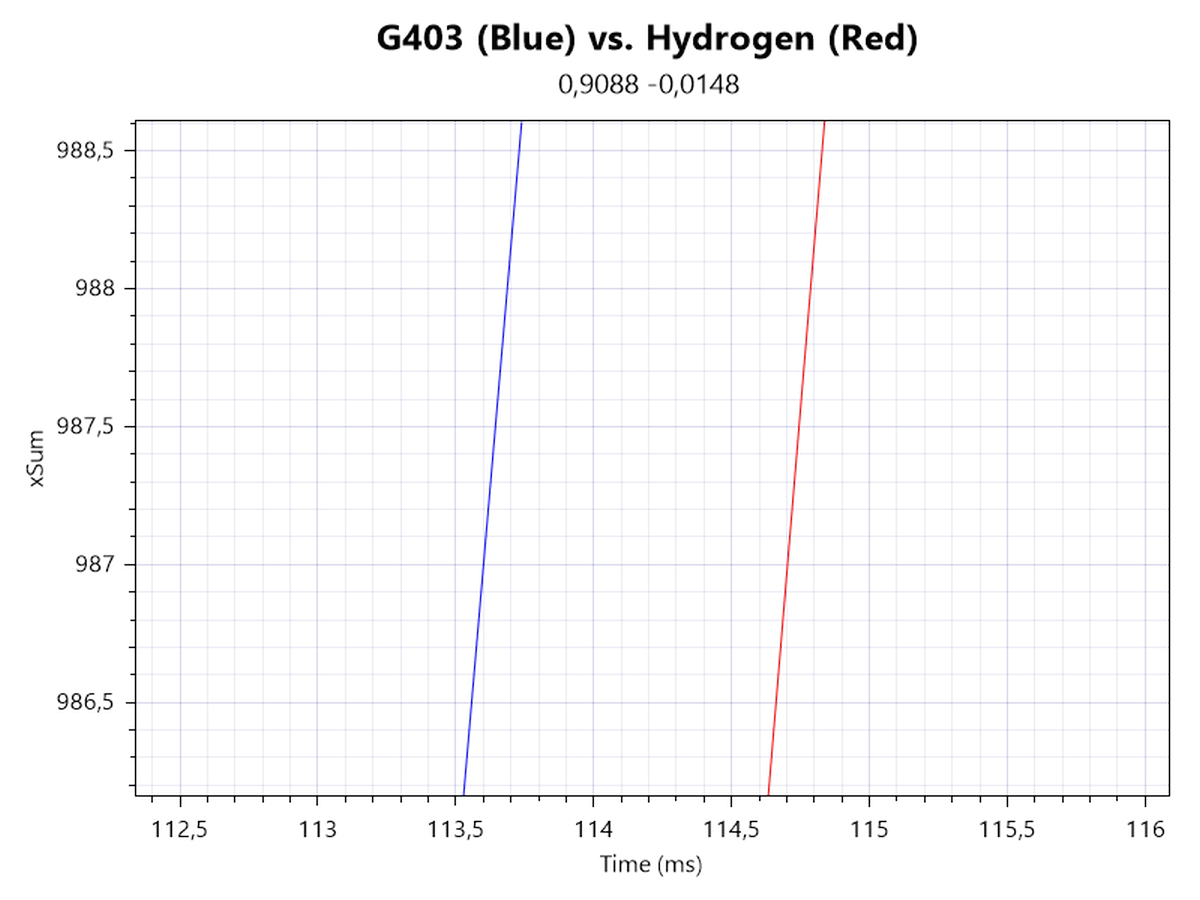
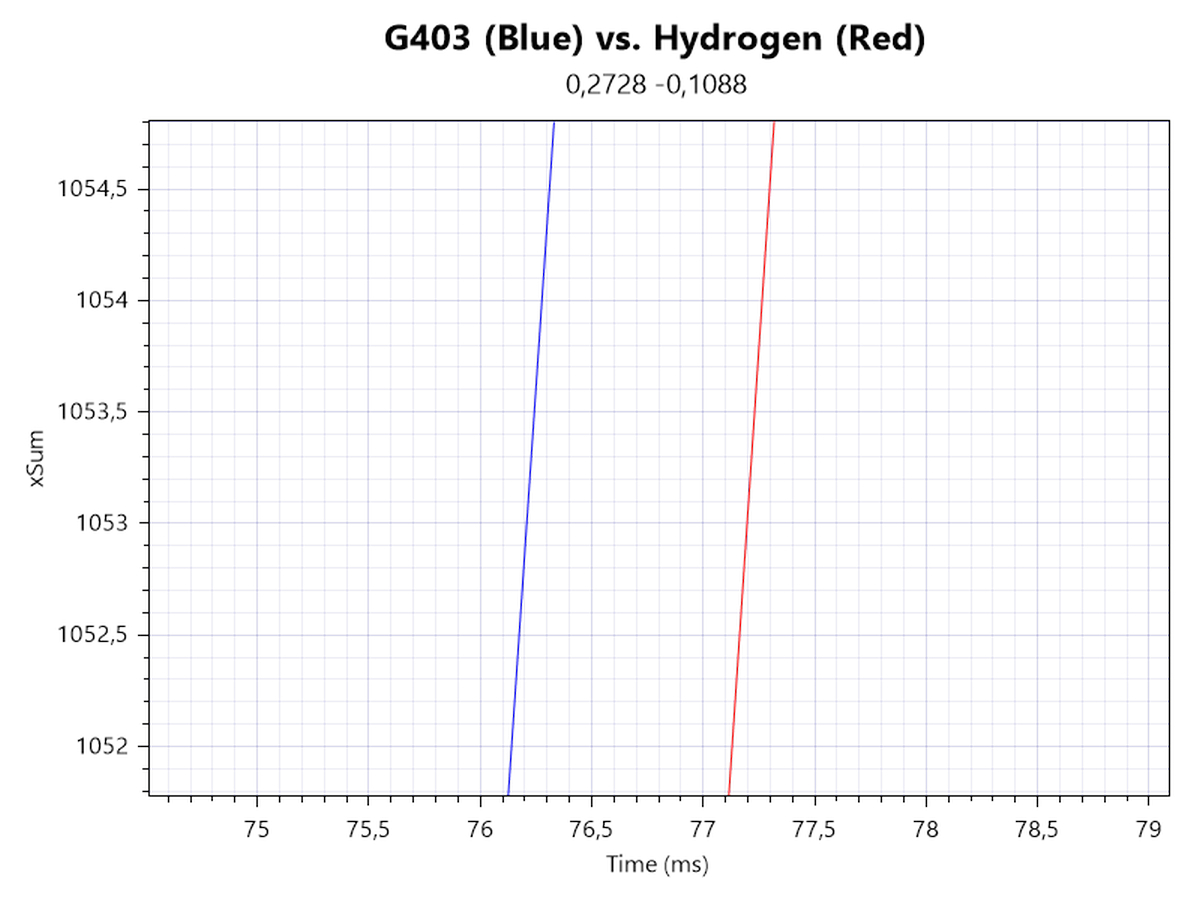
In order to determine motion delay, I'm looking at xSum plots generated at 1600, 3600, and 12,000 CPI. The line further to the left denotes the sensor with less motion delay. The Hydrogen already is ahead at 1600 CPI. At and above 3600 CPI, roughly 1.5 ms worth of smoothing is introduced, having the Hydrogen fall behind again, which continues to be the case at 12,000 CPI.
Speed-related Accuracy Variance (SRAV)
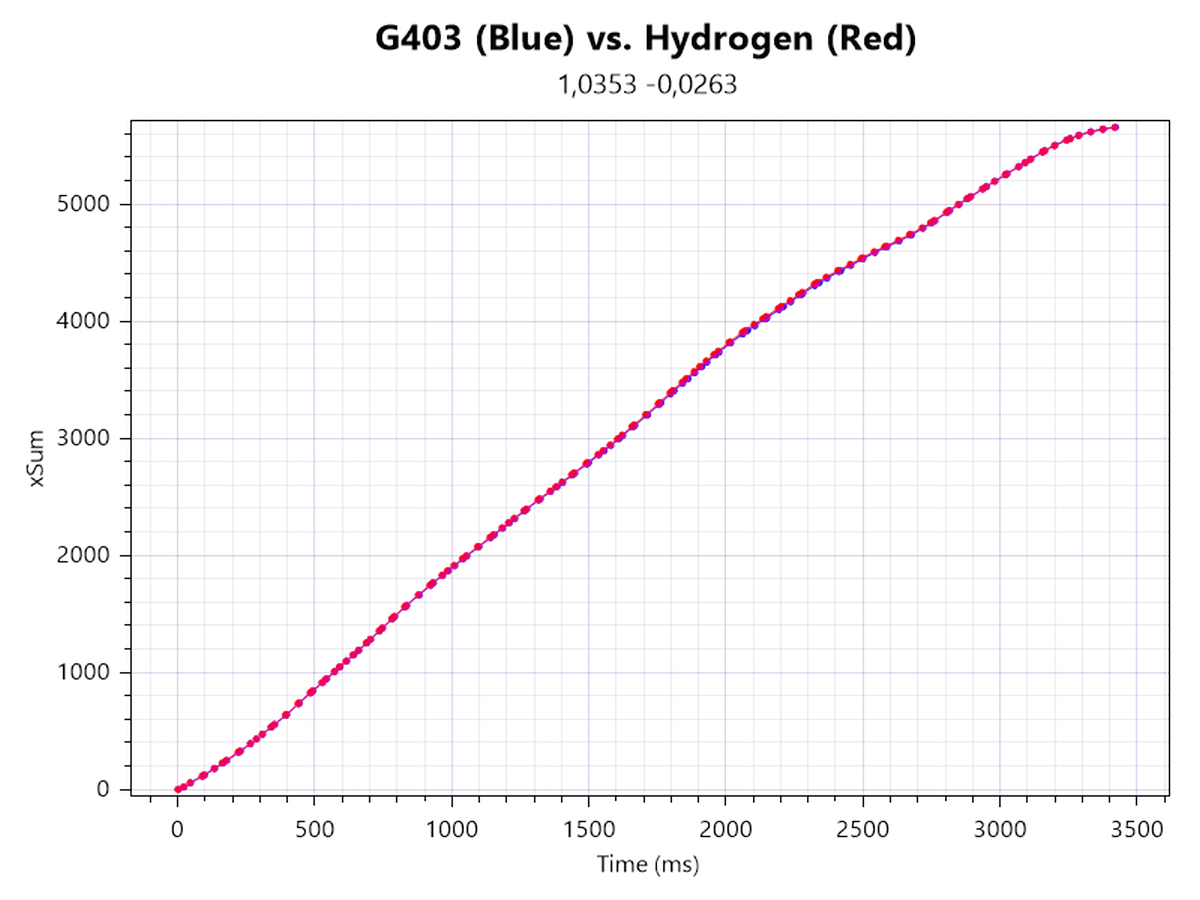
What people typically mean when they talk about "acceleration" is speed-related accuracy variance (or SRAV for short). It's not about the mouse having a set amount of inherent positive or negative acceleration, but about the cursor not traveling the same distance if the mouse is moved the same physical distance at different speeds. The easiest way to test this is by comparison with a control subject that is known to have very low SRAV, which in this case is the G403. As you can see from the plot, no displacement between the two cursor paths can be observed, which confirms that SRAV is very low.
Perfect Control Speed
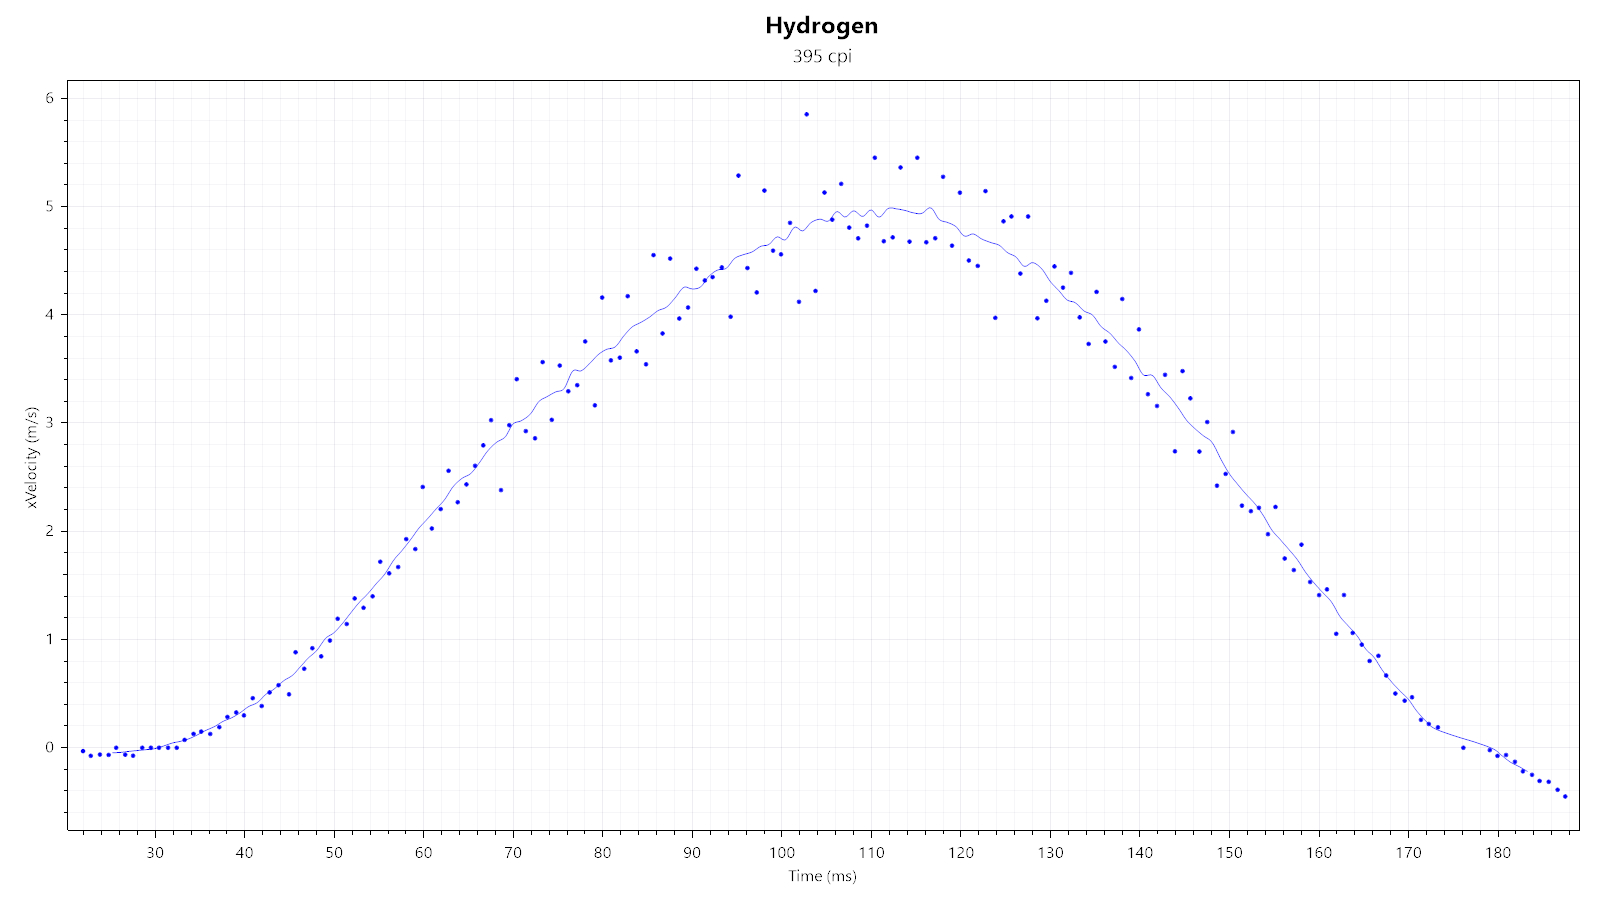
Perfect Control Speed (or PCS for short) is the maximum speed up to which the mouse and its sensor can be moved without the sensor malfunctioning in any way. I've only managed to hit a measly 5 m/s, which is within the proclaimed PCS range and shows no sign of the sensor malfunctioning.
Polling Rate Stability

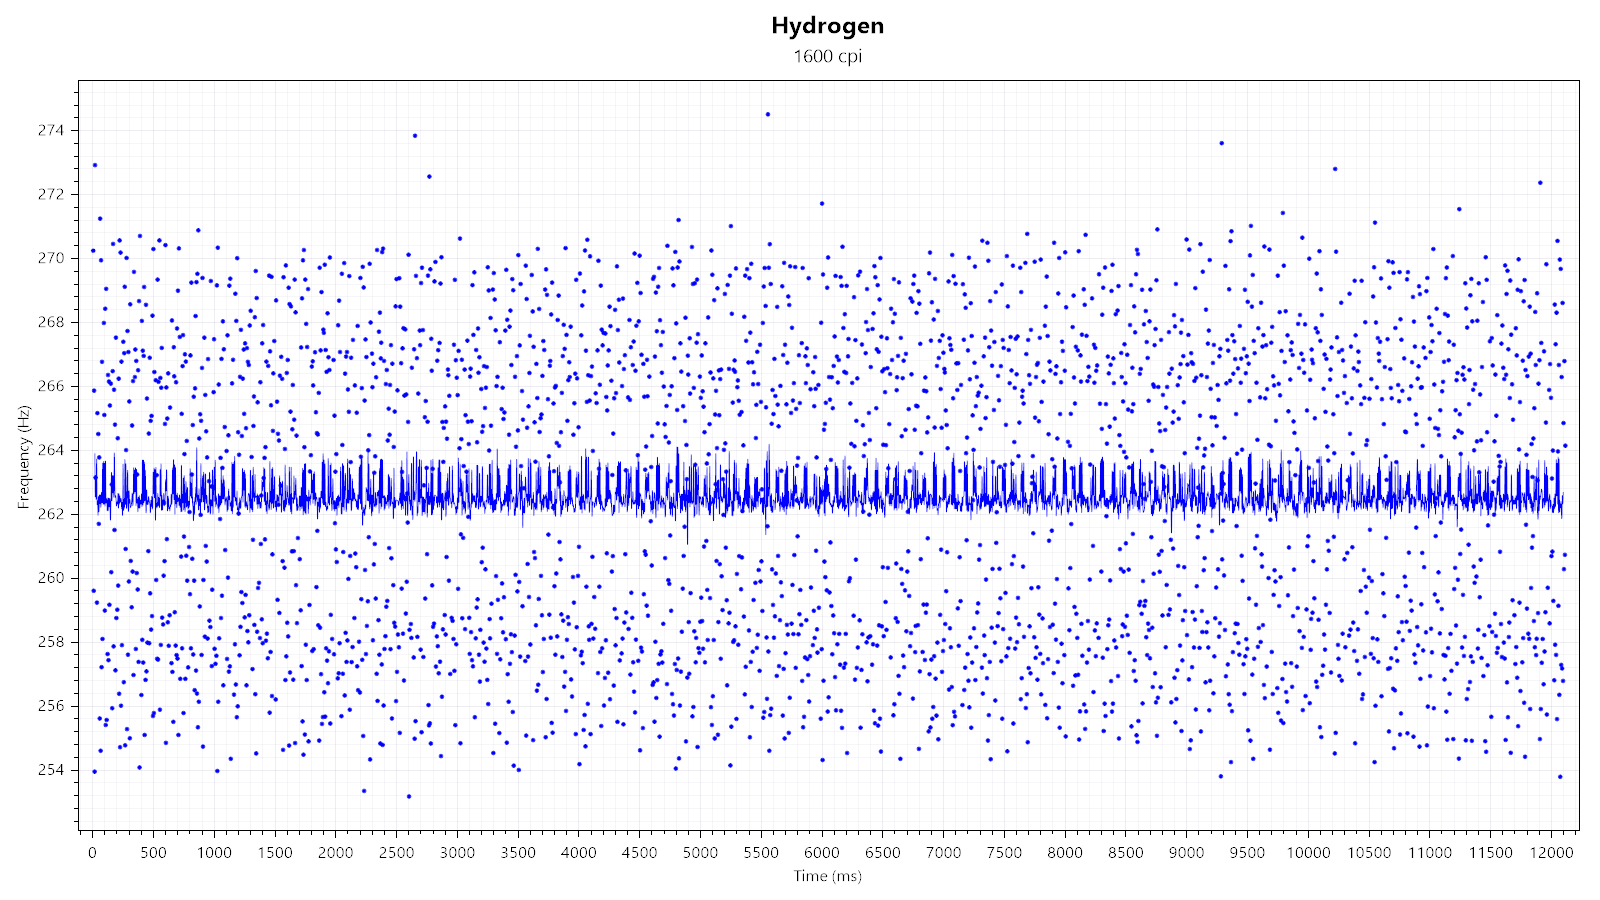
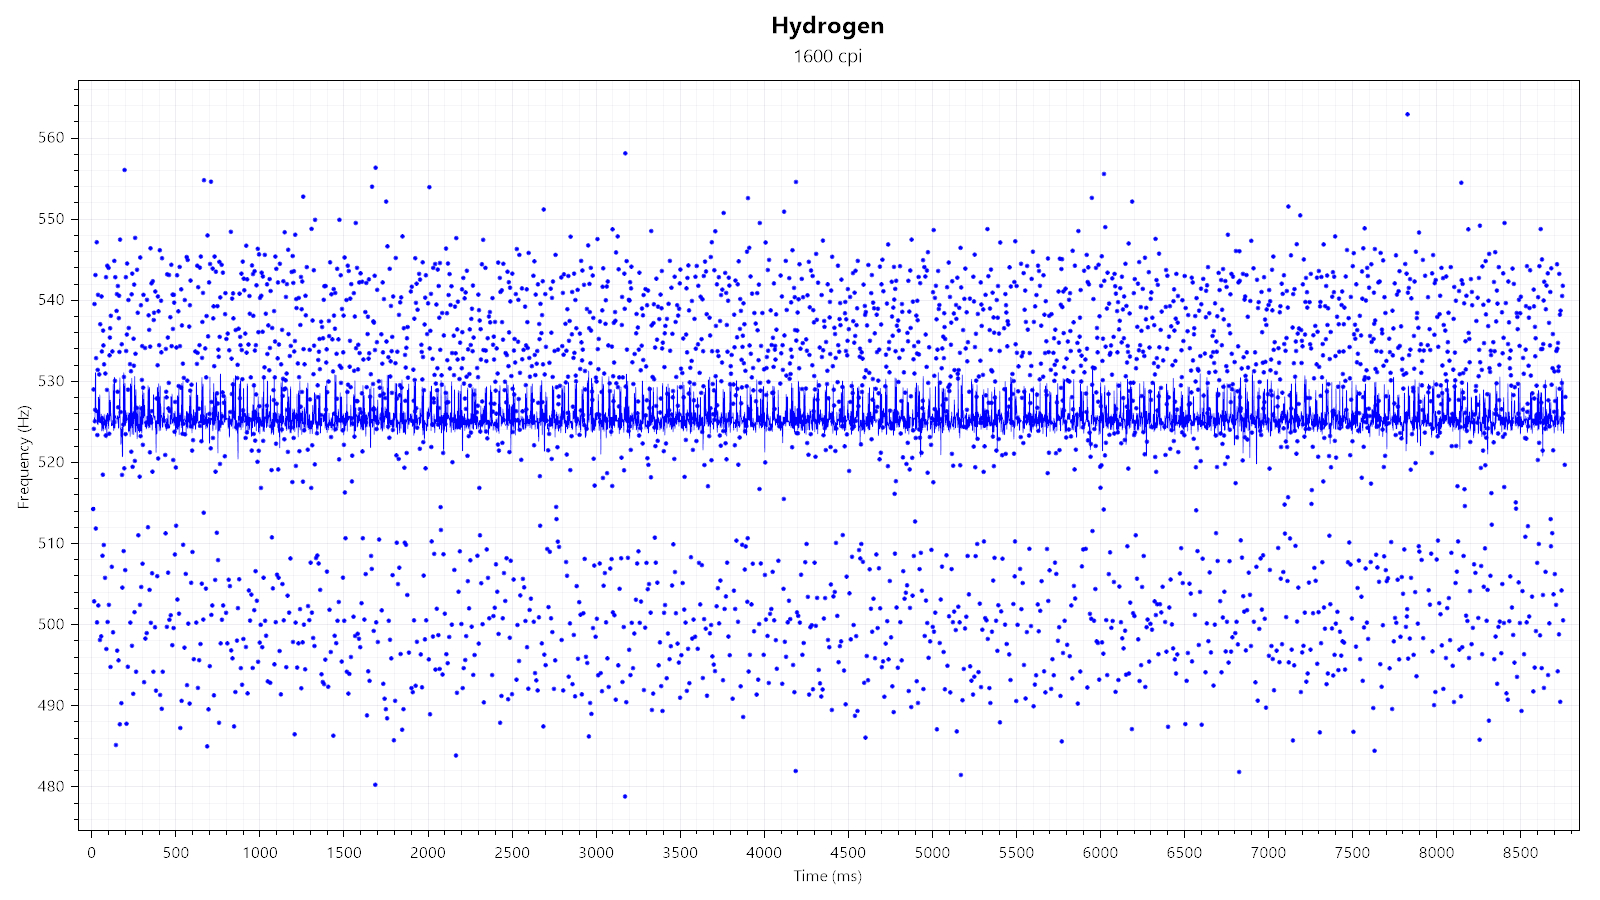
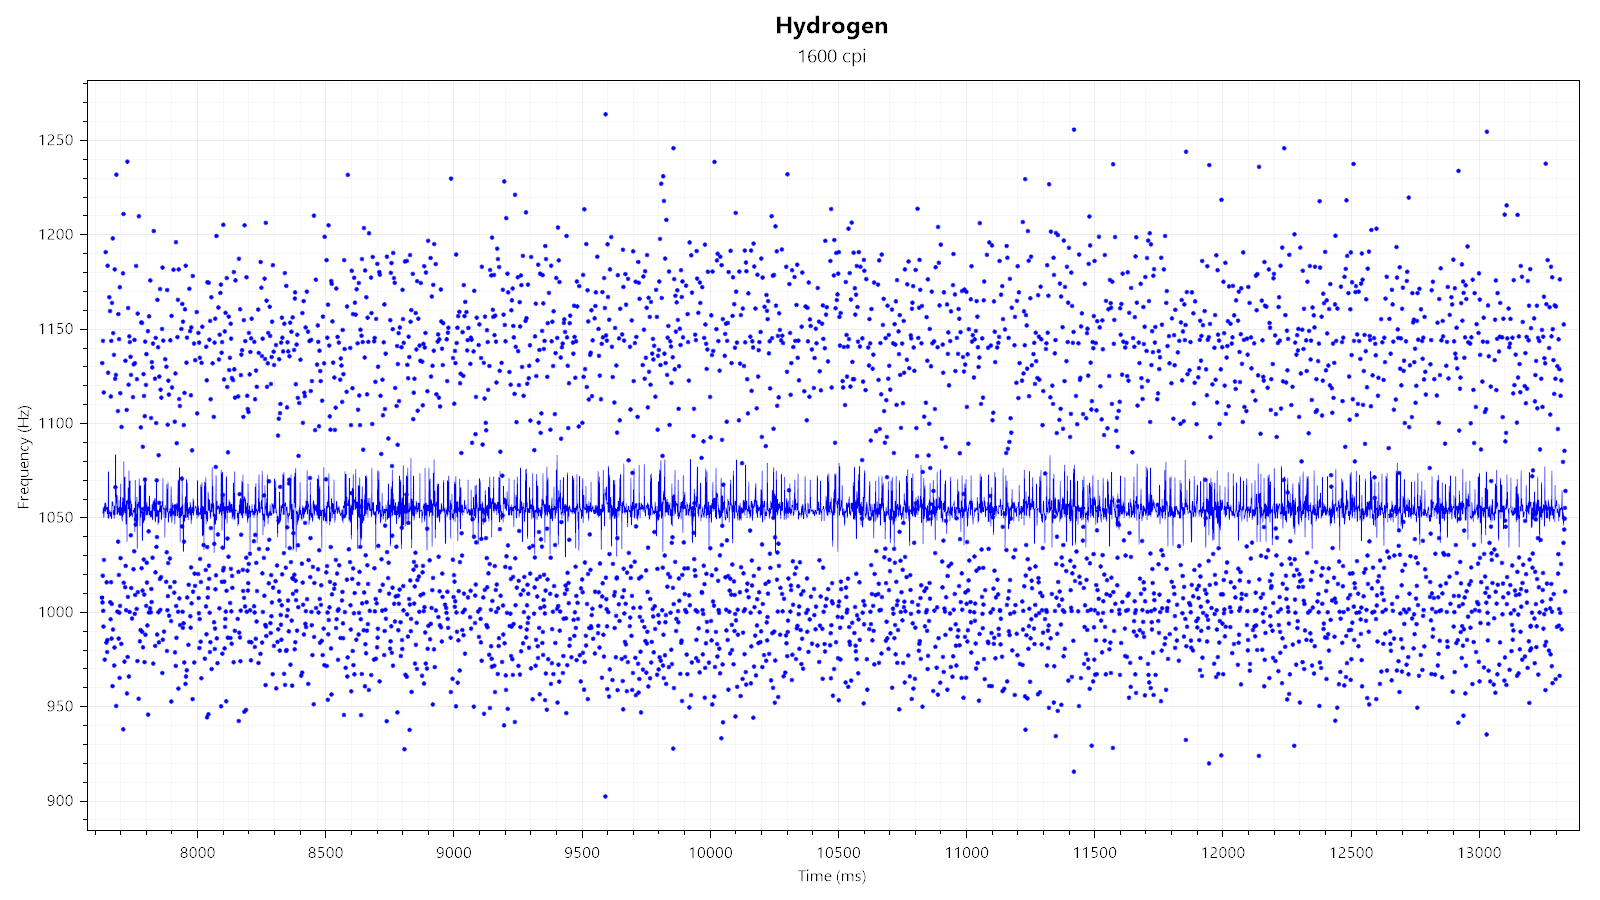
On the Hydrogen, polling of click/scroll and motion events is detached internally. As such, click/scroll events are always polled at the highest rate available (8000 Hz, 0.125 ms), whereas the sensor data rate can be adjusted. Possible values for the latter are 8, 16, 31, 63, 125, 250, 500, 1000, 2000, 3000, 4000, 5000, 6000, 7000, and 8000 Hz. For the sake of simplicity, only 125, 250, 500, and 1000 Hz are represented here. All of these behave similarly, in that the average exceeds the target, accompanied by above average variance.
Paint Test
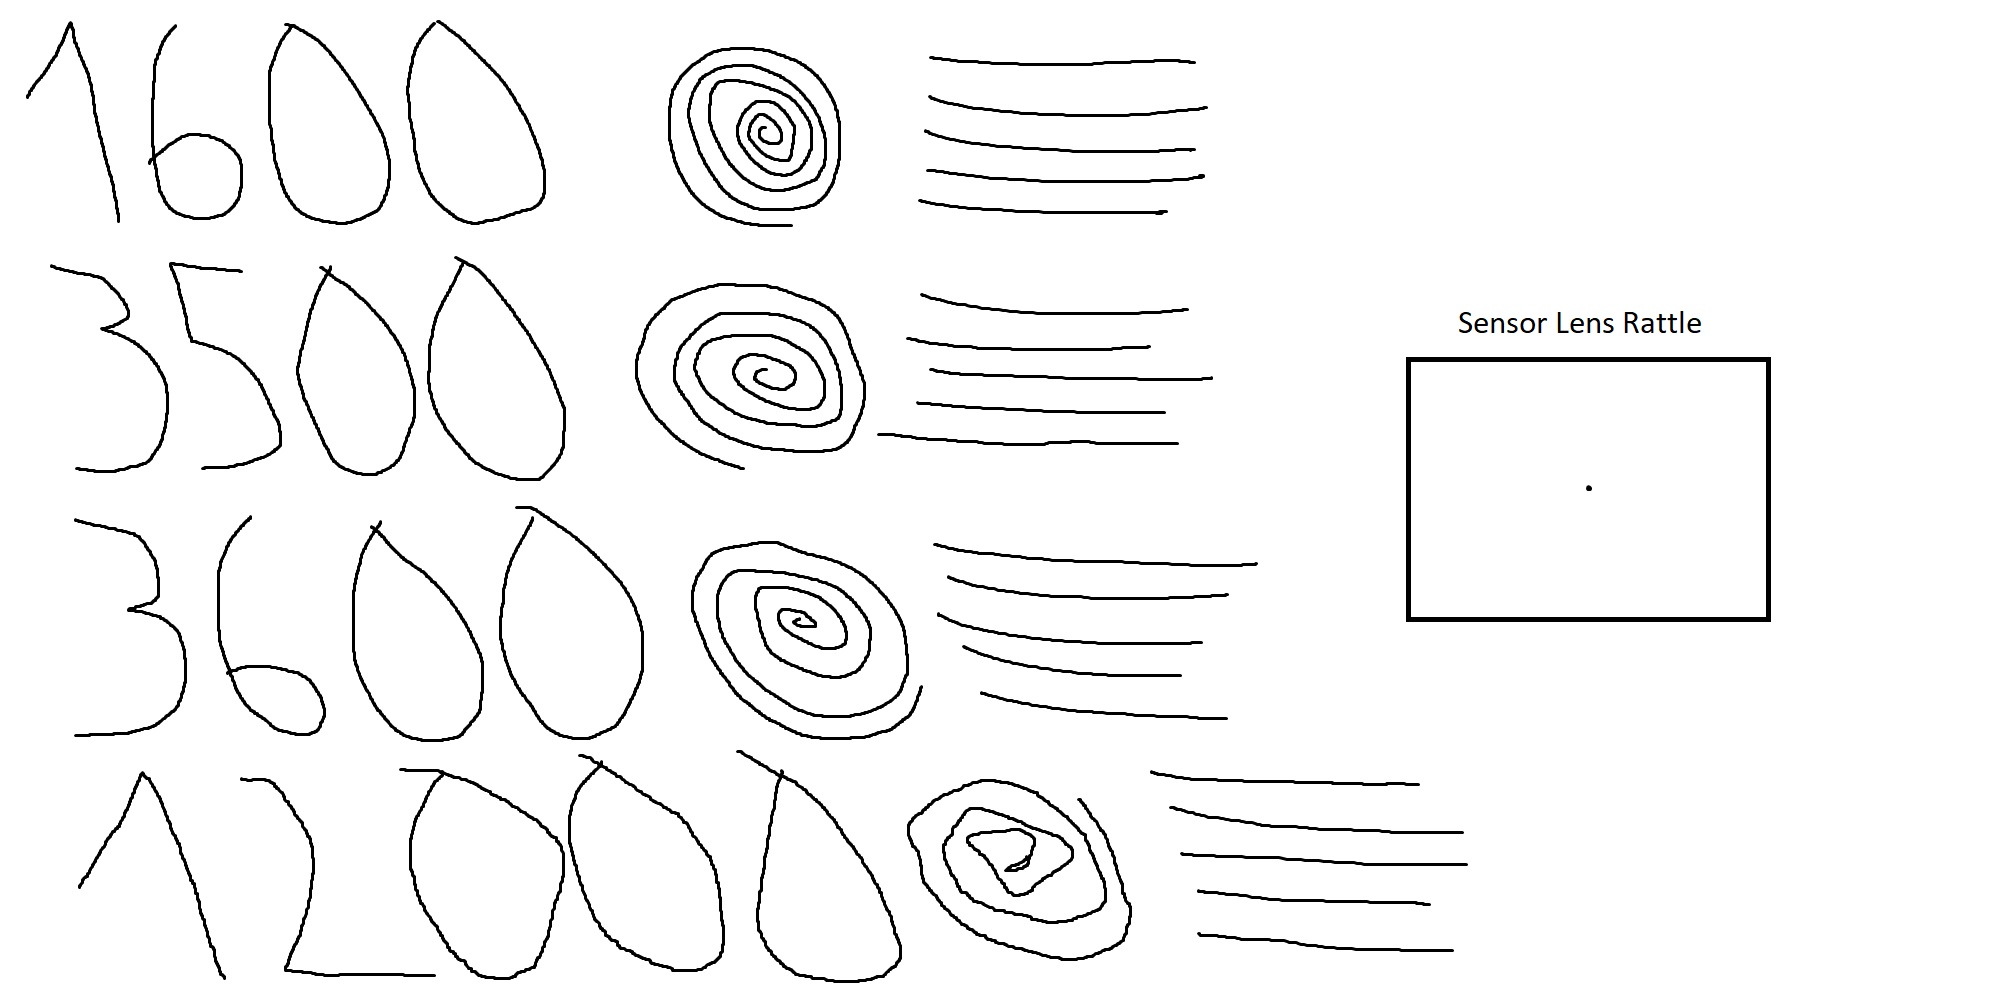
This test is used to indicate any potential issues with angle snapping (non-native straightening of linear motion) and jitter, along with any sensor lens rattle. As you can see, no issues with angle snapping can be observed. No jitter is visible at 1600 CPI. The minor jitter visible at 3500 CPI is swiftly taken care of at 3600 CPI, where smoothing is first applied. 12,000 CPI shows moderate jitter. Lastly, there is no sensor lens movement.
Lift-off Distance
The Hydrogen offers two pre-defined LOD levels. At the "2 mm" setting, the sensor does not track at a height of 1 DVD (<1.2 mm). Using the "3 mm" setting, this does not change, though I've been able to verify through other means that the setting indeed is functional. Keep in mind that LOD may vary slightly depending on the mousing surface (pad) it is being used on.Click Latency

In most computer mice, debouncing is required to avoid double clicks, slam-clicks, or other unintended effects of switch bouncing. Debouncing typically adds a delay, which, along with any potential processing delay, shall be referred to as click latency. In order to measure click latency, the mouse has been interfaced with an NVIDIA LDAT (Latency Display Analysis Tool). Many thanks go to NVIDIA for providing an LDAT device. More specifically, the LDAT measures the time between the electrical activation of the left main button and the OS receiving the button-down message. Unless noted otherwise, the values presented in the graph refer to the lowest click latency possible on the mouse in question. If a comparison mouse is capable of both wired and wireless operation, only the result for wireless (2.4 GHz) operation will be listed.
Click latency has been measured to be 0.1 ms, with standard deviation being 0.02 ms.
Jul 13th, 2025 02:42 CDT
change timezone
Latest GPU Drivers
New Forum Posts
- 9070XT BIOS flash (what to use?) (6)
- New ToS of Take Two and 2K (12)
- Radeon RX 6700, 6700 XT & 6750 XT users club (1138)
- 6400c30 vs 8000c36 Ryzen 9800X3D (0)
- Best motherboards for XP gaming (116)
- 9800x3D - 6400 CL32 1:1 not stable (12)
- Is there a WIFI chip I should get? (1)
- What are you playing? (23945)
- 9060 XT 16GB or 6800 XT/6900XT? (30)
- ASUS ProArt GeForce RTX 4060 Ti OC Edition 16GB GDDR6 Gaming - nvflash64 VBIOS mismatch (5)
Popular Reviews
- Fractal Design Epoch RGB TG Review
- Lexar NM1090 Pro 4 TB Review
- Corsair FRAME 5000D RS Review
- Our Visit to the Hunter Super Computer
- NVIDIA GeForce RTX 5050 8 GB Review
- NZXT N9 X870E Review
- Sapphire Radeon RX 9060 XT Pulse OC 16 GB Review - An Excellent Choice
- AMD Ryzen 7 9800X3D Review - The Best Gaming Processor
- Upcoming Hardware Launches 2025 (Updated May 2025)
- Chieftec Iceberg 360 Review
TPU on YouTube
Controversial News Posts
- Intel's Core Ultra 7 265K and 265KF CPUs Dip Below $250 (288)
- Some Intel Nova Lake CPUs Rumored to Challenge AMD's 3D V-Cache in Desktop Gaming (140)
- AMD Radeon RX 9070 XT Gains 9% Performance at 1440p with Latest Driver, Beats RTX 5070 Ti (131)
- NVIDIA Launches GeForce RTX 5050 for Desktops and Laptops, Starts at $249 (120)
- NVIDIA GeForce RTX 5080 SUPER Could Feature 24 GB Memory, Increased Power Limits (115)
- Microsoft Partners with AMD for Next-gen Xbox Hardware (105)
- Intel "Nova Lake‑S" Series: Seven SKUs, Up to 52 Cores and 150 W TDP (100)
- NVIDIA DLSS Transformer Cuts VRAM Usage by 20% (97)