Wednesday, May 13th 2020

Backblaze Releases Hard Drive Stats for Q1 2020 - Seagate Worst Performer
As of March 31, 2020, Backblaze had 132,339 spinning hard drives in our cloud storage ecosystem spread across four data centers. Of that number, there were 2,380 boot drives and 129,959 data drives. This review looks at the Q1 2020 and lifetime hard drive failure rates of the data drive models currently in operation in our data centers and provides a handful of insights and observations along the way. In addition, near the end of the post, we review a few 2019 predictions we posed a year ago. As always, we look forward to your comments.
Hard Drive Failure Stats for Q1 2020
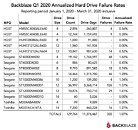
At the end of Q1 2020, Backblaze was using 129,959 hard drives to store customer data. For our evaluation we remove from consideration those drives that were used for testing purposes and those drive models for which we did not have at least 60 drives (see why below). This leaves us with 129,764 hard drives. The table below covers what happened in Q1 2020.Notes and Observations
The Annualized Failure Rate (AFR) for Q1 2020 was 1.07%. That is the lowest AFR for any quarter since we started keeping track in 2013. In addition, the Q1 2020 AFR is significantly lower than the Q1 2019 AFR which was 1.56%.
During this quarter 4 (four) drive models, from 3 (three) manufacturers, had 0 (zero) drive failures. None of the Toshiba 4 TB and Seagate 16 TB drives failed in Q1, but both drives had less than 10,000 drive days during the quarter. As a consequence, the AFR can range widely from a small change in drive failures. For example, if just one Seagate 16 TB drive had failed, the AFR would be 7.25% for the quarter. Similarly, the Toshiba 4 TB drive AFR would be 4.05% with just one failure in the quarter.
On the contrary, both of the HGST drives with 0 (zero) failures in the quarter have a reasonable number of drive days, so the AFR is less volatile. If the 8 TB model had 1 (one) failure in the quarter, the AFR would only be 0.40% and the 12 TB model would have an AFR of just 0.26% with 1 (one) failure for the quarter. In both cases, the 0% AFR for the quarter is impressive.
There were 195 drives (129,959 minus 129,764) that were not included in the list above because they were used as testing drives or we did not have at least 60 drives of a given model. For example, we have: 20 Toshiba 16 TB drives (model: MG08ACA16TA), 20 HGST 10 TB drives (model: HUH721010ALE600), and 20 Toshiba 8 TB drives (model: HDWF180). When we report quarterly, yearly, or lifetime drive statistics, those models with less than 60 drives are not included in the calculations or graphs. We use 60 drives as a minimum as there are 60 drives in all newly deployed Storage Pods.
Lifetime Hard Drive Stats
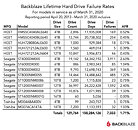
The table below shows the lifetime failure rates for the hard drive models we had in service as of March 31, 2020. The reporting period is from April 2013 through December 31, 2019. All of the drives listed were installed during this timeframe.
Source:
Backblaze
Hard Drive Failure Stats for Q1 2020
At the end of Q1 2020, Backblaze was using 129,959 hard drives to store customer data. For our evaluation we remove from consideration those drives that were used for testing purposes and those drive models for which we did not have at least 60 drives (see why below). This leaves us with 129,764 hard drives. The table below covers what happened in Q1 2020.Notes and Observations
The Annualized Failure Rate (AFR) for Q1 2020 was 1.07%. That is the lowest AFR for any quarter since we started keeping track in 2013. In addition, the Q1 2020 AFR is significantly lower than the Q1 2019 AFR which was 1.56%.
During this quarter 4 (four) drive models, from 3 (three) manufacturers, had 0 (zero) drive failures. None of the Toshiba 4 TB and Seagate 16 TB drives failed in Q1, but both drives had less than 10,000 drive days during the quarter. As a consequence, the AFR can range widely from a small change in drive failures. For example, if just one Seagate 16 TB drive had failed, the AFR would be 7.25% for the quarter. Similarly, the Toshiba 4 TB drive AFR would be 4.05% with just one failure in the quarter.
On the contrary, both of the HGST drives with 0 (zero) failures in the quarter have a reasonable number of drive days, so the AFR is less volatile. If the 8 TB model had 1 (one) failure in the quarter, the AFR would only be 0.40% and the 12 TB model would have an AFR of just 0.26% with 1 (one) failure for the quarter. In both cases, the 0% AFR for the quarter is impressive.
There were 195 drives (129,959 minus 129,764) that were not included in the list above because they were used as testing drives or we did not have at least 60 drives of a given model. For example, we have: 20 Toshiba 16 TB drives (model: MG08ACA16TA), 20 HGST 10 TB drives (model: HUH721010ALE600), and 20 Toshiba 8 TB drives (model: HDWF180). When we report quarterly, yearly, or lifetime drive statistics, those models with less than 60 drives are not included in the calculations or graphs. We use 60 drives as a minimum as there are 60 drives in all newly deployed Storage Pods.
Lifetime Hard Drive Stats
The table below shows the lifetime failure rates for the hard drive models we had in service as of March 31, 2020. The reporting period is from April 2013 through December 31, 2019. All of the drives listed were installed during this timeframe.


32 Comments on Backblaze Releases Hard Drive Stats for Q1 2020 - Seagate Worst Performer
They had a good quality increase in the last few years over the 7200.N series disasters, so that's to appreciate.
Currently I think HGST and their very specific industrial/enterprise models are pretty good choice. Mostly those with He inside. Unfortunately mix of big capacity, He and fast HDD = quite high price.
Backblaze doesnt use those top priced I think, but who knows..
As for dumping WD, well, HGTS is WD brand for commercial sector.
By the way, SSDs are same. If you want fast and reliable SSD, dont expect low price. Those "last forever" SSDs cost a lot.
I have currently two SeaGates, both ES, one has 1360h, another year more. Both in top shape. But at time when I bought them, they cost nearly 3x of average HDD of same capacity. Worth it? Yea sure, cause I did try regular HDDs and one died within month and half, and other in 6 months. Not going back to "regular" HDDs. I like my data a bit too much for that.
They build drives with a big enough of a margin that drives could fail. And it's more easyer to simply replace/RMA the thing rather then using it to it's full extend. Really i'd like to see HDD's that operate for at least a good 3 to 6 years before showing any signs of faillure.
That being said, in the 30 years that i've been into computing, the only drives i've ever had fail on me is Seagate (several times) and a WD Green (which was DOA - no data loss).
Find those drives that are “bad” (whopping 1.4% failure), check how many disks were used, and them check how many days that they were used. Of course the failure rates are higher — there are sometimes 3x as many as disks used for 3x as long than the next manufacturer’s largest/oldest deployment.
Making generalizations about manufacturers is exactly how not to look at this data. Determining which model might last longest in your RAID is the best you can do if you’re not BB.
Rough math is that you’re comparing ~95,000 Seagate disks to ~29,000 HGST and 7299 Toshiba disks... The pool sizes are too dissimilar to provide statistical relevance. To make a generalization about “worst performer (in a segment),” which is the conclusion the reader draws from the headline in this context (being a consumer tech site, and the forum debate that follows about which drive to buy and whether these results matter to... anyone), it’d be responsible to use data that doesn’t leave out the second largest seller of disks in that market.Exactly my point — “performer” here is a misnomer, especially when you’re using the quarterly results to make that claim...
You’re (both) right, though; Seagate is the worst performer in backblaze’s unique environment where Seagate makes up 73% of the population, WD is not represented, HGST is underrepresented, and a statistically irrelevant number of Toshiba drives were measured.
I'd also like to point out that unless a statistically relevant amount of data is available, statistics should not be used! End of story!
@Raevenlord should have used title like 'Backblaze quarterly results are up, net amounts of failures drop YoY...' or similar. Good journalism is all about facts. Sadly, give how stupid the most people are (me incl.) it's better for them to be spared from some facts. :D
I have personally avoided Seagate drives for a very long time until I got my NAS last year. The boycott was due to 4 Seagate Barracudas failing one after another in my laptop. Good thing the laptop came with onsite warranty and the technician replaced them one after another.
Doesn't stop the weird Seagate hate I've never understood though. They seemingly had a bad batch of consumer drives around "the flood" that they never quite recovered their reputation from.
Also, remember that these numbers are for several reasons we have discuess before, really quite worthless (BackBlaze numbers).
But other than that, I'd literally take any Seagate drive over a WD Blue.
I have replaced SO MANY Seagate drives in my career. I would never buy or recommend Seagate drives. From DOAs, to weird noises, headparking issues and drives that just stop working. Seen it all and Seagate RMA is absolute hell.
WD / HGST for me. I have used WAY MORE of these drives and done LESS replacements.
So it's still worth it. ONLY because of price. Why do you think Seagate drives are CHEAPER to begin with?
Regular users, home NAS builders etc, would not want to go with with Seagate drives.
WAY more issues on average and home users have much less fault tolerance - meaning chance of data loss will be higher going with Seagate drives. Not many consumers can tolerate more than 1 dead drive, if any...
There's no empirical evidence that Seagate drives are worse than others for home users and NAS builders.