Thursday, June 24th 2021

3DMark Updated with New CPU Benchmarks for Gamers and Overclockers
UL Benchmarks is expanding 3DMark today by adding a set of dedicated CPU benchmarks. The 3DMark CPU Profile introduces a new approach to CPU benchmarking that shows how CPU performance scales with the number of cores and threads used. The new CPU Profile benchmark tests are available now in 3DMark Advanced Edition and 3DMark Professional Edition.
The 3DMark CPU Profile introduces a new approach to CPU benchmarking. Instead of producing a single number, the 3DMark CPU Profile shows how CPU performance scales and changes with the number of cores and threads used. The CPU Profile has six tests, each of which uses a different number of threads. The benchmark starts by using all available threads. It then repeats using 16 threads, 8 threads, 4 threads, 2 threads, and ends with a single-threaded test. These six tests help you benchmark and compare CPU performance for a range of threading levels. They also provide a better way to compare different CPU models by looking at the results from thread levels they have in common.The 3DMark CPU Profile shows you how your CPU scores compare with other results from the same CPU model. It's a great way to check if your CPU is performing as expected. For overclockers, the 3DMark CPU Profile shows the overclocking potential of your CPU and provides more ways to track and measure the gains from overclocking.
More cores, more threads
The trend in processor development is towards an increasing number of cores. More cores mean more work can be performed at the same time.
Simultaneous multithreading (SMT) enables each core to run multiple threads. The more threads you have, the greater the throughput of work.
However, core counts are increasing faster than the ability of popular applications to make use of them. Some tasks are more suited to multithreading and multiple cores than others.
A modern CPU benchmark should demonstrate the benefits of having many cores and threads by scaling beyond 16 threads. It should also show how a processor performs for gaming and other real-world activities where performance rarely scales beyond a modest number of cores and threads.
It is not possible to represent both these aspects of CPU performance with a single number. A different type of benchmark is needed.
3DMark CPU Profile benchmarks
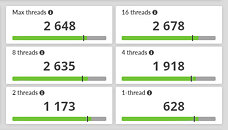
The 3DMark CPU Profile includes six tests that feature a combination of physics computations and custom simulations. All six tests use the same workload; it is only the amount of threading that changes, with tests limited to using either 1, 2, 4, 8, 16, or the maximum number of available threads.
Each of the six tests produces a score. Scores are comparable across tests. You can compare the 8-thread score with the 4-thread score, for example. A higher score means the CPU performed the work faster.
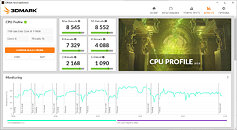
A hardware monitoring chart shows you how the CPU clock frequency and CPU temperature changed while the tests were running.
How to benchmark and compare CPU performance
The 3DMark CPU Profile shows you how your CPU scores compare with other results from the same processor.
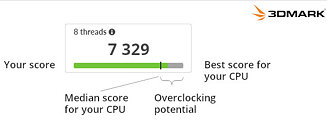
The green bars on the 3DMark CPU Profile result screen show you how your scores compare with the best scores for your CPU. The longer the green bar, the closer your score is to the best result for your CPU model.
The median score, shown by the marker, shows the performance level you should expect for your CPU. In most cases, the median represents performance with stock settings. If your score is below the median, it may indicate a problem with cooling or background processes. Check the hardware monitoring chart to see how the CPU temperature changed during the run.
The distance from the median marker to the end of the bar represents the overclocking potential of the CPU. For overclockers, the 3DMark CPU Profile provides more ways to measure the effects of overclocking and more ways to compete for the highest scores!
Please note that these features are powered by benchmark results from 3DMark users. These insights may be unavailable for some CPU models until enough results are submitted.
Your 3DMark CPU Profile scores should increase up to the number of threads supported by your CPU. In this screenshot from a CPU with 4 cores and 8 threads, you can see that the scores for 8 threads, 16 threads and Max threads are the same within the usual 3% accuracy range for UL benchmarks. For CPUs with SMT, which have more threads than cores, the benefit of having more threads decreases beyond the number of CPU cores.
Six levels of CPU performance
The 3DMark CPU Profile includes six tests. These six levels make it easier to compare the performance of different CPU models by looking at the results from thread levels they have in common.
Max threads
The Max-threads score represents the full performance potential of your CPU when using all available threads. The practical use cases for this score lie outside of gaming in extremely heavy, multithreading workloads such as movie-quality rendering, simulations, and scientific analysis.
16 threads
Computationally intensive tasks such as digital content creation and 3D rendering benefit from more threads, but the 16-threads score is less relevant for estimating practical gaming performance.
8 threads
Modern DirectX 12 games make better use of multithreaded performance beyond 4 cores. The gaming performance of a CPU usually correlates most closely with the 8-threads score. This score also has a high correlation with the 3DMark Time Spy CPU score.
4 threads and 2 threads
Older games developed for DirectX 9 are often bottlenecked by the CPU on modern gaming PCs. The frame rates of popular esports titles, such as DotA 2, League of Legends, and Counter-Strike: Global Offensive, usually correlate most closely with the 2-threads and 4-threads scores.
1 thread
The 1-thread score is a fundamental measure of the processor's performance. For games and real-world use cases, however, the multithreaded scores are usually a better indicator of practical performance.


25 Comments on 3DMark Updated with New CPU Benchmarks for Gamers and Overclockers
Give us a download link for the benchmark.
It seems you are right here, checked a score with a ThreadRipper. But, you have to improve your manners.
I will check it out to see where my 5900X is on this scale in comparison to other 5900X's with the Curve Tuning that I applied.
Was looking for available for win-11 only lol
Why does it cost money?
Sorry, GeekBench5 looks like a whole better idea.
The whole suite is on sale on steam for $5.
I did get the steam version of 3dmark for 4.99 long ago whether this is included or not I have no idea doubt I'd pay for this addition.
Nothing personal against you though.
So, just out of curiosity. How did you managed to know "everything" about me, and especially my problem with "reading comprehension", by just "reading one post"?
And don't worry, I am not tired of people who know "everything". So, feel free to explain.
I bought this suite some years ago directly from their website and I received this update yesterday.
This suite contained until now mostly Graphic card tests and now they added this CPU oriented test.
The famous benchmark tools like Time Spy, Fire Strike and Port Royal are all contained in this suite.
It also contains stress tests like Fire Strike Extreme stress test which are used to test the stability of GPU OC:
benchmarks.ul.com/3dmark
Many enthusiast like me :D who like to OC their GPU to the limits uses these benchmarks to compare in the online database how good they are compared to others with similar card or competitors card and also to do Stress test to check if OC will be at all stable in games.
www.techpowerup.com/forums/threads/the-rx-6000-series-owners-club.276164/post-4546490
There are even challenges like on HWBOT to reach the Ultimate OC to be on the top of the chart on 3DMARK website.:p
I am not part of that community. My target is to get best daily gaming OC setting but not getting an OC that will be stable for one run in order to reach top of the chart. :laugh:
So for me personally, it was worth to buy this suite to find good and stable OC conditions on my GPU in the past. I have been using it since the days of Vega 64 card.
No, not that cricket one!
But, was it a fair game and something "I started", coming to conclusions about the other person based on a mistake?
Do you say that every person who posts something inaccurate or just wrong in this forum, should accept personal judgement in the boundaries of insults without reacting because "he/she started"?
As I said, he was right. But he posted, TWICE, with the wrong, in my opinion, attitude. I did it ONCE with the importand difference that I was not targeting someone, I was corrected.
PS I don't try to start a flame war here. You may delete whatever you find off topic, just delete everything, not some.
www.3dmark.com/cpu/24253
Already obsessing over this #1 and #2 discrepancy. If you look at nearly all 8750H scores you'll see a trend between all 6 tests in regards to the difference in points between scores. Looking at the #1 score this trend is thrown for a complete loop. It scores lower than some of the Top 5 8750H results in 4 of the 6 tests but in the final 2 tests leaps ahead by nearly 100 points which seems implausible on a locked CPU. By all I can figure "I should have beat him".
My only guess is a BLCK overclock via BIOS in the range of 100-102MHz as I've seen this on MSI laptops but never actually in valid benchmark results. Not sure how to message to user and ask, and I don't necessarily want to dispute the score (not that I could do that either). But if that is the case, why is the max reported frequency only 4GHz? It should be 4102+ with a BCLK overclock. It doesn't add up.